Fermi-LAT Sensitivity to Dark Matter Annihilation in Via Lactea II Substructure
Abstract
We present a study of the ability of the Fermi Gamma-ray Space Telescope to detect dark-matter annihilation signals from the Galactic subhalos predicted by the Via Lactea II N-body simulation. We implement an improved formalism for estimating the boost factor needed to account for the effect of dark-matter clumping on scales below the resolution of the simulation, and we incorporate a detailed Monte Carlo simulation of the response of the Fermi-LAT telescope, including a simulation of its all-sky observing mode integrated over a ten year mission. We find that for WIMP masses up to about 150 GeV/ in standard supersymmetric models with , a few subhalos could be detectable with standard deviations significance and would likely deviate significantly from the appearance of a point source.
1 Introduction
Even 75 years after the first observational evidence for a non-luminous form of matter (Zwicky, 1933) we know remarkably little about the nature of the hypothesized dark matter particle. A promising way forward is indirect detection, whereby ground and space-based observatories are searching for the products of pair annihilations of dark matter particles, such as neutrinos, relativistic positrons, or gamma-rays.
The gamma-ray signal in particular has received a lot of attention in recent years, owing in part to the launch of the Fermi Gamma-ray Space Telescope. Numerous papers have discussed whether the Large Area Telescope (LAT) aboard Fermi will be sensitive enough to detect this signal and how to differentiate it from conventional astrophysical sources, e.g. Baltz et al. (2007). It appears that a detection is challenging but feasible for a wide range of plausible physics models (Baltz et al., 2008). The Galactic Center (GC) has the greatest and closest concentration of dark matter in the Local Group and as such is a promising target (Berezinsky et al., 1994; Bergström et al., 1998; Cesarini et al., 2004; Jeltema & Profumo, 2008). It is, unfortunately, also a very active region, with a bright diffuse flux of gamma-rays from cosmic-ray interactions as well as being filled with numerous hard X-ray and gamma-ray sources such as supernova remnants, pulsar wind nebulae, X-ray binaries, etc. (Aharonian et al., 2006; Kuulkers et al., 2007), which complicate attempts to search for a DM annihilation signal. Alternatively, the diffuse gamma-ray signal from the Milky Way host halo out beyond several degrees from the GC has been suggested as the most promising (Stoehr et al., 2003; Springel et al., 2008), but it will be difficult to disentangle from the poorly constrained diffuse Galactic gamma-ray background arising from cosmic-ray interactions with interstellar hydrogen and the interstellar radiation field (Strong et al., 2004). Instead, the centers of Galactic subhalos may prove to be the most detectable and least ambiguous sources of gamma-rays from DM annihilations. These could be either subhalos hosting dwarf satellites (Strigari et al., 2008) or one of the many dark subhalos predicted by numerical simulations (e.g. Diemand et al., 2008; Kuhlen, 2009).
Subhalos as sources have recently been considered by Kuhlen et al. (2008), who used the Via Lactea II simulation (VL2) in conjunction with a realistic treatment of the expected backgrounds to show that a handful, even up to a few dozen, subhalos should be detectable with the Fermi-LAT at more than significance for a standard weakly interacting DM particle with a mass between 50 and 500 GeV and a cross section in the range . That analysis assumed homogenous sky-coverage, an angular resolution of 9′, and used a pre-launch estimate of the energy-dependent effective area of the LAT. The present paper updates and improves upon that analysis by running the same VL2 all-sky emission maps and the diffuse background predictions through a Monte Carlo simulation of the Fermi-LAT instrument, taking into account the time-dependent sky coverage and an energy-dependent instrument response and angular resolution. Additionally we introduce an improved treatment of the boost factor due to the DM substructure below the resolution limit of the N-body simulation.
2 Methods
The VL2 simulation is a one of the highest resolution cosmological simulations of the formation of a Milky-Way-scale dark matter halo to date (Diemand et al., 2008). It employs just over one billion particles to model the formation of a Milky-Way size halo and its substructure. It resolves over 50,000 subhalos today within the host’s kpc (the radius enclosing an average density 200 times the cosmological mean matter density). As described in more detail in Kuhlen et al. (2008), the simulated dark matter distribution was used to construct all-sky maps of the annihilation flux for a set of observers located 8 kpc from the host halo’s center. These maps consist of pixels equally spaced in longitude and the cosine of colatitude, corresponding to a solid angle per pixel of sr, and form the basis for our studies assessing the capability of the Fermi-LAT to detect signals from individual subhalos. To correct for the artificially low central densities of poorly resolved subhalos, the surface brightness from the central region of each subhalo was increased on a pixel-by-pixel basis to match the expected surface brightness of an NFW (Navarro, Frenk, & White, 1996) halo with the subhalo’s measured and . Note that assuming an NFW profile is somewhat conservative: using the density profiles measured directly in large N-body simulations (e.g. VL2, Springel et al 2008) or one of the newer fitting functions instead of NFW leads to an increase of about 30% in the halo luminosity (Diemand & Moore, 2010).
In an attempt to account for the increase in luminosity due to clumping of the dark matter distribution below the scales resolved by the simulation, we “boost” the total flux from a subhalo of mass by a factor , determined from an analytic model (described in Kuhlen et al., 2008) that depends on the slope and low mass cutoff of the subhalo mass function. In Kuhlen et al. (2008) this resulted in a factor of difference in the number of detectable subhalos depending on the values of these uncertain parameters. The prescription applied there, however, does a poor job of accounting for the expected radial distribution of this boost. By summing (where and are the mass and density of the simulation particle) over all the subhalo’s particles within a given pixel, the radial dependence of the boost effectively followed that of the subhalo’s smooth luminosity profile, whereas it really should have followed the radial profile of the subhalo population. As such it overly boosted the bright central region, and the results for the most strongly boosted scenarios () were overly optimistic.
In this work we apply the boost factor in a way that more appropriately accounts for the radial distribution of subhalos.111The numerical simulations do not have sufficient resolution to address directly the radial distribution of sub-subhalos within subhalos, so we are guided by the radial distribution of subhalos within the host halo. The boosted luminosity of a subhalo of mass is now given by
| (1) |
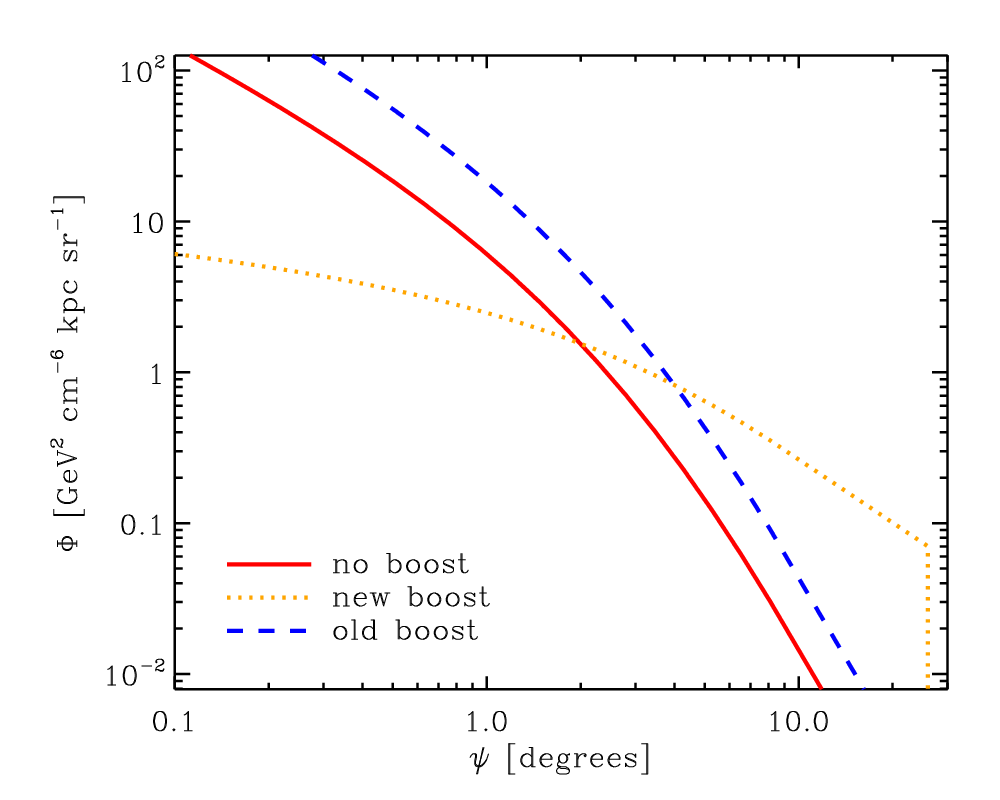
The sum is over all of the subhalo’s particles, and is the particle-mass-weighted mean density of the subhalo. Note that just as in the original prescription, the total subhalo luminosity equals times the smooth luminosity, but that the radial dependence of the boosted component (i.e. ) now follows the mass, not the luminosity. See Figure 1 for a comparison of the different boost intensity profiles. This new prescription may still lead to an overly centrally concentrated boost, since the radial number density profile of subhalos is known to be anti-biased with respect to the host’s mass density profile (Diemand et al., 2007). Note however that the size of this anti-bias depends strongly on the way a subhalo sample is defined. Springel et al. 2008 used samples selected by the present subhalo mass, which show the largest anti-bias, but are irrelevant for the luminosity distribution of substructure. Tidal mass loss affects subhalo masses much more than subhalo luminosities. The mass of subhalos near the halo center is reduced the most, introducing a strong anti-bias into any mass selected sample. But the samples relevant here consist of subhalos that, despite the tidal effects, remain above a certain luminosity, not above a certain mass. Such luminosity selected subhalo samples show practically no anti-bias. Only within about 5% of the virial radius does the subhalo number density profile become shallower than the mass density profile (Figure 6 in Diemand & Moore (2010)). There, . In other words, Eqn. (1) follows the real luminosity distribution very well and the correction in the very inner parts over-estimates the total luminosity by a few percent at most. We use a boost with , normalized to have 10% of the mass in clumps containing between 10-5 and 10-2 times the total mass. This provides an upper bound for the boost factor, and we include the overly pessimistic unboosted case as a lower bound.
2.1 Observation Simulation
The Fermi-LAT observation simulation program, gtobssim, that is part of the LAT Science Tools package supported by the Fermi Science Support Center (FSSC), uses parameterized instrument response functions (based on detailed Monte-Carlo simulations backed up by beam testing) to approximate the response of the LAT instrument in orbit.222http://Fermi.gsfc.nasa.gov/ssc For each source, the user provides the spacecraft pointing history, a FITS sky map of the sources, and the total photon flux. Simulating operation in “sky-survey” mode (nearly uniform exposure) over a ten year period, we generate realistic diffuse background predictions as well as predictions for the WIMP (Weakly Interacting Massive Particle) gamma-ray signal.
The simulation includes the dependence of the LAT effective area on the viewing angle and photon energy, after accounting for all selection effects, including the trigger, the on-board filter, and the extensive offline analysis used to reduce cosmic-ray background to a low level. The simulation of the point-spread function (PSF) accounts for the dependencies on inclination angle and energy and also includes a parametrization of the significant non-Gaussian tails. Conversions in the thin versus thick tungsten foils are separately parameterized, an important detail considering that almost half of the LAT effective area is from thick-foil conversions, for which the angular resolution is roughly a factor of two worse. The observation simulation includes the rocking of the instrument toward the orbital poles to improve uniformity of the all-sky exposure, and it also takes into account dead time, in particular the passages through the South Atlantic Anomaly, during which triggering of the LAT is disabled (Atwood et al., 2009).
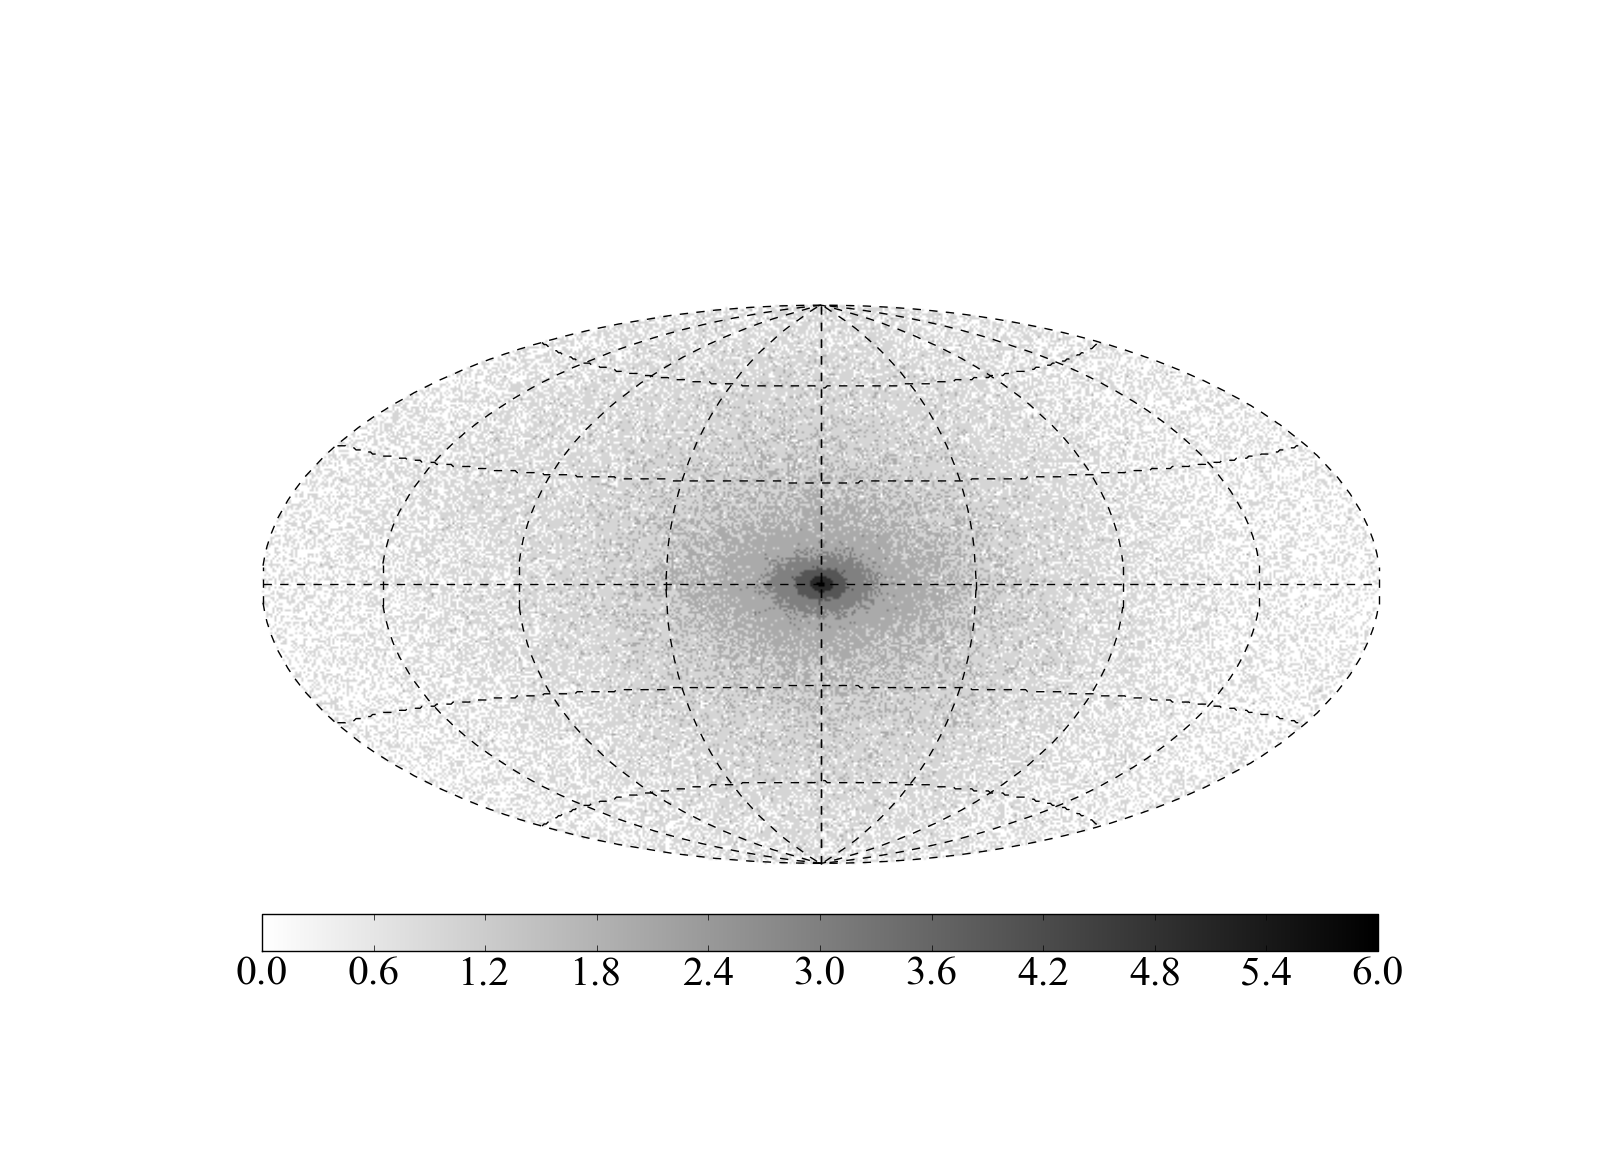
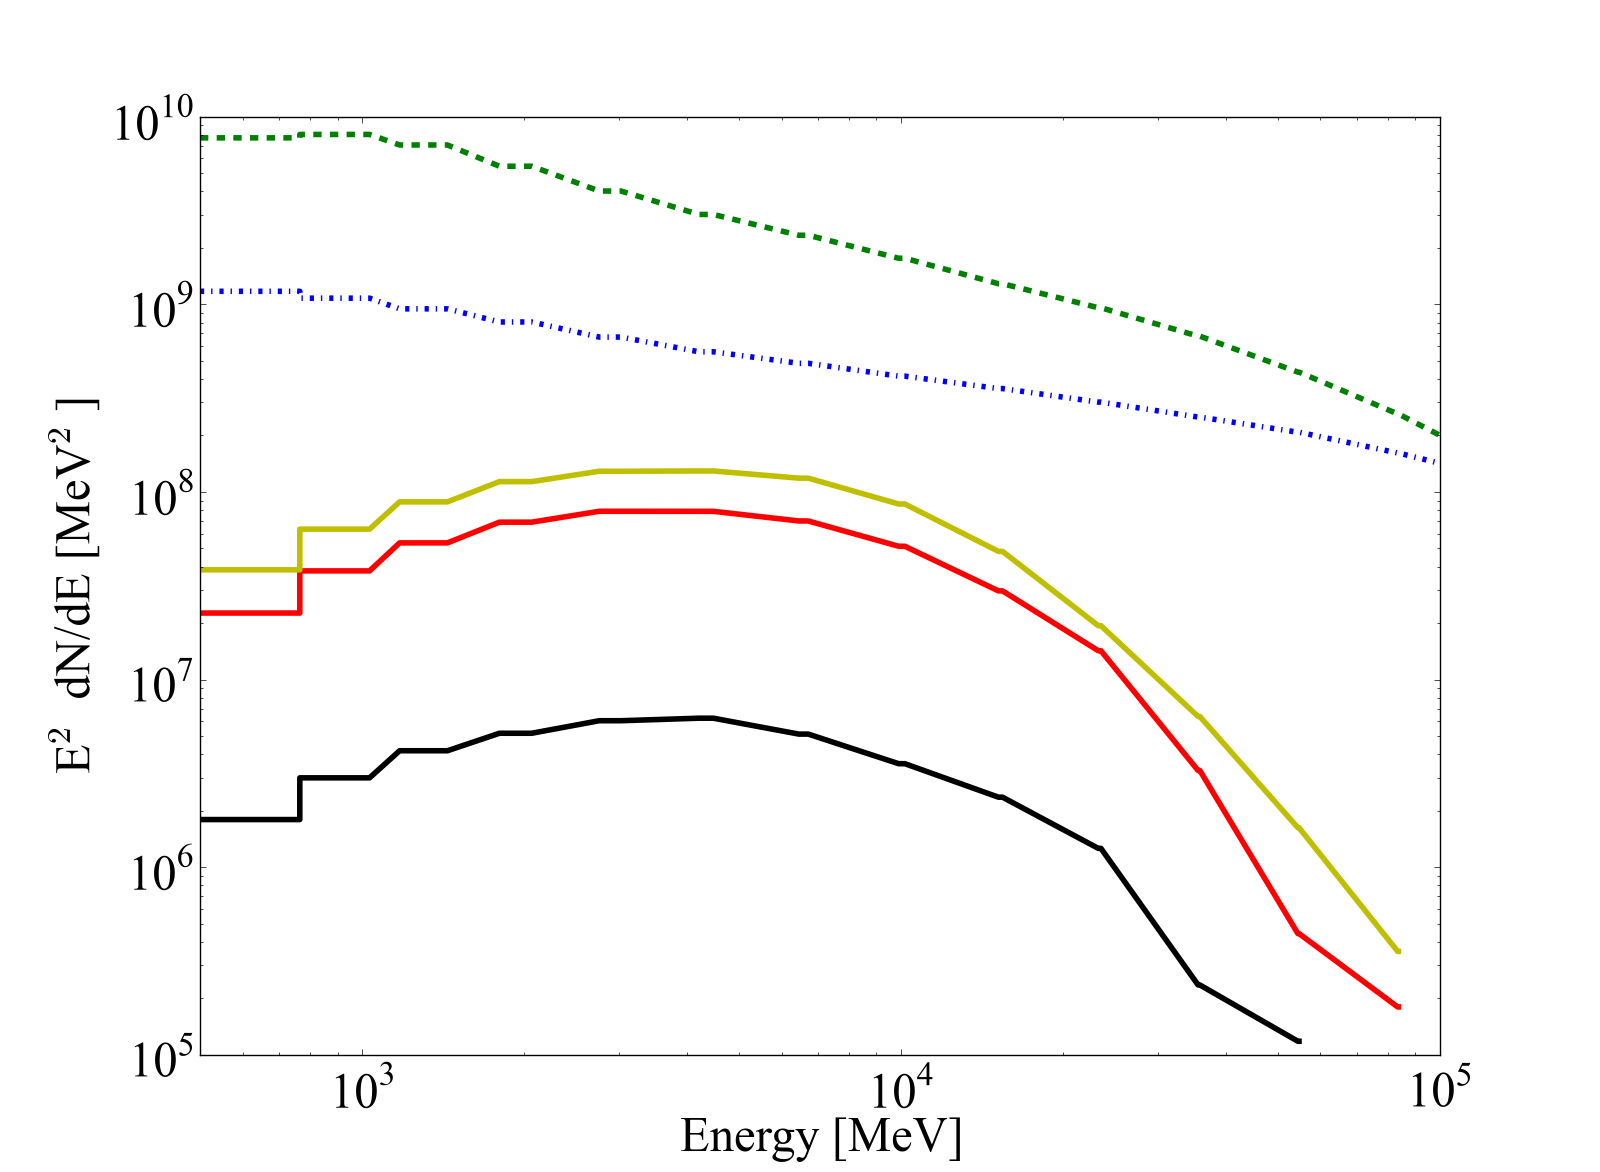
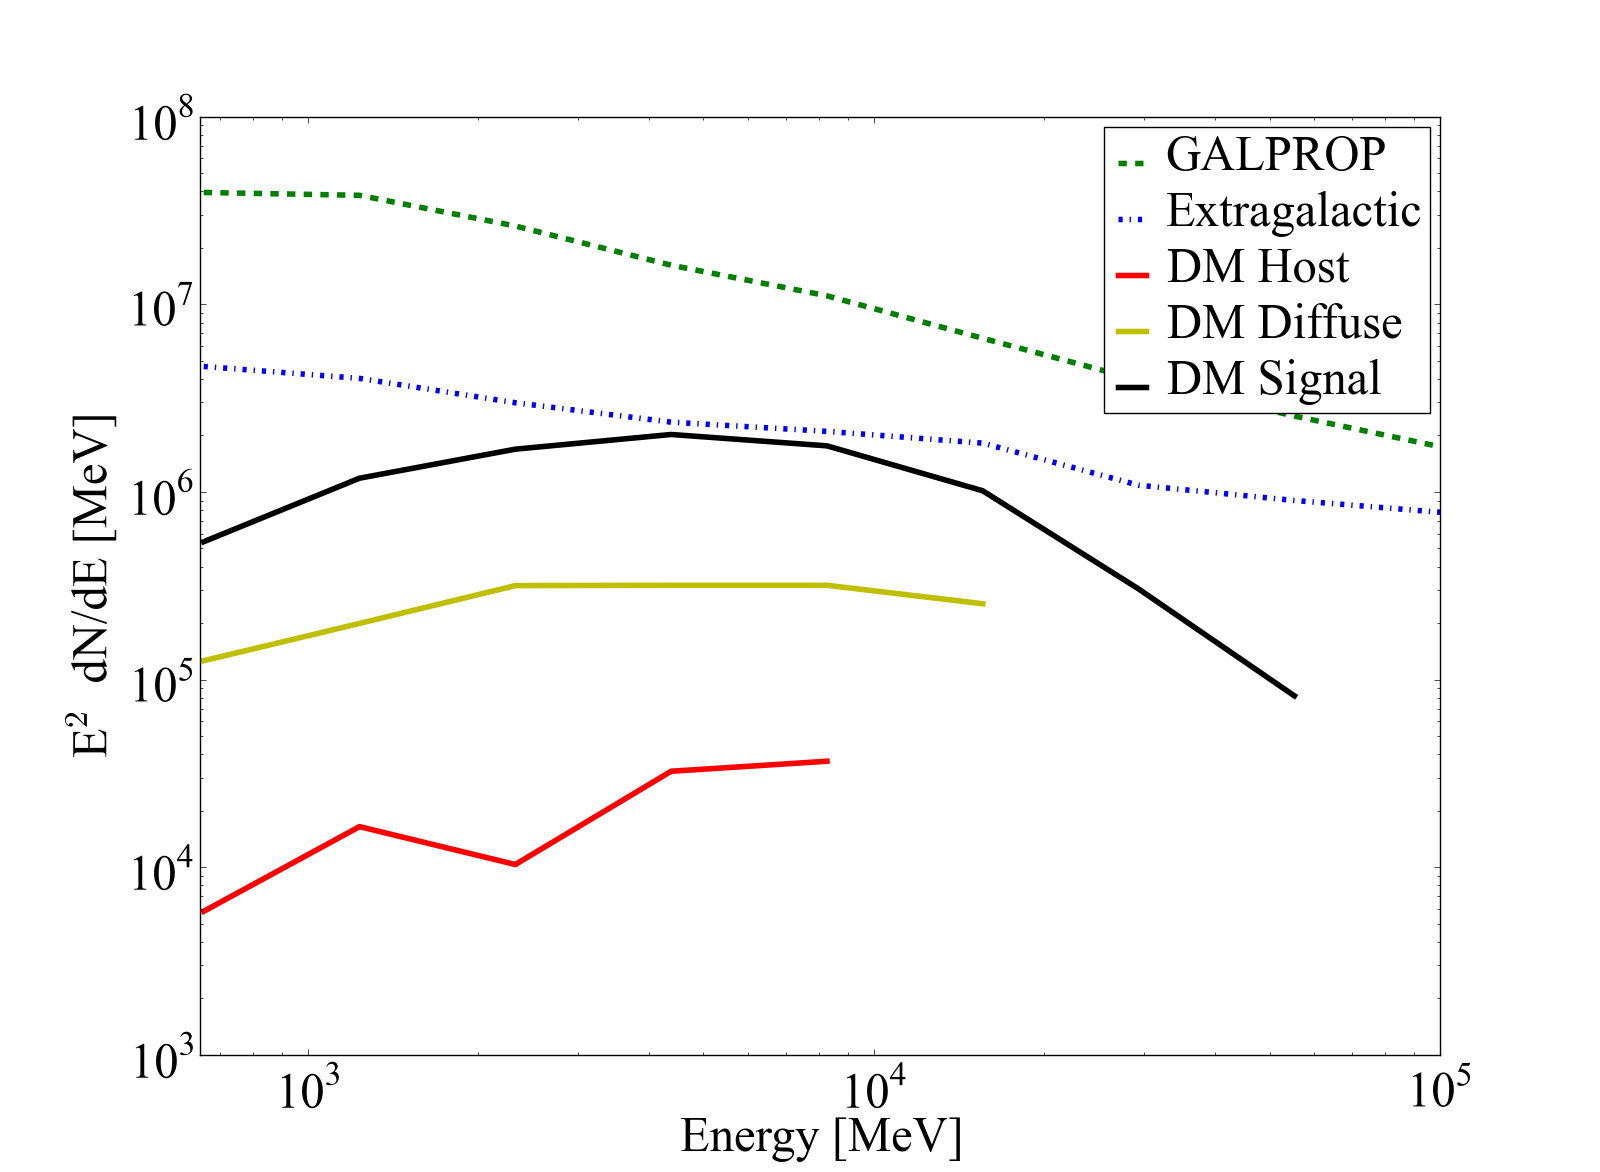
We consider WIMPs that are capable of pair annihilation, for example a hypothetical stable supersymmetric partner of the gauge and Higgs bosons, namely the neutralino. The WIMP remains a promising candidate for the role of DM, in particular for indirect detection by astronomical observations (Bergström, 2000). After choosing a mass, , and a thermally-averaged, velocity-weighted annihilation cross section, , we use DarkSUSY (Gondolo et al., 2004) to simulate by Monte-Carlo the gamma ray spectrum that results from WIMP annihilation and the subsequent fragmentation. In keeping with the model used in Kuhlen et al. (2008), we compute this spectrum for WIMP masses ranging from 50 to 500 GeV, assuming a 100% branching ratio into quarks and . Fig. 3 shows how a 100 GeV spectrum compares with the backgrounds in different regions of the sky.
Since the energy spectrum of the DM signal has no correlation with the spatial distribution, we calculate the overall flux for input to gtobssim as
| (2) |
where is the density in the VL2 simulation, is the annihilation spectrum, and MeV is the minimum photon energy accepted in our analysis.
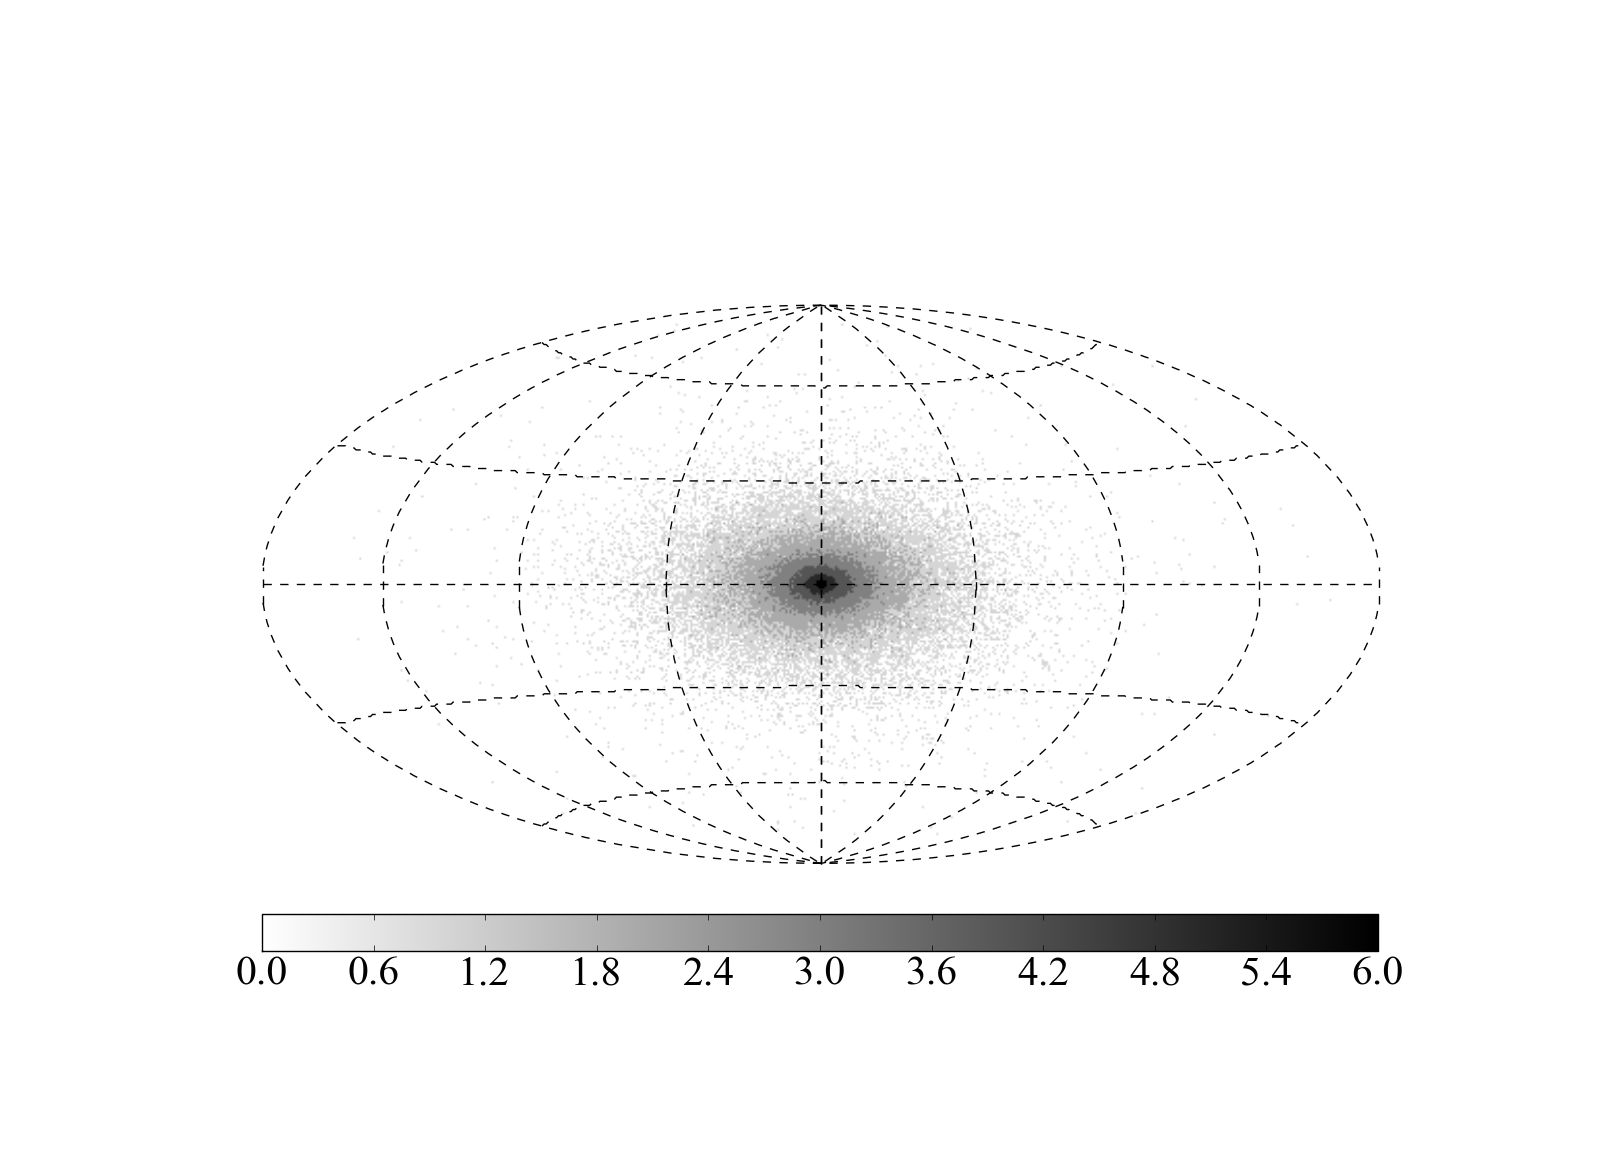
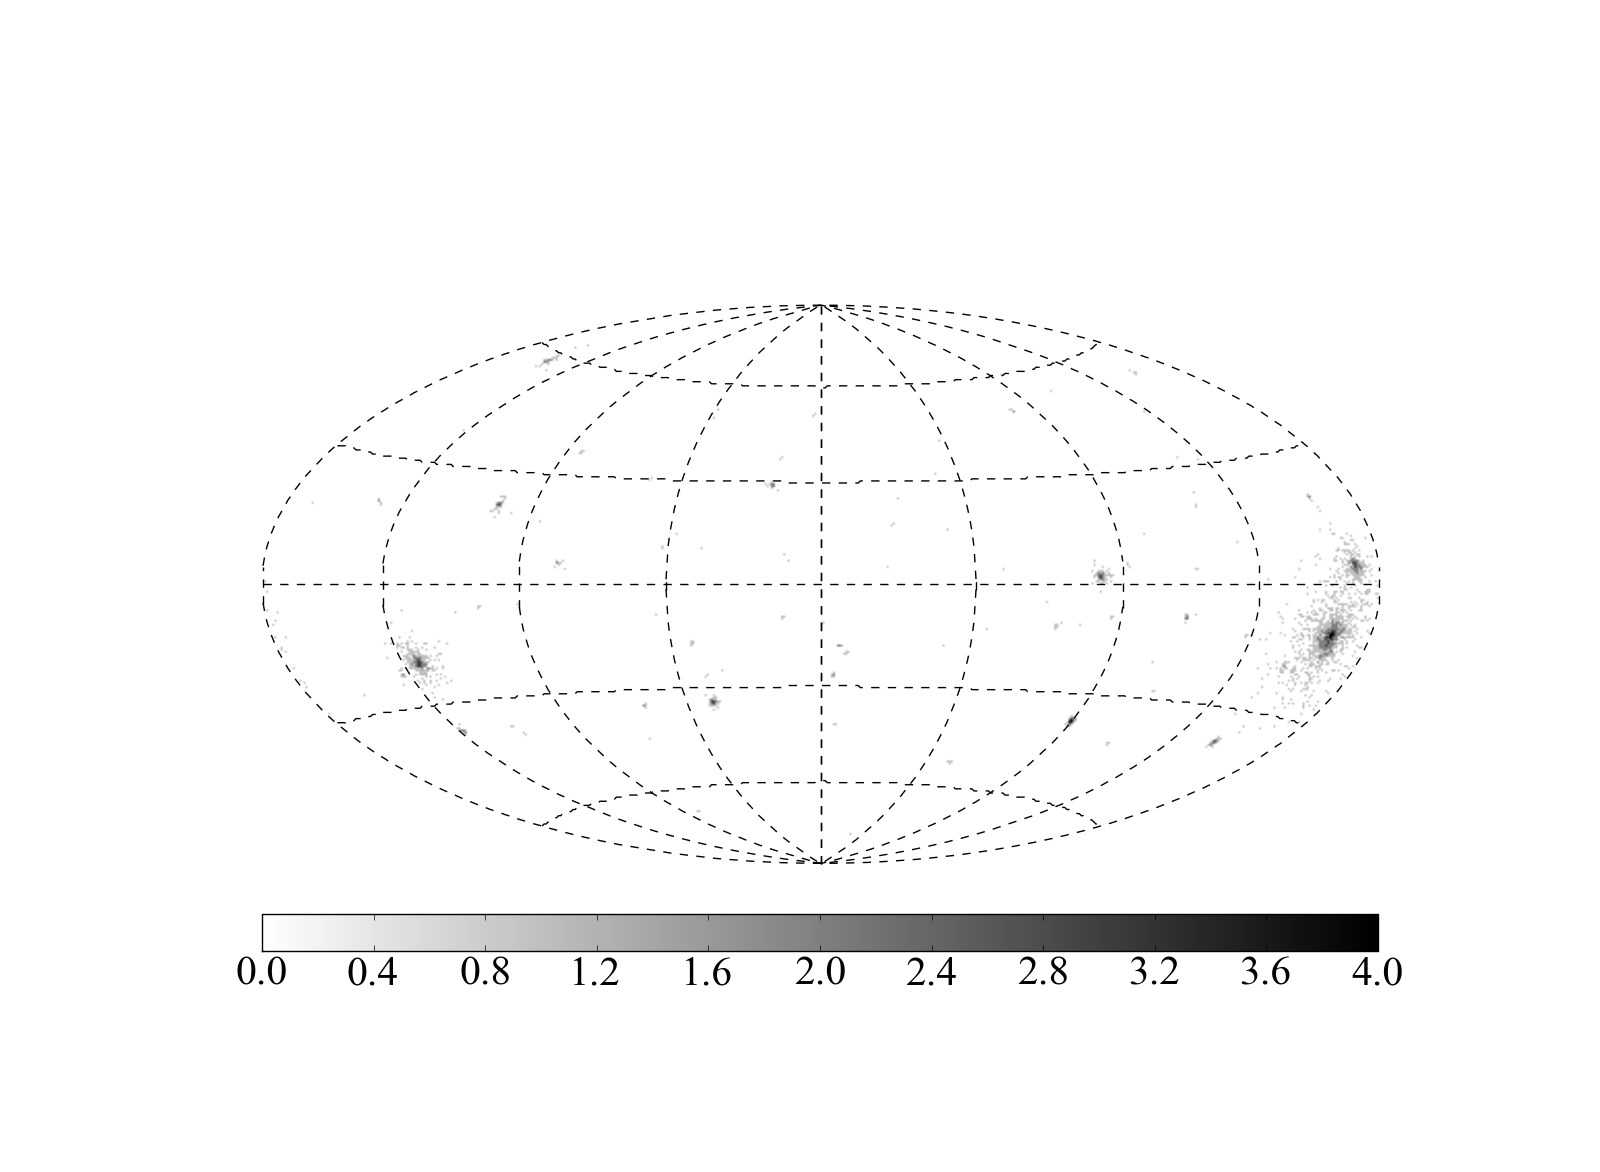
We repeated the simulations for each WIMP mass using VL2 subhalo sky maps corresponding to 10 random viewpoints at 8 kpc radius around the VL2 galaxy. A total of ten years of Fermi-LAT operation was simulated for each viewpoint. Figure 2 shows the full sky for an example simulation of the signal over a ten year observation.
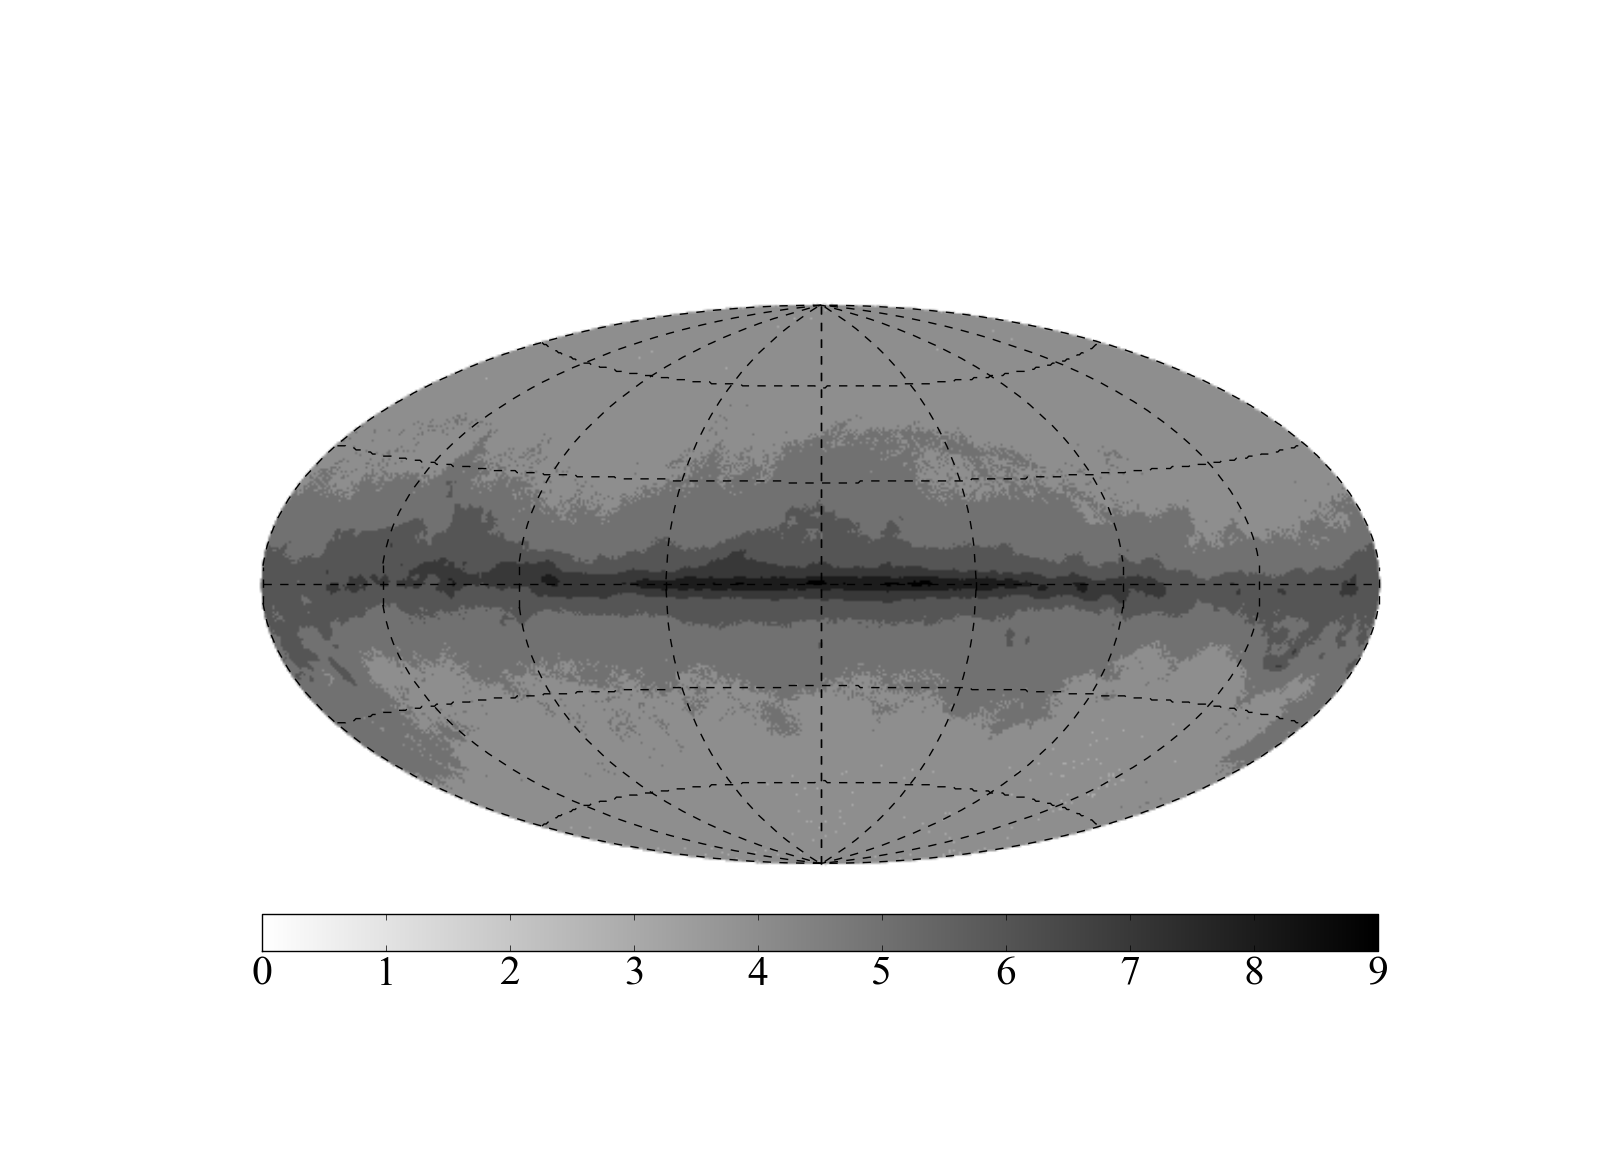
The DM subhalo signal competes with a diffuse background from four categories: extragalactic, Galactic, host-halo DM, and unresolved DM. We simulate extragalactic diffuse emission using the power law fit determined in the recent Fermi-LAT analysis (Abdo et al., 2010). For Galactic emission, we use the GALPROP (Strong et al., 2000) (v50.1p) cosmic-ray propagation code to produce a map of diffuse gamma-rays originating from cosmic ray interactions with the Galactic interstellar medium and radiation field. The “optimized”GALPROP model (Strong et al., 2004) used in Kuhlen et al. (2008) relaxes constraints imposed by measurements of the local cosmic-ray flux, especially for cosmic-ray electrons, in order to account for the “GeV excess” seen by EGRET (Hunter et al., 1997). Since initial Fermi-LAT observations show no such excess (Abdo et al., 2009), we return to the “conventional” model, which keeps the constraints imposed by local cosmic-ray fluxes. We did not include the LAT residual cosmic-ray background in the model. It is roughly one third the extragalactic diffuse contribution and if included would decrease our sensitivity to DM subhalo objects by an estimated 20%.
Galactic sources were not included in the background model. Since their gamma-ray signals are likely to overlap with subhalos, especially at low energy, they will reduce the sensitivity with respect to what is presented here. Furthermore, two or more point sources that are nearly coincident on the sky can mimic an extended object in the gamma-ray signal, producing a background to be dealt with when analyzing Fermi-LAT data. In general, when a subhalo candidate is detected it will be necessary to try to reject point source hypotheses through spectral analysis, analysis of the angular shape or source extension (see § 2.2), searches for temporal variations, and multi-wavelength studies (Baltz et al., 2007).
In addition to the Galactic and extragalactic diffuse, the background includes photons from annihilation of DM residing in the smooth host halo. For the case where we boost the substructure, this smooth component also includes the extrapolated contribution due to unresolved subhalos. The total mass of the extrapolated substructure has the same normalization as the boost described in § 2, but an anti-biased distribution due to tidal stripping and destruction of subhalos at inner radii. (Kuhlen et al., 2008)
We generated ten-year Fermi-LAT Monte Carlo simulations of all four diffuse background sources using gtobssim, by the same procedure as used for the signal subhalos. All Monte-Carlo simulation counts were binned, by the Fermi-LAT Science Tool gtbin, into four logarithmically spaced energy bands from 500 MeV to 300 GeV for use in § 2.2.
In order to assign a detection significance to the region occupied by a particular subhalo, we first find the total simulated background counts in the region and then calculate the Poisson probability
| (3) |
for the background to fluctuate to a level equal to or greater than the observed counts . From we derive a significance expressed in terms of standard deviations for a normal distribution:
| (4) |
For each subhalo we take all photons above 500 MeV in a region of interest (ROI) set at one degree, which corresponds roughly to the 68% containment angle in the LAT at 500 MeV. (Atwood et al., 2009) Fine-tuning this radius does not dramatically change the results given here. Finally, for a given map we quote (), the number of subhalos above five (three) standard deviations significance.
2.2 Resolution of Angular Structure
One of the crosschecks needed to bolster the case for a DM subhalo candidate is to look for extended emission that is inconsistent with a point source. Since the LAT PSF has a strong energy dependence, we employ a likelihood-ratio analysis to compare for each significant subhalo the point-source hypothesis to a subhalo hypothesis. Instead of using a spatially unbinned event list, as in the previous section, we bin the sky into a grid of 2400 1200 pixels, equally spaced in Galactic longitude and latitude. For candidates near the galactic poles the counts are binned with a coordinate-system rotated 90 degrees in l and b to avoid distortion. Then for each VL2 subhalo, we convolve the VL2 “true” sky map with a parametrization of the LAT PSF and calculate the Poisson likelihood for the binned Monte-Carlo results. We repeat the calculation using a map of a point-source convolved with the PSF and calculate a second likelihood to arrive at a test statistic that compares the subhalo and point-source hypotheses:
| (5) |
The PSF model used for the convolution is a simplification of what is in the gtobssim Monte Carlo. We assume that there is no azimuthal dependence around the source direction, while the radial distribution is given by the functional form used in the Science Tools to model the non-Gaussian tails of the LAT PSF:
| (6) |
where . The 68% containment radius of this distribution is about . We match that radius in each energy bin to the documented LAT 68% containment angles (Atwood et al., 2009), taking into account the different PSF for conversions in thick tungsten versus thin and the relative LAT effective areas for the two conversion types. The convolved subhalos should fit well to their simulated counterparts, which we verified to be the case for the subhalos of interest.
The TS is only an indicator of how well the data could in principle statistically distinguish an extended subhalo from a point source. To rule out a point-source hypothesis at some confidence level would require something different, such as a goodness-of-fit test for that hypothesis. Success would rely on a thorough Monte-Carlo modeling of the PSF, including a full detector simulation (gtobssim uses only a parametrization of the response), plus understanding of any associated systematic problems. Furthermore, this method of calculating the is not applicable to analysis of data, for which the true subhalo shape is unknown. Data analysis will require fitting to a subhalo model with a-priori unknown parameters and will also require dealing with backgrounds such as partially overlapping point sources, which are not considered here.
3 Results
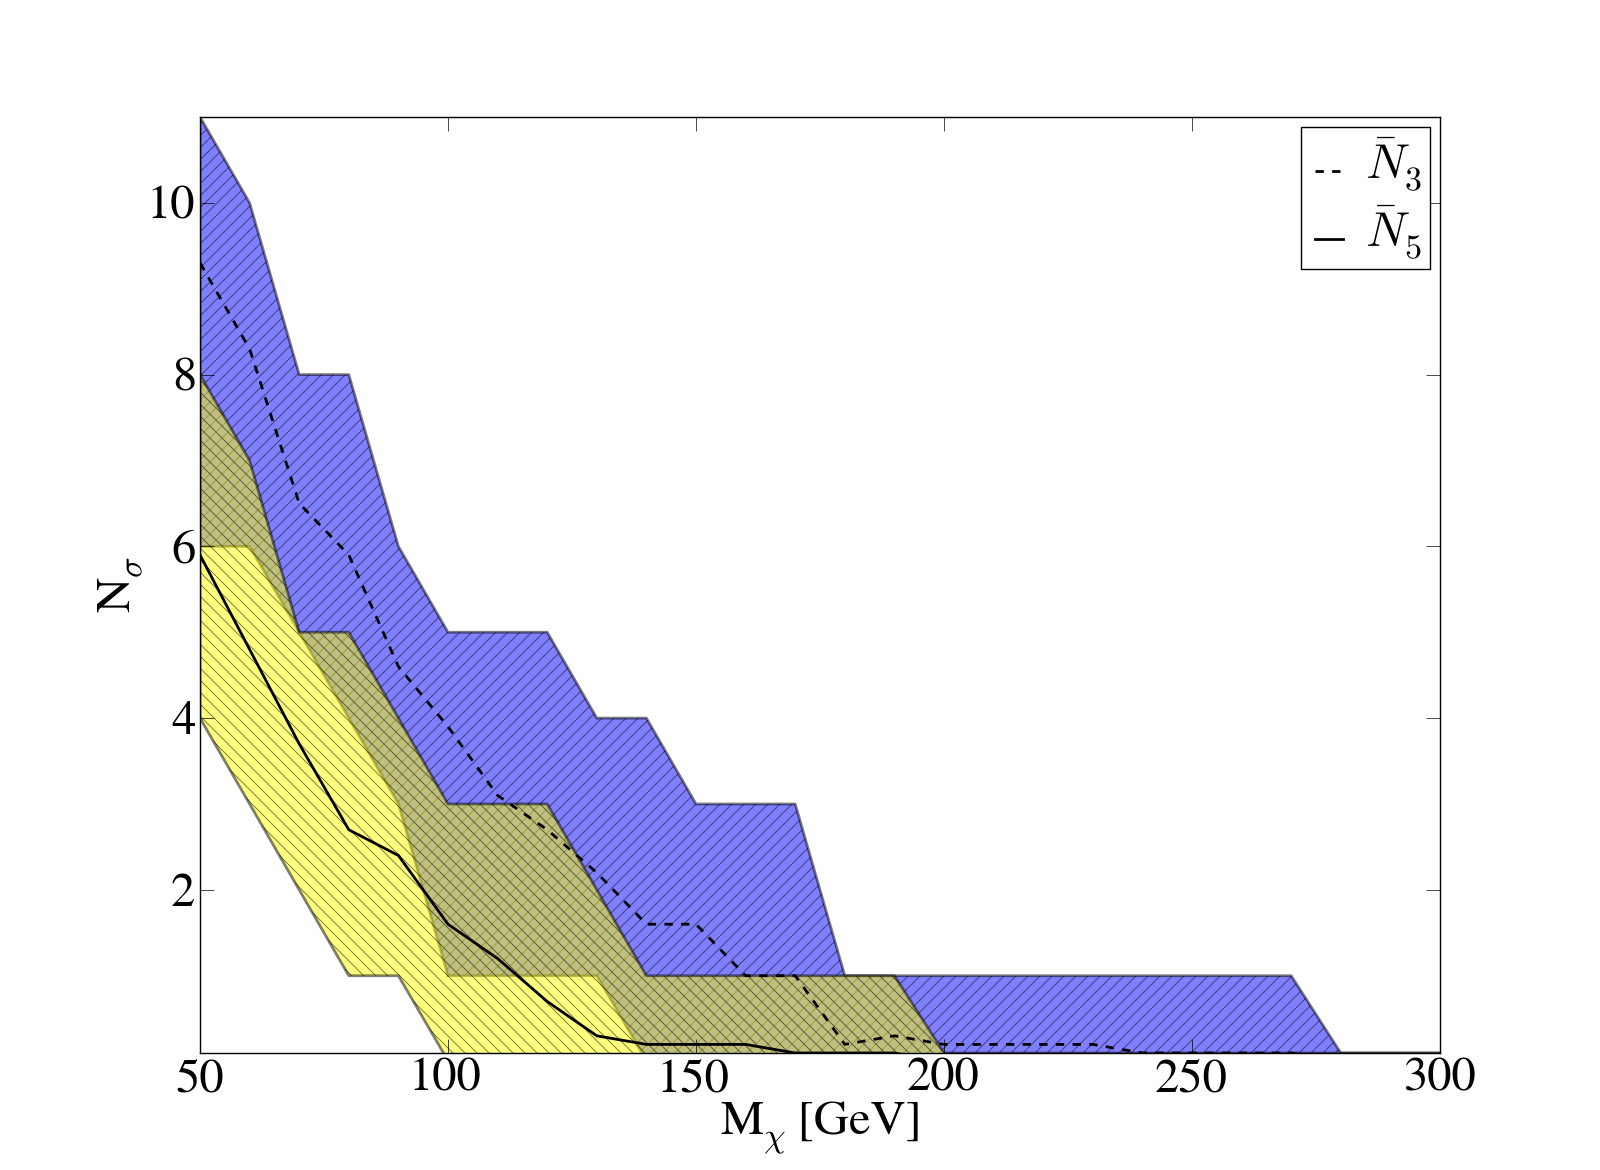
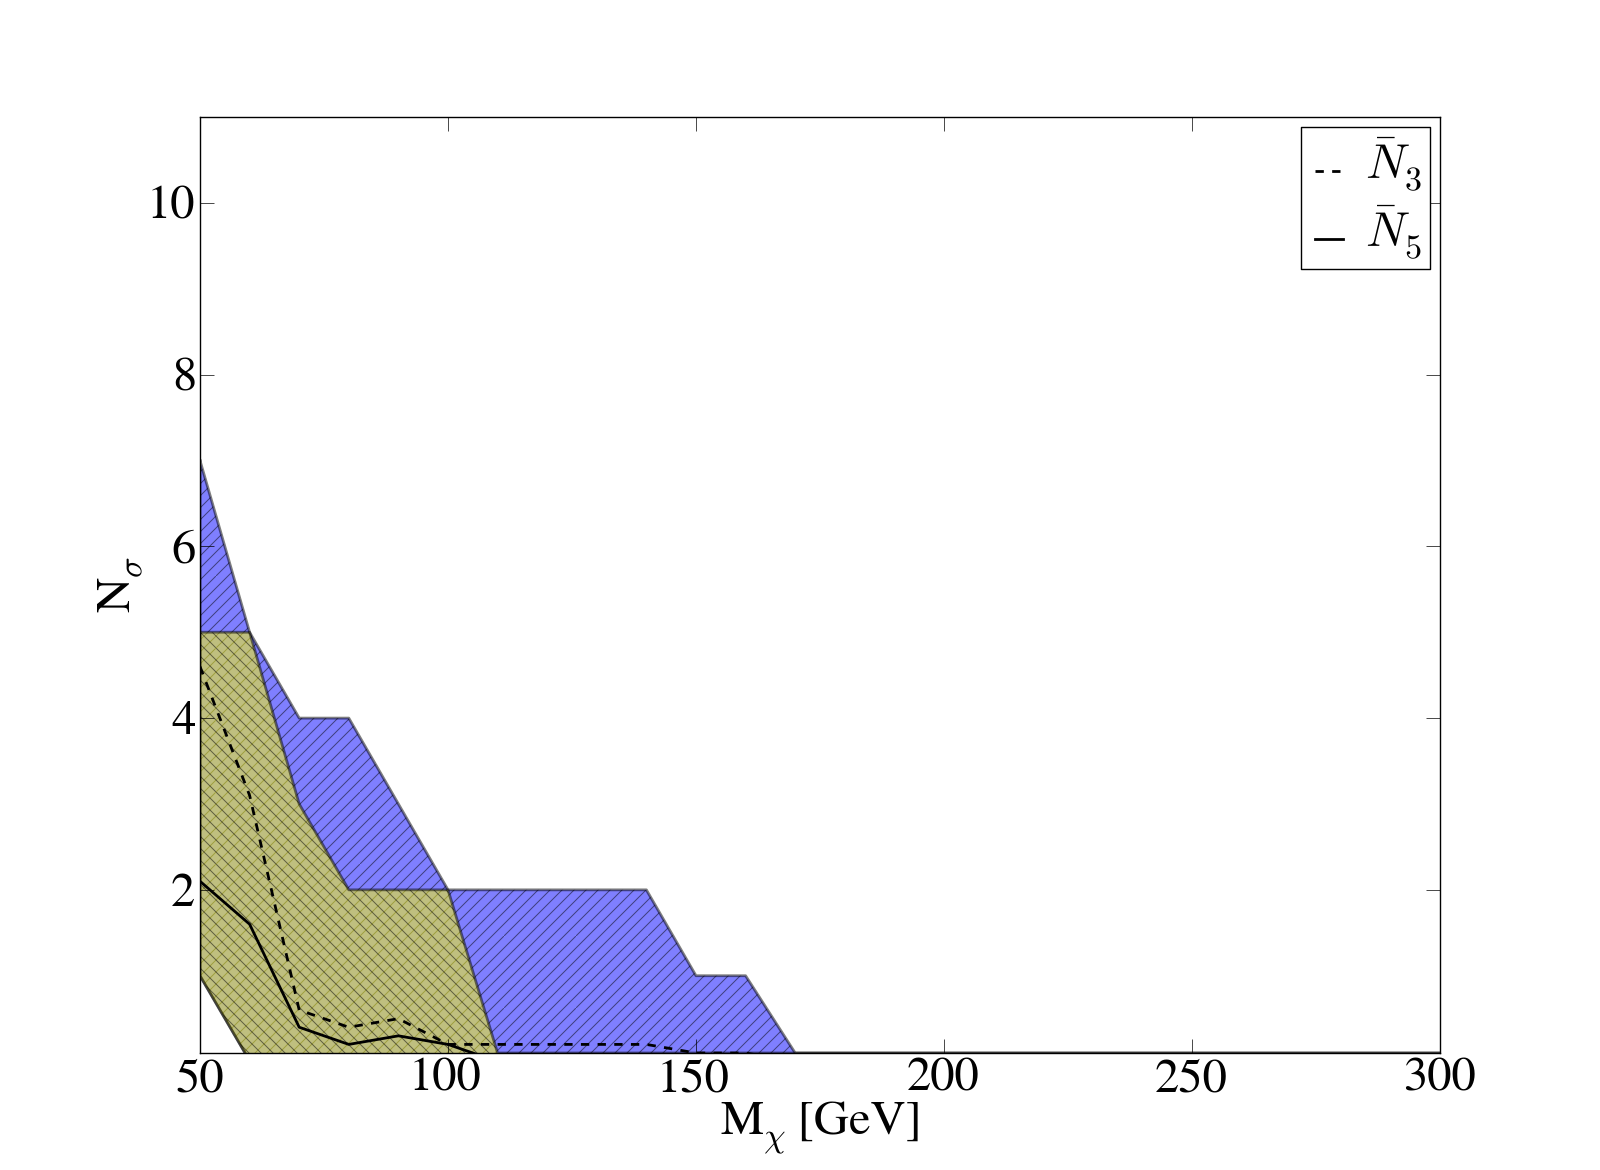
Figure 4 shows our results for the number of detectable subhalos with significance greater than five (and three) versus WIMP mass. The two plots represent the different assumptions on the boost of the subhalo luminosity, as discussed in § 2. For each the shaded region indicates the range of variation among the ten different observer positions around the Galaxy with a dark line indicating the average.
We find that ranges from eight to zero over the range of and subhalo boosts. In all cases, there are no detections above with a WIMP mass greater than 200 GeV. For comparison, the fiducial model considered in Kuhlen et al. (2008), where
predicted an ranging from 13 to 19. Scaling this down to account for ten years of orbit, including trigger and SAA dead time, leaves approximately 11 to 16 . For that same DM setup, but with the new, more detailed LAT-specific analysis and the improved substructure boost implementation, we find here results for ranging from zero to three with an average over all positions of 1.6. This difference comes largely from a lower effective area and angular resolution than that assumed in Kuhlen et al. (2008). Other factors include the useage of Poisson statistics rather than a simplified , and a factor of two (upward) error in the Kuhlen et al. (2008) flux calculation.
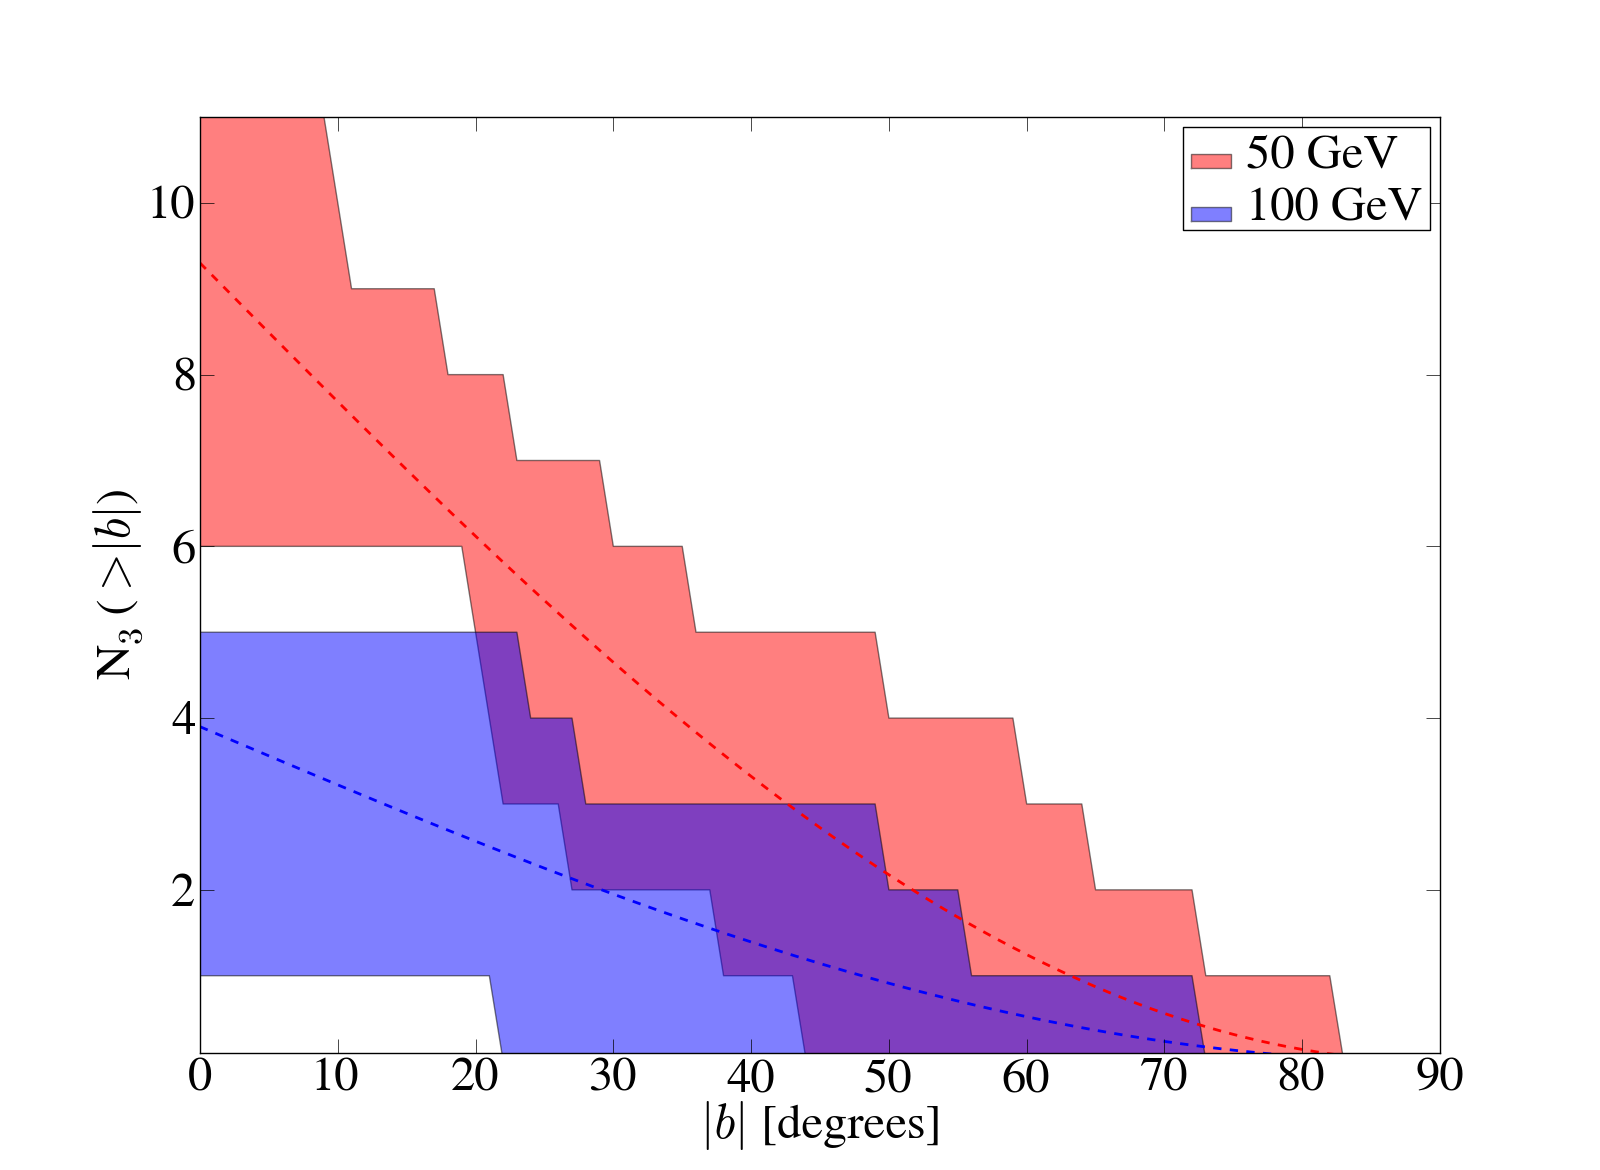
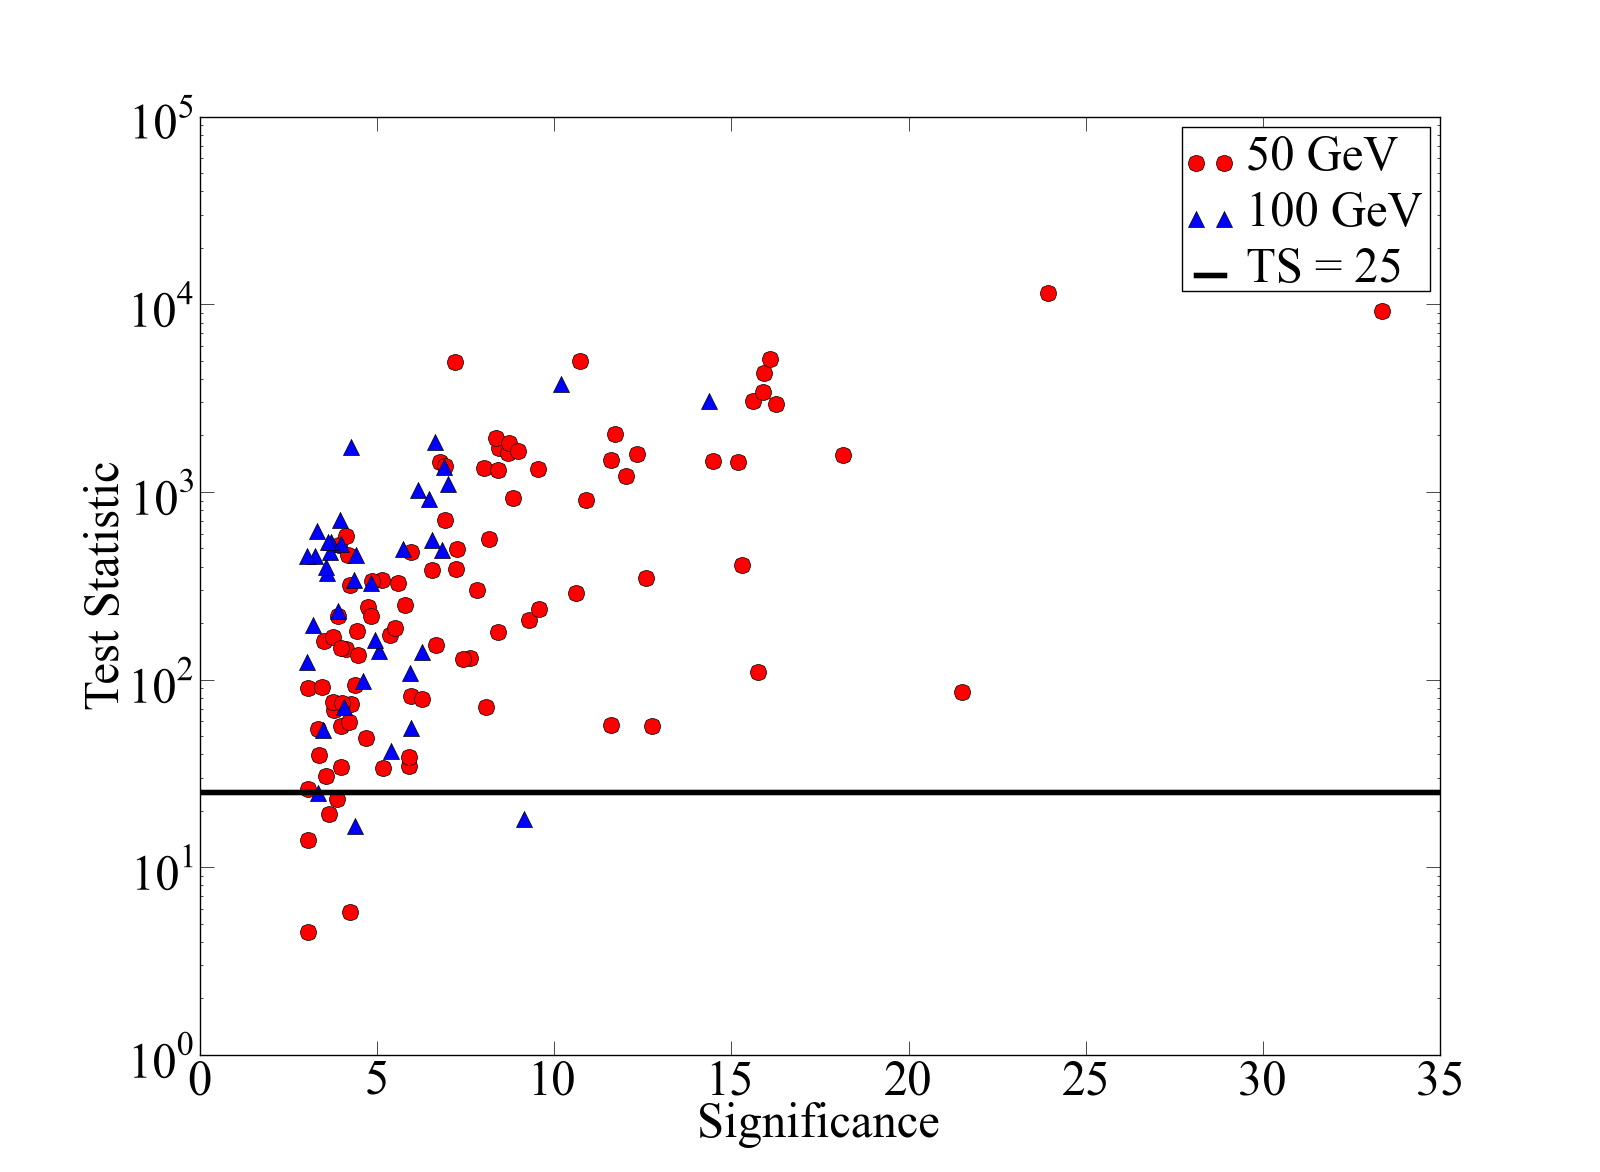
These detections are distributed roughly isotropically over the sky, as can be seen in Fig. 5. Requiring that a subhalo have resolvable angular extent (i.e. that TS ()), removes five of the 93 subhalos from the set of all 50 GeV Galactic positions, and three of 39 in the 100 GeV set. Overall, 95% of detections have . This drops to 68% for the case with no sub-substructure boost. A plot of the relation between TS and significance is given in Fig. 6.
While we plot here only as a function of , the signal strength is also dependent on the annihilation cross section, , a quantity that has a plausible range spanning orders of magnitude. To a lesser extent, uncertainty in the the boost parameters and and the nature of the central extrapolation of the density profile, i.e. whether an NFW or Einasto profile is assumed, can all make roughly factors differences in the (Kuhlen et al., 2008).
4 Discussion
We have estimated the sensitivity of the Fermi-LAT to WIMP annhilation gamma-rays from Galactic DM substructure predicted by the VL2 simulation. Using a thorough instrument simulation, we add to predictions such as Kuhlen et al. 2008 a more accurate treatment of the LAT’s capabilities. Many of the details of the instrument’s behavior, e.g. reduced live-time due to the SAA, a different PSF in the thick and thin foil converters, etc. lead to a less optimistic predicted sensitivity. Combined with a less concentrated sub-substructure boost, these factors leave room for very few expected detectable subhalos over the LAT’s lifetime, given a conventional DM candidate.
Beyond the pure signal-to-noise ratio, resolution of the angular extension of a subhalo would go a long way to make it a convincing direct DM detection candidate. By computing a test-statistic for each possible predicted detection, we estimate the fraction which could be confidently deemed extended. Roughly 83% of our significant detections should have resolution of angular extent. This is a somewhat optimistic prediction as we use the true subhalo density profile in our likelihood ratio, instead of a generic (NFW, Einasto, etc..) profile as would probably be used in a real blind substructure search. Even so, based on this study of subhalos resolved in the VL2 simulation, it seems likely that a candidate bright enough to be significant will also appear extended.
If the Fermi-LAT does not resolve any significant DM substructure, flux limits will be of value. In this case it is important to understand the astrophysical uncertainties in predictions like the one given here. The strongest of these come from the extrapolations needed to compensate for finite numerical resolution in N-body simulations such as VL2, and the stochastic nature of our position in the Galaxy relative to individual subhalos. Simulating signals from multiple random positions at our Galactic radius gives an estimate of the latter uncertainty. We account for unresolved sub-subhalos within subhalos resolved in VL2 by the boost correction Eqn. (1). Comparison with un-boosted results illustrate that this effect is of some importance, while its exact amplitude remains uncertain. As in Kuhlen et al (2008 and 2009) we have neglected any possibly significant signals from subhalos that are too small to be resolved in the VL2 simulation and we refer to these works for detailed discussions of their potential detectability: Pieri et al. (2008); Siegal-Gaskins (2008); Ando (2009).
Note also that in models in which the pair annihilation of non-relativistic DM particles is enhanced by the Sommerfeld effect (e.g. Arkani-Hamed et al., 2009), the subhalo signal can be strongly enhanced owing to the lower velocity dispersion of the DM in subhalos (Robertson & Zentner, 2009; Lattanzi & Silk, 2009). Even the first year of Fermi-LAT data will strongly constrain many such scenarios (Kuhlen et al., 2009; Bovy, J., 2009; Kistler & Siegal-Gaskins, 2009).
We look forward to the Fermi team’s upcoming analyses of the first year’s LAT data, searching for a DM annihilation signal from dark subhalos. An analysis of the DM signal from known dwarf galaxies is already published (Abdo et al., 2010).
References
- Abdo et al. (2009) Abdo, A.A. et al., Phys Rev. Lett. 103, 251101, 2009.
- Abdo et al. (2010) Abdo, A.A. et al., Phys. Rev. Lett. 104, 101101, 2010.
- Abdo et al. (2010) Abdo, et al., ApJ 712:147-158, 2010.
- Ando (2009) Ando, S. 2009, Phys. Rev. D, 80, 023520
- Atwood et al. (2009) Atwood, W. et al., 2009 ApJ, 697, 1071.
- Aharonian et al. (2006) Aharonian, F., et al. 2006, Nature, 439, 695.
- Arkani-Hamed et al. (2009) Arkani-Hamed, N., Finkbeiner, D.P., Slatyer, T.R., Weiner, N. 2009, Phys. Rev. D, 79, 015014
- Baltz et al. (2007) Baltz, E. A., Taylor, J. E., & Wai, L. L. 2007, ApJ, 659, L1254.
- Baltz et al. (2008) Baltz, E. A., et al. 2008, JCAP, 7, 13.
- Berezinsky et al. (1994) Berezinsky, V., Bottino, A., & Mignola, G. 1994, Physics Letters B, 325, 136.
- Bergström et al. (1998) Bergström, L., Ullio, P., & Buckley, J. H. 1998, Astroparticle Physics, 9, 137.
- Bergström (2000) Bergström, L. 2000, Rep. Prog. Phys. 63, 793.
- Bovy, J. (2009) Bovy, J. 2009, Phys. Rev. D 79, 083539
- Cesarini et al. (2004) Cesarini, A., Fucito, F., Lionetto, A., Morselli, A., & Ullio, P. 2004, Astroparticle Physics, 21, 267.
- Diemand et al. (2007) Diemand, J., Kuhlen, M., Madau, P. 2007, ApJ667, 859.
- Diemand et al. (2008) Diemand, J., Kuhlen, M., Madau, P., Zemp, M., Moore, B., Potter, D., Stadel, J. 2008, Nature, 454, 735.
- Giommi et al. (2006) Giommi, P., Colafrancesco, S., Cavazzuti, E., Perri, M., & Pittori, C. 2006, A&A, 445, 843.
- Diemand & Moore (2010) Diemand, J. and Moore, B. 2010, Advanced Science Letters, in press, arXiv:0906.4340
- Gondolo et al. (2004) P. Gondolo, J. Edsj , P. Ullio, L. Bergst m, M. Schelke and E.A. Baltz, 2004, JCAP, 0407, 008.
- Hunter et al. (1997) Hunter, S. D. et al. 1997, ApJ, 481, 205.
- Jeltema & Profumo (2008) Jeltema, T. E., & Profumo, S. 2008, JCAP, 11, 3.
- Kistler & Siegal-Gaskins (2009) M. D. Kistler and J. M. Siegal-Gaskins, arXiv:0909.0519 [astro-ph.HE]
- Kuhlen et al. (2008) Kuhlen, M., Diemand, J., & Madau, P. 2008, ApJ, 686, 262.
- Kuhlen (2009) Kuhlen, M., 2010, Advances in Astronomy, Article ID 162083
- Kuhlen et al. (2009) Kuhlen, M., Madau, P., and Silk, J., 2009, Science, 325, 970.
- Kuulkers et al. (2007) Kuulkers, E., et al. 2007, A&A, 466, 595.
- Lattanzi & Silk (2009) Lattanzi, M. and Silk, J. 2009, Phys. Rev. D, 79, 083523
- Li and Ma (1983) Li, T. and Ma, Y. 1983, ApJ, 272, 317.
- Navarro, Frenk, & White (1996) J. F. Navarro, C. S. Frenk and S. D. White 1996, ApJ462, 563.
- Pieri et al. (2008) Pieri, L., Bertone, G., & Branchini, E. 2008, MNRAS, 384, 1627
- Robertson & Zentner (2009) Robertson, B.E. and Zentner, A.R. 2009, Phys. Rev. D, 79, 083525
- Siegal-Gaskins (2008) Siegal-Gaskins, J. M. 2008, Journal of Cosmology and Astro-Particle Physics, 10, 40
- Springel et al. (2008) Springel, V., et al. 2008, Nature, 456, 73.
- Stecker & Salamon (1996) Stecker, F. W., & Salamon, M. H. 1996, ApJ, 464, 600.
- Stoehr et al. (2003) Stoehr, F., White, S. D. M., Springel, V., Tormen, G., & Yoshida, N. 2003, MNRAS, 345, 1313.
- Strigari et al. (2008) Strigari, L. E., Koushiappas, S. M., Bullock, J. S., Kaplinghat, M., Simon, J. D., Geha, M., & Willman, B. 2008, ApJ, 678, 614.
- Strong et al. (2000) Strong, A. W., Moskalenko, I. V., & Reimer, O. 2004, ApJ, 537, 763.
- Strong et al. (2004) Strong, A. W., Moskalenko, I. V., & Reimer, O. 2004, ApJ, 613, 962.
- Zwicky (1933) Zwicky, F. 1933, Helvetica Physica Acta, 6, 110.
