-decay properties of Zr and Mo neutron-rich isotopes
Abstract
Gamow-Teller strength distributions, -decay half-lives, and -delayed neutron emission are investigated in neutron-rich Zr and Mo isotopes within a deformed quasiparticle random-phase approximation. The approach is based on a self-consistent Skyrme Hartree-Fock mean field with pairing correlations and residual separable particle-hole and particle-particle forces. Comparison with recent measurements of half-lives stresses the important role that nuclear deformation plays in the description of -decay properties in this mass region.
pacs:
21.60.Jz, 23.40.Hc, 27.60.+j, 26.30.-kI Introduction
The rapid neutron-capture process (r process) is considered as the main nucleosynthesis mechanism responsible for the production of heavy neutron-rich nuclei and for the existence of about half of the nuclei heavier than iron bbhf ; cowan91 . Although the astrophysical sites for this process are still controversial, it takes place in scenarios characterized by very high neutron densities. The path that nucleosynthesis follows involves neutron-rich isotopes, which can be far away from the valley of -stability. The most relevant nuclear properties to describe the r process are the nuclear masses and the -decay properties cowan91 ; kra93 —namely, the -decay half-lives () and the -delayed neutron-emission probabilities (). Nuclear masses define the possible r-process paths near the neutron drip-lines. The values of r-process waiting-point nuclei determine the pre freeze-out isotopic abundances and the speed of the process towards heavier elements, as well as the r-process time scale. The values of r-process isobaric nuclei define the decay path towards stability following the freeze-out, and provide a source of late-time neutrons.
A reliable nuclear physics description of the properties of the extremely neutron-rich nuclei along the r-process path is needed to interpret the astrophysical observations and to model and simulate properly the r process. The quality of the nucleosynthesis modeling is directly affected by the quality of the nuclear structure input. Unfortunately, most of the nuclear properties of relevance for the r process are experimentally unknown, although much effort is being done recently, and therefore theoretical predictions must be considered. Such calculations are particularly challenging in the very exotic regions of interest, since they involve extrapolations using well established nuclear-structure models that have been properly tuned to account mostly for the properties of nuclei in the valley of stability. In particular, the shell structure of neutron-rich drip-line nuclei is still unknown to a large extent. Significant isospin dependence of shell effects in medium-mass and heavy nuclei has been predicted doba94 ; doba96 ; ots06 . It has been found that the shell gaps dramatically decrease near the neutron drip-lines because of continuum effects and a quenching of shell effects is apparent.
As a matter of fact, nuclear structure properties of nuclei far from stability where no experiments exist for direct comparison, can be tested by exploring their influence on the solar r-process abundance patterns. As an example, the agreement with the observed r-process abundances in the mass region is manifestly improved chen95 ; pfeiffer97 ; pfeiffer01 ; sun08 when using nuclear structure models that include a shell quenching effect at doba96 ; ETFSIQ .
In this work we focus our attention on the mass region of neutron-rich nuclei, which is of great interest for the astrophysical r process. In addition, neutron-rich isotopes in this mass region are known wood92 to be interesting examples where the equilibrium shape of the nucleus is rapidly changing and shape coexistence is present with competing prolate, oblate, and spherical shapes at close energies (see e.g. cas85 for a general review).
In a recent publication pereira , the -decay properties of some neutron-rich Zr and Mo isotopes were measured for the first time. The data were interpreted in terms of the quasiparticle random-phase approximation (QRPA) moller1 ; moller2 ; moller3 ; moller03 , using nuclear shapes and nuclear masses derived from the finite-range droplet model (FRDM) FRDM and the latest version of the finite-range liquid-drop model (FRLDM) moller08 , which also includes triaxial deformation. QRPA calculations for neutron-rich nuclei have also been performed within different approaches, such as the Hartree-Fock-Bogoliubov (HFB) engel , continuum QRPA with either the extended Thomas-Fermi plus Strutinsky integral (ETFSI) method borzov1 or based on density functionals borzov2 ; borzov3 , and the relativistic mean field (RMF) approach niksic2005 , just to mention some of the recent publications, all of them for spherical nuclei. However, the mass region of concern here requires nuclear deformation as a relevant degree of freedom to characterize the nuclear structure involved in the calculation of the -strength functions. The deformed QRPA formalism has been developed in Refs. moller1 ; moller2 ; moller3 ; homma ; hir1 ; hir2 , where phenomenological mean fields based on Nilsson or Woods-Saxon potentials were used as a starting basis. In this work we investigate the decay properties of neutron-rich even-even Zr and Mo isotopes within a deformed self-consistent Hartree-Fock (HF) mean field formalism with Skyrme interactions and pairing correlations in BCS approximation. Residual spin-isospin interactions are also included in the particle-hole and particle-particle channels and are treated in QRPA sarri1 ; sarri2 .
The paper is organized as follows. In Sec. II a brief review of the theoretical formalism is presented. Sec. III contains the results obtained within this approach for the potential energy curves, Gamow-Teller (GT) strength distributions, and -decay half-lives. Sec. IV summarizes the main conclusions.
II Theoretical Formalism
In this section we show briefly the theoretical framework used in this paper to describe the -decay properties in Zr and Mo neutron-rich isotopes. More details of the formalism can be found in Refs. sarri1 ; sarri2 . The method consists of a self-consistent formalism based on a deformed Hartree-Fock mean field obtained with Skyrme interactions, including pairing correlations. The single-particle energies, wave functions, and occupation probabilities are generated from this mean field. In this work we have chosen the Skyrme force SLy4 sly4 as a representative of the Skyrme forces. This particular force includes some selected properties of unstable nuclei in the adjusting procedure of the parameters. It is one of the more successful Skyrme forces and has been extensively studied in the last years.
The solution of the HF equation is found by using the formalism developed in Ref. vautherin , assuming time reversal and axial symmetry. The single-particle wave functions are expanded in terms of the eigenstates of an axially symmetric harmonic oscillator in cylindrical coordinates, using twelve major shells. The method also includes pairing between like nucleons in BCS approximation with fixed gap parameters for protons and neutrons, which are determined phenomenologically from the odd-even mass differences through a symmetric five term formula involving the experimental binding energies audi when available. In those cases where experimental information for masses is still not available, we have used the same pairing gaps as the closer isotopes measured. The pairing gaps for protons () and neutrons () obtained in this way are roughly around 1 MeV. The corresponding pairing strengths and calculated from the gap equation depend sensitively on the mass region, single-particle spectrum, and active window for pairing. For typical values of the cutoffs of about 5 MeV around the Fermi level, one obtains MeV and MeV. It is worth noticing that, although the BCS formalism leads to an unphysical neutron gas surrounding the nucleus near the drip line, the approximation is still valid in the region considered here, where the pairing gaps are still much lower than the Fermi energies.
The potential energy curves (PEC) are analyzed as a function of the quadrupole deformation ,
| (1) |
written in terms of the mass quadrupole moment and the mean square radius . For that purpose, constrained HF calculations are performed with a quadratic constraint constraint . The HF energy is minimized under the constraint of keeping fixed the nuclear deformation. Calculations for GT strengths are performed subsequently for the equilibrium shapes of each nucleus, that is, for the solutions, in general deformed, for which minima are obtained in the energy curves. Since decays connecting different shapes are disfavored, similar shapes are assumed for the ground state of the parent nucleus and for all populated states in the daughter nucleus. The validity of this assumption was discussed for example in Refs. moller1 ; homma . In our particular case, for SLy4 and neutron-rich Zr and Mo isotopes, the ground-state deformation of the even-even parents (Zr,Mo) and of the corresponding -decay odd-odd daughters (Nb,Tc) are practically the same, as it can be seen in Ref. web_sly4 .
To describe GT transitions, a spin-isospin residual interaction is added to the mean field and treated in a deformed proton-neutron QRPA sarri1 ; sarri2 ; moller1 ; moller2 ; moller3 ; homma ; hir1 ; hir2 . This interaction contains two parts, particle-hole () and particle-particle (). The interaction in the channel is responsible for the position and structure of the GT resonance sarri1 ; sarri2 ; homma and it can be derived consistently from the same Skyrme interaction used to generate the mean field, through the second derivatives of the energy density functional with respect to the one-body densities. The residual interaction is finally expressed in a separable form by averaging the Landau-Migdal resulting force over the nuclear volume, as explained in Refs. sarri1 ; sarri2 . The coupling strength is given by MeV. The part is a neutron-proton pairing force in the coupling channel, which is also introduced as a separable force hir1 ; hir2 . The strength of the residual interaction in this theoretical approach is not derived self-consistently from the SLy4 force used to obtain the mean field basis, but nevertheless it has been fixed in accordance to it. This strength is usually fitted to reproduce globally the experimental half-lives. Various attempts have been done in the past to fix this strength, arriving to expressions such as in Ref. homma , which depend on the model used to describe the mean field, Nilsson model in the above reference. Our work in the past (see Refs. sarri09_1 ; sarri09_2 and references therein), based on the Skyrme force SLy4 leads us to consider the value MeV as a reasonable choice in this mass region, improving the agreement with the experimental half-lives.
The proton-neutron QRPA phonon operator for GT excitations in even-even nuclei is written as
| (2) |
where are quasiparticle creation (annihilation) operators, are the QRPA excitation energies with respect to the ground state of the parent nucleus, and the forward and backward amplitudes, respectively. For even-even nuclei the allowed GT transition amplitudes in the intrinsic frame connecting the QRPA ground state to one-phonon states , are given by
| (3) |
where
| (4) | |||||
| (5) |
with
| (6) |
s are occupation amplitudes () and spin matrix elements connecting neutron and proton states with spin operators
| (7) |
The GT strength in the laboratory system for a transition can be obtained in terms of the intrinsic amplitudes in Eq. (3) as
| (8) | |||||
in units. To obtain this expression, the initial and final states in the laboratory frame have been expressed in terms of the intrinsic states using the Bohr-Mottelson factorization bm .
The excitation energy referred to the ground state of the odd-odd daughter nucleus is obtained by subtracting the lowest two-quasiparticle energy from the calculated energy in the QRPA calculation, , where is the sum of the lowest quasiparticle energies for neutrons and protons. The GT strength B(GT) will be plotted later versus in Figs. 3, 4, 5, and 6.
The -decay half-life is obtained by summing all the allowed transition strengths to states in the daughter nucleus with excitation energies lying below the corresponding -energy, and weighted with the phase space factors ,
| (9) |
with s and , where 0.77 is a standard quenching factor that takes into account in an effective way all the correlations hama_eff which are not properly considered in the present approach. The bare results can be recovered by scaling the results in this paper for and with the square of this quenching factor. The energy is given by
written in terms of the nuclear masses or nuclear binding energies and the neutron (), proton (), and electron () masses.
The Fermi integral is computed numerically for each value of the energy including screening and finite size effects, as explained in Ref. gove ,
| (11) |
with
| (12) |
where ; ; is the fine structure constant and the nuclear radius. is the total energy of the particle, is the total energy available in units, and is the momentum in units.
This function weights differently the strength depending on the excitation energy. As a general rule increases with the energy of the -particle and therefore the strength located at low excitation energies contribute more importantly to the half-life.
The probability for -delayed neutron emission is given by
| (13) |
where the sums extend to all the excitation energies in the daughter nuclei in the indicated ranges. is the one-neutron separation energy in the daughter nucleus. In this expression it is assumed that all the decays to energies above in the daughter nuclei always lead to delayed neutron emission and then, -decay from neutron unbound levels is neglected. According to Eq. (13), is mostly sensitive to the strength located at energies around , thus providing a structure probe complementary to .
III Results
In this section we start by showing the results obtained for the potential energy curves in the isotopes under study. Then, we calculate the energy distribution of the GT strength corresponding to the local minima in the potential energy curves. After showing the predictions of various mass models to the and values for the more unstable isotopes, where no data on these quantities are available, we calculate the -decay half-lives and discuss their dependence on the deformation.
In previous works sarri1 ; sarri2 ; sarri_wp ; sarri3 ; sarri4 ; sarri5 we have studied the sensitivity of the GT strength distributions to the various ingredients contributing to the deformed QRPA-like calculations, namely to the nucleon-nucleon effective force, to pairing correlations, and to residual interactions. We found different sensitivities to them. In this work, all of these ingredients have been fixed to the most reasonable choices found previously and mentioned above, including the quenching factor. Here, we mainly discuss effects of deformation, keeping in mind that the method provides the self-consistent deformations as well.
III.1 Potential Energy Curves
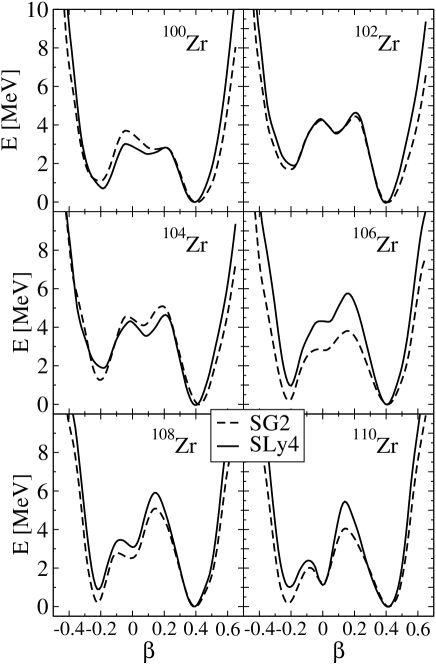
In Fig. 1(2) we can see the potential energy curves for the even-even 100-110Zr (104-114Mo) isotopes. We show the energies relative to that of the ground state plotted as a function of the quadrupole deformation . They are obtained from constrained HF+BCS calculations with the Skyrme forces SG2 sg2 and SLy4 sly4 . We observe that both forces produce very similar results. In Fig. 1 we see that the Zr isotopes exhibit in all cases two well developed minima. The ground states are located in the prolate sector at positive values of . We can also see oblate minima at higher energies located at . The two minima are separated by potential energy barriers varying from MeV, in the lightest 100Zr isotope, up to barriers of the order of 5 MeV in heavier isotopes. In the isotopes 108-110Zr a spherical local minimum is also developed.
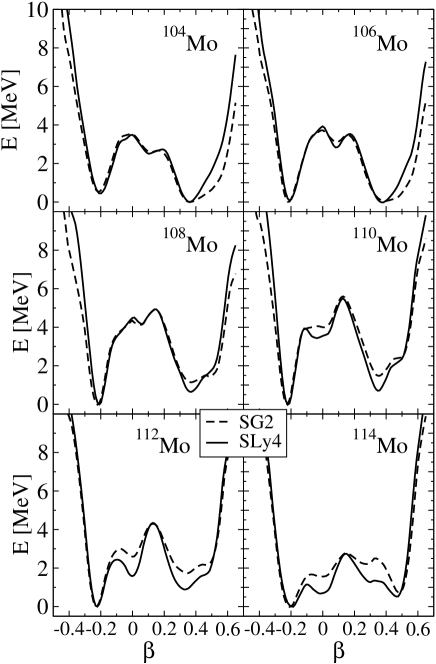
Similar trends are observed in Fig. 2 for the Mo isotopes. We observe well developed oblate and prolate minima, which are separated by barriers ranging from 3 MeV up to 5 MeV. We get a prolate ground state with an oblate minimum very close in energy in the lightest isotope considered, 104Mo, a practically degenerate oblate-prolate in 106Mo, and oblate ground states in heavier isotopes with quadrupole deformations at with prolate excited states at energies lower than 1 MeV. Again, the heavier isotopes favor the appearance of a spherical configuration at very low energies, resulting in an emergent triple oblate-spherical-prolate shape coexistence scenario.
These results are in qualitative agreement with similar ones obtained in this mass region from different theoretical approaches. As an example of these methods we can mention the results obtained in Ref. skalski97 , where this mass region was studied within a macroscopic-microscopic approach based on an energy obtained from a liquid drop or a FRLDM modified by a shell correction taken from a deformed Woods-Saxon potential. Zr isotopes from to were predicted to have well-deformed prolate ground states, while Mo isotopes suffered a shape transition from prolate shapes in the lighter neutron-rich isotopes () to oblate shapes in the heavier ones. Similarly, the deformations obtained in Ref. FRDM from the FRDM and a folded-Yukawa single-particle microscopic model were in the range in the Zr isotopes considered in this work and in the Mo isotopes, except in the heavier 114Mo, where an oblate shape with becomes the ground state. RMF calculations lala1 ; lala2 show ground-state deformations in the range of in the Zr isotopes, while for Mo isotopes oblate ground states are obtained with parameters of deformation between and , except in the lighter isotope 104Mo, where a prolate ground state is found. Calculations including rotational states in terms of the total Routhian surface (TRS), using non-axial Wood-Saxon potentials xu02 , predicted two coexisting prolate and oblate minima ( and ) for 106-116Zr isotopes, where the prolate ground state becomes oblate beyond 110Zr. The same calculations showed oblate () ground-states for Mo isotopes. Finally, similar results in the sense of competing oblate and prolate shapes and emergence of spherical configurations in the heavier isotopes are also obtained within the Hartree-Fock-Bogoliubov framework with the finite-range effective Gogny interaction D1S hilaire . Equilibrium oblate () and prolate () coexistent deformations were found in Ref. hilaire practically at the same energy in the Zr isotopes. In Mo isotopes an oblate shape () is favored energetically with close prolate () solutions. In both cases, Zr and Mo isotopes, a spherical solution lows in energy and becomes almost degenerate with the deformed solutions for the heavier isotopes 110Zr and 114Mo.
Thus, a consistent theoretical picture emerges, which is supported by the still scarce experimental information available. Experimentally, two coexisting deformed bands weakly admixed were found in 100Zr mach1 ; mach2 from an analysis of and and a two-level mixing model analysis. One of these bands is a highly deformed prolate yrast band (), while the other is moderately deformed () and weakly mixed to the yrast by about . The highly deformed band in 100Zr is nearly identical to the yrast band in 102Zr. Hill et al. hil91 have also discussed the possibility that the level measured for 102Zr at 895 keV could be the head of a band with , similar to the S band of 100Zr.
Quadrupole moments were also determined urban for rotational bands in 98-104Zr isotopes and deformation parameters were deduced increasing gradually from at up to at . More recently goodin , large deformations () were extracted in 104Zr and in 106Mo () from the half-lives of their states. Spectroscopic studies of high-spin states of 100-104Zr and 102-108Mo have also been performed by Hua et al. hua04 within the particle-rotor model. According to these authors, the difference in signature splitting observed for the 5/2-[532] band between the odd Zr and Mo isotopes could be attributed to the appearance of triaxiality in Mo isotopes. As mentioned above, the formalism employed in the present study does not include non-axial deformation. Such limitation, however, has no significant impact in the results discussed here. As an example, the inclusion of triaxiality in the last version of the FRLDM moller08 resulted in a small reduction of the 106,108Mo ground-state energies (of about 250 keV) at =17.5∘, with respect to pure prolate shapes. Similarly, Xu et al. xu02 predict a -soft triaxial minimum for 108Mo.
III.2 Gamow-Teller strength distributions
In the next figures, we show the results obtained for the energy distributions of the GT strength corresponding to the oblate-prolate-spherical equilibrium shapes for which we obtained minima in the potential energy curves in Figs. 1 and 2. The results are obtained with the force SLy4, using constant pairing gaps extracted from the experimental masses (or systematics) and with residual interactions with the parameters written in Sec. II. The GT strength in units, is plotted versus the excitation energy of the daughter nucleus and a quenching factor 0.77 has been included.
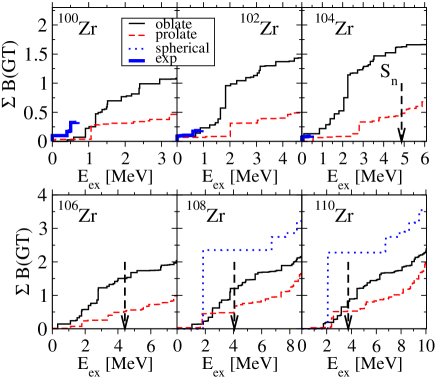
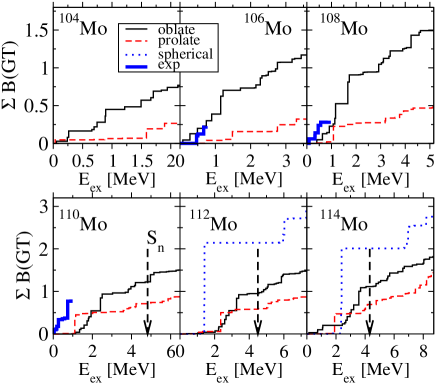
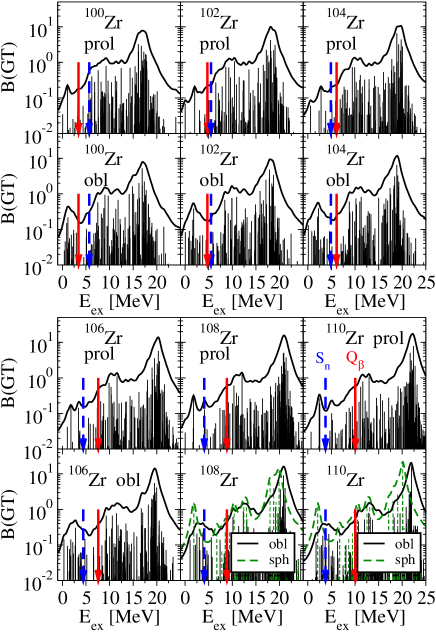
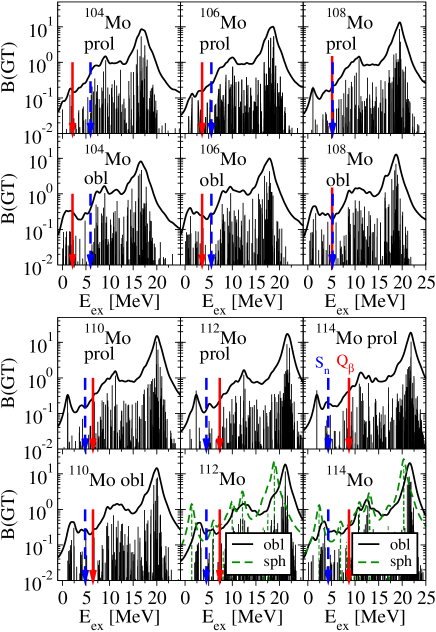
Figs. 3 and 4 contain the results for Zr and Mo isotopes, respectively. We show the energy distributions of the individual GT strengths together with continuous distributions obtained by folding the strength with 1 MeV width Breit-Wigner functions. The vertical arrows show the and energies, taken from experiment audi or from the mass formula in Ref. DufloZuker when data are not available, as we shall explain later on.
The main characteristic of these distributions is the existence of a GT resonance located at increasing excitation energy as the number of neutrons increases. The total GT strength also increases with , as it is expected to fulfill the Ikeda sum rule. It is worth noticing that both oblate and prolate shapes produce quite similar GT strength distributions on a global scale. Even the spherical profiles are quite close to the deformed ones. Nevertheless, the small differences among the various shapes at the low energy tails (below the ) of the GT strength distributions that can be appreciated because of the logarithmic scale, lead to sizable effects in the -decay half-lives. In the next figures, Fig. 5 for Zr isotopes and Fig. 6 for Mo isotopes, we can see the accumulated GT strength plotted up to the corresponding energy of each isotope, which is the relevant energy range for the calculation of the half-lives. Also shown by vertical dashed lines are the energies when they are lower than . In this magnified scale one can appreciate the sensitivity of these distributions to deformation and how measurements of the GT strength distribution from -decay can be a tool to get information about this deformation, as it was carried out in Refs. exp_poirier ; exp_nacher . The accumulated strength from the oblate shapes is in general larger than the corresponding prolate profiles. The spherical distributions have distinct characteristics showing always as a strong peak at an excitation energy around 2 MeV. The profiles from different shapes could be easily distinguished experimentally from each other. This is specially true in the case of the lighter isotopes 100-104Zr and 104-108Mo, where the differences are enhanced. These isotopes are in principle easier to measure since they are the less exotic.
Experimental information on GT strength distributions in these isotopes is only available in the energy range below 1 MeV for the isotopes 106,108Mo jokinen , 110Mo wang04 , and 100,102,104Zr rinta07 . These data can be seen in Figs. 5 and 6, together with the QRPA calculations. Unfortunately, the energy region is still very narrow and represents only a small fraction of the GT strength relevant for the half-life determination. Clearly, more experimental information is needed to get insight into the nuclear structure of these isotopes.
III.3 Half-lives and -delayed neutron-emission probabilities
The calculation of the half-lives in Eq. (9) involves the knowledge of the GT strength distribution and of the values. The calculation of the probability for -delayed neutron emission in Eq. (13) involves also the knowledge of the energies. We use experimental values for and , which are taken from Ref. audi or from the Jyväskylä mass database jyvaskyla , when available. But in those cases where experimental masses are not available, one has to rely on theoretical predictions for them. There are a large number of mass formulas in the market obtained from different approaches.
The strategy used in this work is first of all to compare with experiment the predictions of some representative mass formulas in the mass region where data are available. According to their success in reproducing the and energies, we finally adopt the most convenient mass formula for extrapolations to the unknown regions.
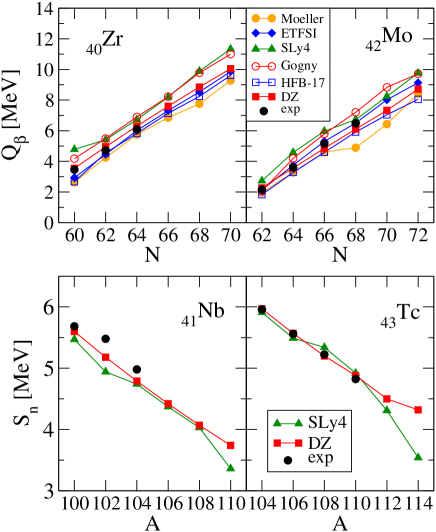
In Fig. 7 we show this comparison for six frequently used mass formulas. We use the model of P. Möller et al. FRDM that belongs to a microscopic-macroscopic type of calculation. It contains a FRDM corrected by microscopic effects obtained from a deformed single-particle model based on a folded Yukawa potential including pairing in the Lipkin-Nogami approach. Then we use the ETFSI model ETFSI , which adopts a semi-classical approximation to the Hartree-Fock method including full Strutinsky shell corrections and BCS pairing correlations. The label SLy4 stands for the masses calculated from the Skyrme force SLy4 with a zero-range pairing force and Lipkin-Nogami obtained from the code HFBTHO mass_sly4 and compiled in web_sly4 . The results under the label Gogny have been obtained from the HFB calculations with the finite-range Gogny-D1S force hilaire . The HFB-17 model is one of the most recent versions of the Skyrme HFB mass formulas introduced by the Brussels-Montreal group HFB17_1 ; HFB17_2 . As in the case of the previous cases, SLy4 and Gogny, this is a fully microscopic approach since it is based on an effective two-body nucleon-nucleon interaction. The Duflo and Zuker (DZ) mass model DufloZuker is written as an effective Hamiltonian which contains two parts, a monopole term and a multipole term. The monopole calculations are purely HF-type based on single-particle properties while the multipole term acts as a residual interaction and the calculation goes beyond HF. Its predictive power has been recently checked mendoza with a number of tests probing its ability to extrapolate with very good results. In this work we use the 10-parameter version of the mass formula mendoza_pre , which is a simplification of the more sophisticated 28-parameter mass formula in Ref. DufloZuker .
In the upper panels of Fig. 7 we can see the experimental values (black dots) audi ; jyvaskyla , available for the isotopes 100,102,104Zr and 104,106,108,110Mo. They are compared with the predictions of the various mass models discussed above. In the lower panels we have the neutron separation energies corresponding to the daughter isotopes of Nb and Tc, where we compare the measured energies (black dots) with the predictions of the DZ formula and SLy4 force. We have selected for consistency the SLy4 predictions, but also the DZ mass formula as one of the the most suited formula in this particular mass region. They agree pretty well with the measured values for both and values. In what follows the results for half-lives and for the 106,108,110Zr and 112,114Mo will be obtained by using and from SLy4 and DZ mass formula.
In Figs. 8 and 9 we can see the dependence of the half-lives and values with the quadrupole deformation . Solid lines in the lighter isotopes (104Zr and 108,110Mo) correspond to QRPA-SLy4 calculations using experimental and . In the heavier isotopes (106-110Zr and 112,114Mo), where there are no data for and , solid (dashed) lines correspond to QRPA-SLy4 calculations using and from SLy4 (DZ). Experimental data are shown by horizontal dashed lines, where the shaded region in between corresponds to a 1- confidence level. The vertical dashed lines show the self-consistent quadrupole deformations for which we obtained the equilibrium shape configurations (see Figs. 1 and 2). The first evidence to mention is that a spherical approach to these nuclei is far from the measured data, demanding a deformed treatment.
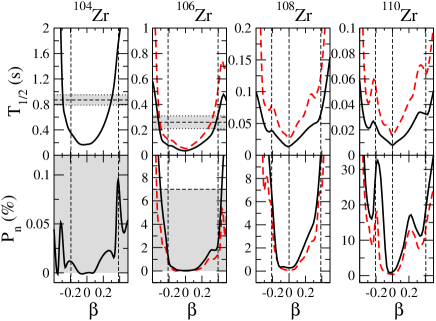
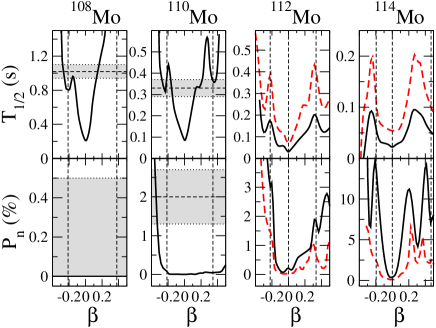
In Fig. 8 we show the results for the isotopes 104-110Zr. In the cases of 104,106Zr we reproduce the experimental half-lives with oblate and prolate deformations very close to the self-consistent ones. In the oblate case the calculation gives half-lives lower than experiment, while the self-consistent prolate deformation produces somewhat larger ones. Thus, the experiment would be reproduced either by nuclear deformations which do not produce shapes at equilibrium () or by a mixing of the equilibrium deformations. Interestingly, similar results were obtained in Ref. pereira for 104Zr, from the analysis of the measured -decay properties of 104Y in terms of quadrupole deformation of the daughter 104Zr (see FRDM for a formal definition of the parameters and ). In that case, the quadrupole deformation needed to reproduce the measured half-life and value was , although oblate deformations were ruled out at that time. An important difference between the results shown in Fig. 8 and those discussed in Ref. pereira is the abrupt increase seen in the latter for the and value for a near-spherical 104Zr. These large values were mostly produced by the location of the GT-populated g9/2g7/2 level at rather high energies in the spherical daughter 104Zr. This discrepancy emphasizes the sensitivity of and to the structure details of the mother/daughter nuclei. The experimental values are only upper limits, although they are much larger than the typical values obtained theoretically. In the heavier isotopes there are no data and these results are then useful to see the sensitivity to deformation of the predictions. The spherical minima in the heavier isotopes predict half-lives and values much lower than the corresponding values for deformed shapes. In Fig. 9 we have the results for the isotopes 108-114Mo. In the case of 108Mo the half-life is reproduced with the self-consistent oblate deformation, while the prolate one generates too high half-lives. In the case of 110Mo the measured half-life is well reproduced with both oblate and prolate equilibrium deformations. In the case of 108Mo the value is zero since experimentally jyvaskyla . For 110Mo the value is not reached by the calculations. As in the case of the heavier Zr isotopes, the heavier Mo isotopes show that the half-lives for the spherical minima are much smaller than the corresponding half-lives for the self-consistent oblate and prolate shapes. In general we observe that the half-lives ( values) in the heavier Zr and Mo isotopes calculated with and from SLy4 (solid lines) are lower (larger) than the results calculated with and from DZ (dashed lines).
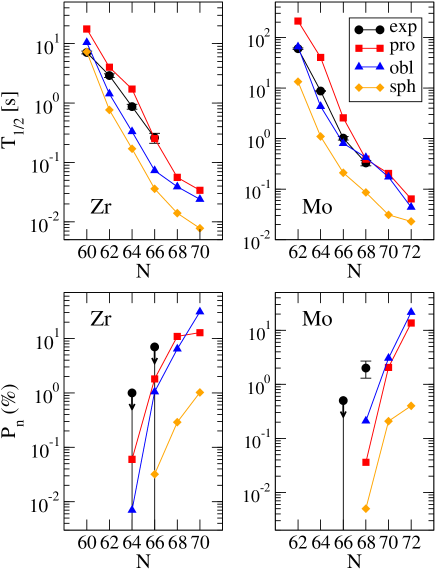
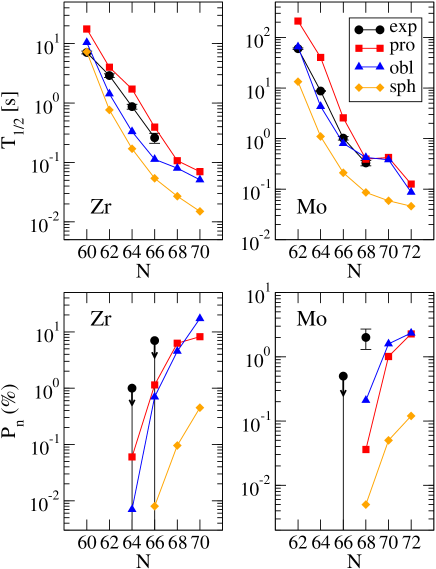
In Figs. 10 and 11 we compare the measured -decay half-lives (upper panels) and values (lower panels) with the theoretical results obtained with the oblate, prolate, and spherical equilibrium shapes. In the 100-104Zr isotopes we use experimental and values, while in the heavier 106-110Zr isotopes we use SLy4 in Fig. 10 and the DZ mass formula in Fig. 11. Similarly, for the 104-110Mo isotopes we use experimental and values, while for 112-114Mo we use SLy4 in Fig. 10 and the DZ mass formula in Fig. 11. In the case of Zr isotopes, we can see that the experimental half-life is close to the oblate result in 100Zr and appear systematically between the prolate and oblate calculations in the isotopes 102,104,106Zr. One wonders whether such result could be explained by the coexistence of a highly-deformed prolate ground-state configuration with a moderately deformed minimum similar to that found in 100Zr mach1 ; mach2 and (more speculatively) in 102Zr hil91 . The results seem to indicate that such weakly-deformed intruder configurations may have an oblate character. In the heavier isotopes 108,110Zr the predictions of both oblate and prolate are very close to each other and much larger than the result obtained from spherical shapes. Measuring these half-lives and values will be a good opportunity to check the role of spherical configurations in these exotic nuclei, since the spherical components will lower the half-lives and values by factors about 5 and 15-50, respectively.
In the case of Mo isotopes, the experimental half-lives in 104,106,108,110Mo tend to favor the oblate theoretical results (which are indeed the ground states) over the prolate ones. In the heavier 112,114Mo isotopes, as in the case of the heavier Zr isotopes, oblate and prolate results are very similar and much larger than the spherical predictions, offering again a sensitive test to analyze the deformation of these heavy nuclei, for which spectroscopic measurements are more difficult. Experimental values are only upper limits except for the case 110Mo, which is much larger than the calculations. This implies that the relative GT strength contained in the energy region below is overestimated theoretically and therefore the relative contribution coming from the strength above is too small. This can be seen in Fig. 6 for 110Mo, where the accumulated strength is practically flat above . The half-lives and values of the nuclei, predicted here for spherical configurations, would have clear consequences in the calculation of r-process abundances. In particular, the abrupt reduction of the values may contribute to fill the artificial trough around predicted by current r-process nucleosynthesis models. Furthermore, the confirmation of spherical shapes in these nuclei may be an indirect signature of the shell quenching since both phenomena are predicted by the SLy4 force used in our calculations.
IV CONCLUSIONS
In this paper we have studied the -decay properties of neutron-deficient Zr and Mo isotopes within a deformed QRPA approach based on mean fields generated from self-consistent Skyrme Hartree-Fock calculations. In particular, we have analyzed the experimental information on the half-lives and -delayed neutron-emission probabilities in the neutron-rich 100-110Zr and 104-114Mo isotopes in terms of the nuclear deformation.
We have shown that the measured half-lives in Zr isotopes are placed between the results obtained from the oblate and prolate coexistent shapes that appear very close in energy in the PECs. The predicted half-lives in the heavier Zr isotopes 108,110Zr, where there are no experimental data yet, are however very close to each other for both oblate and prolate shapes and much larger than the predictions from the spherical shapes. On the other hand, the measured half-lives in Mo isotopes agree better with the calculations from oblate shapes, which are lower than the corresponding prolate ones. Once more, in the heavier isotopes 112,114Mo, the predicted half-lives for both shapes are very close and larger than the spherical ones. Thus, comparison with experimental half-lives indicates that in some cases (Mo isotopes) a single shape accounts for this information, while in other cases (most of the Zr isotopes) a more demanding treatment in terms of mixing of different shapes seems to be more appropriate. values are in general not well reproduced, although experimentally only upper limits are measured in most cases. Hence, it will be certainly worth measuring those heavier isotopes and check whether they are properly described by the deformed shapes, or a spherical component is needed as well.
Nevertheless, one should keep in mind that half-lives are integral properties that collect all the information of the decay in a single number and does not tell us about the detailed internal structure of the GT strength distribution, much more sensitive to the nuclear structure. From a more detailed analysis of the GT strength distributions in the energy range accessible in -decay, we have shown that the differences between the predictions of the different nuclear shapes could be clearly distinguished experimentally. Although these spectroscopic measurements are at present not feasible because of the still low production rates of exotic nuclei at modern radioactive beam facilities, they will provide in the future precise tests of the nuclear structure in exotic nuclei.
Acknowledgements.
This work was supported by Ministerio de Ciencia e Innovación (Spain) under Contract No. FIS2008–01301. It was also supported in part by the Joint Institute for Nuclear Astrophysics (JINA) under NSF Grant PHY-02-16783 and the National Superconducting Cyclotron Laboratory (NSCL) under NSF Grant PHY-01-10253.References
- (1) E. M. Burbidge, G. M. Burbidge, W. A. Fowler, and F. Hoyle, Rev. Mod. Phys. 29, 547 (1959).
- (2) J. J. Cowan, F.-K. Thielemann, and J. W. Truran, Phys. Rep. 208, 267 (1991).
- (3) K.-L. Kratz, J.-P. Bitouzet, F.-K. Thielemann, P. Möller, and B. Pfeiffer, Ap. J. 403, 216 (1993).
- (4) J. Dobaczewski, I. Hamamoto, W. Nazarewicz, and J. A. Sheikh, Phys. Rev. Lett. 72, 981 (1994).
- (5) J. Dobaczewski, W. Nazarewicz, T. R. Werner, J. F. Berger, C. R. Chinn, and J. Dechargé, Phys. Rev. C 53, 2809 (1996).
- (6) T. Otsuka, T. Matsuo, and D. Abe, Phys. Rev. Lett. 97, 162501 (2006).
- (7) B. Chen, J. Dobaczewski, K.-L. Kratz, K. Langanke, B. Pfeiffer, F.-K. Thielemann, and P. Vogel, Phys. Lett. B 355, 37 (1995).
- (8) B. Pfeiffer, K.-L. Kratz, and F.-K. Thielemann, Z. Phys. A 357, 235 (1997).
- (9) B. Pfeiffer, K.-L. Kratz, F.-K. Thielemann, and W. B. Walters, Nucl. Phys. A693, 282 (2001).
- (10) B. Sun, F. Montes, L. S. Geng, H. Geissel, Yu. A. Litvinov, and J. Meng, Phys. Rev. C 78, 025806 (2008).
- (11) J. M. Pearson, R. C. Nayak, and S. Goriely, Phys. Lett. B 387, 455 (1996).
- (12) J. L. Wood, K. Heyde, W. Nazarewicz, M. Huyse, and P. Van Duppen, Phys. Rep. 215, 101 (1992).
- (13) R. F. Casten, Nucl. Phys. A443, 1 (1985).
- (14) J. Pereira et al., Phys. Rev. C 79, 035806 (2009).
- (15) J. Krumlinde and P. Möller, Nucl. Phys. A417, 419 (1984).
- (16) P. Möller and J. Randrup, Nucl. Phys. A514, 1 (1990).
- (17) P. Möller, J. R. Nix, and K.-L. Kratz, At. Data Nucl. Data Tables 66, 131 (1997).
- (18) P. Möller, B. Pfeiffer, and K.-L. Kratz, Phys. Rev. C 67, 055802 (2003).
- (19) P. Möller, J. R. Nix, W. D. Myers, and W. J. Swiatecki, At. Data Nucl. Data Tables 59, 185 (1995).
- (20) P. Möller, R. Bengtsson, B. G. Carlsson, P. Olivius, T. Ichikawa, H. Sagawa, and A. Iwamoto, At. Data Nucl. Data Tables 94, 758 (2008).
- (21) J. Engel, M. Bender, J. Dobaczewski, W. Nazarewicz, and R. Surman, Phys. Rev. C 60, 014302 (1999).
- (22) I. N. Borzov and S. Goriely, Phys. Rev. C 62, 035501 (2000).
- (23) I. N. Borzov, Nucl. Phys. A777, 645 (2007).
- (24) I. N. Borzov, J. J. Cuenca-García, K. Langanke, G. Martínez-Pinedo, and F. Montes, Nucl. Phys. A814, 159 (2008).
- (25) T. Niksic, T. Marketin, D. Vretenar, N. Paar, and P. Ring, Phys. Rev. C 71, 014308 (2005).
- (26) H. Homma, E. Bender, M. Hirsch, K. Muto, H. V. Klapdor-Kleingrothaus and T. Oda, Phys. Rev. C 54, 2972 (1996).
- (27) M. Hirsch, A. Staudt, K. Muto and H. V. Klapdor-Kleingrothaus, Nucl. Phys. A535, 62 (1991).
- (28) K. Muto, E. Bender, T. Oda and H. V. Klapdor-Kleingrothaus, Z. Phys. A 341, 407 (1992).
- (29) P. Sarriguren, E. Moya de Guerra, A. Escuderos, and A. C. Carrizo, Nucl. Phys. A635, 55 (1998).
- (30) P. Sarriguren, E. Moya de Guerra, and A. Escuderos, Nucl. Phys. A691, 631 (2001).
- (31) E. Chabanat, P. Bonche, P. Haensel, J. Meyer, and R. Schaeffer, Nucl. Phys. A635, 231 (1998).
- (32) D. Vautherin and D. M. Brink, Phys. Rev. C 5, 626 (1972); D. Vautherin, Phys. Rev. C 7, 296 (1973).
- (33) G. Audi, O. Bersillon, J. Blachot, and A. H. Wapstra, Nucl. Phys. A729, 3 (2003).
- (34) H. Flocard, P. Quentin, A. K. Kerman, and D. Vautherin, Nucl. Phys. A203, 433 (1973).
- (35) http://massexplorer.org/
- (36) P. Sarriguren, Phys. Rev. C 79, 044315 (2009).
- (37) P. Sarriguren, Phys. Lett. B 680, 438 (2009).
- (38) A. Bohr and B. Mottelson, Nuclear Structure, Vol. II, p. 10 (Benjamin, New York 1975).
- (39) G. F. Bertsch and I. Hamamoto, Phys. Rev. C 26, 1323 (1982).
- (40) N. B. Gove and M. J. Martin, Nucl. Data Tables 10, 205 (1971).
- (41) P. Sarriguren, R. Alvarez-Rodríguez, and E. Moya de Guerra, Eur. Phys. J. A 24, 193 (2005).
- (42) P. Sarriguren, E. Moya de Guerra, and A. Escuderos, Nucl. Phys. A658, 13 (1999).
- (43) P. Sarriguren, E. Moya de Guerra, and A. Escuderos, Phys. Rev. C 64, 064306 (2001).
- (44) P. Sarriguren, O. Moreno, R. Alvarez-Rodríguez, and E. Moya de Guerra, Phys. Rev. C 72, 054317 (2005).
- (45) N. Van Giai and H. Sagawa, Phys. Lett. B 106, 379 (1981).
- (46) J. Skalski, S. Mizutori, and W. Nazarewicz, Nucl. Phys. A617, 281 (1997).
- (47) G. A. Lalazissis and M. M. Sharma, Nucl. Phys. A586, 201 (1995).
- (48) G. A. Lalazissis, S. Raman, and P. Ring, At. Data Nucl. Data Tables 71, 1 (1999).
- (49) F. R. Xu, P. M. Walker, and R. Wyss, Phys. Rev. C 65, 021303(R) (2002).
- (50) S. Hilaire and M. Girod, Eur. Phys. J. A 33, 237 (2007); http://www-phynu.cea.fr/.
- (51) H. Mach et al., Phys. Lett. B 230, 21 (1989).
- (52) H. Mach et al., Phys. Rev. C 41, 350 (1990).
- (53) J. C. Hill, D. D. Schwellenbach, F. K. Wohn, J. A. Winger, R. L. Gill, H. Ohm, K. Sistemich, Phys. Rev. C 43, 2591 (1991).
- (54) W. Urban et al., Nucl. Phys. A689, 605 (2001).
- (55) C. Goodin et al., Nucl. Phys. A787, 231c (2007).
- (56) H. Hua, C. Y. Wu, D. Cline, A. B. Hayes, R. Teng, R. M. Clark, P. Fallon, A. Goergen, A. O. Macchiavelli, and K. Vetter, Phys. Rev. C 69, 014317 (2004).
- (57) J. Duflo and A. P. Zuker, Phys. Rev. C 52, R23 (1995).
- (58) E. Poirier et al., Phys. Rev. C 69, 034307 (2004).
- (59) E. Nácher et al., Phys. Rev. Lett. 92, 232501 (2004).
- (60) A. Jokinen, T. Enqvist, P. P. Jauho, M. Leino, J. M. Parmonen, H. Penttilä, J. Äystö, and K. Eskola, Nucl. Phys. A584, 489 (1995).
- (61) J. C. Wang et al., Eur. J. A 19, 83 (2004).
- (62) S. Rinta-Antila et al., Eur. J. A 31, 1 (2007).
- (63) http://research.jyu.fi/igisol/JYFLTRAP_masses/
- (64) Y. Aboussir, J. M. Pearson, A. K. Dutta, F. Tondeur, At. Data Nucl. Data Tables 61, 127 (1995).
- (65) M. V. Stoitsov, J. Dobaczewski, W. Nazarewicz, and P. Ring, Comp. Phys. Comm. 167, 43 (2005).
- (66) S. Goriely, F. Tondeur, and J. M. Pearson, At. Data Nucl. Data Tables 77, 311 (2001).
- (67) S. Goriely, N. Chamel, and J. M. Pearson, Phys. Rev. Lett. 102, 152503 (2009).
- (68) J. Mendoza-Temis, I. Morales, J. Barea, A. Frank, J. G. Hirsch, J. C. López Vieyra, P. Van Isacker, and V. Velázquez, Nucl. Phys. A812, 28 (2008).
- (69) J. Mendoza-Temis, J. G. Hirsch, and A. P. Zuker, nucl-th: 0912.0882; www.nndc.bnl.gov/amdc/web/dz.html