Directly imaging damped Lyman- galaxies at
.
I: Methodology and First Results††thanks: Some of the data presented herein
were obtained at the W.M. Keck Observatory, which is operated as a scientific
partnership among the California Institute of Technology, the University of
California and the National Aeronautics and Space Administration. The Observatory
was made possible by the generous financial support of the W.M. Keck Foundation..
Abstract
We present the methodology for, and the first results from, a new imaging programme aimed at identifying and characterizing the host galaxies of damped Lyman- absorbers (DLAs) at . We target quasar sightlines with multiple optically-thick H I absorbers and use the higher-redshift system as a “blocking filter” (via its Lyman-limit absorption) to eliminate all far-ultraviolet (FUV) emission from the quasar. This allows us to directly image the rest-frame FUV continuum emission of the lower-redshift DLA, without any quasar contamination and with no bias towards large impact parameters. We introduce a formalism based on galaxy number counts and Bayesian statistics with which we quantify the probability that a candidate is the DLA host galaxy. This method will allow the identification of a bona fide sample of DLAs that are too faint to be spectroscopically confirmed. The same formalism can be adopted to the study of other quasar absorption line systems (e.g. Mg II absorbers). We have applied this imaging technique to two QSO sightlines. For the DLA towards J073149+285449, a galaxy with impact parameter h kpc and implied star formation rate (SFR) of h M⊙ yr-1 is identified as the most reliable candidate. In the case of the DLA towards J211444-005533, no likely host is found down to a SFR limit of h M⊙ yr-1. Studying the H I column density as a function of the impact parameter, including 6 DLAs with known hosts from the literature, we find evidence that the observed H I distribution is more extended than what is generally predicted from numerical simulation.
keywords:
Method: statistics – Galaxies: high-redshift – Galaxies: quasars: absorption lines – Galaxies: quasars: individual: J211444-005533 and J073149+285449.1 Introduction
Absorption lines detected along the line of sight to quasi-stellar objects (QSOs) and gamma ray bursts (GRBs) can be used to glean the properties of the intergalactic medium (IGM) and the interstellar medium (ISM) at high redshift. Before the advent of large millimeter and radio arrays such as the Atacama Large Millimeter Array (ALMA) or the Square Kilometre Array (SKA), the only available way to characterize the physical properties of the different gas phases in the high redshift Universe is through the analysis of hydrogen, metal, and molecular absorption lines. Although the sizes of the regions explored through the background QSO beam are too narrow to provide a detailed picture of individual objects, large spectroscopic surveys of QSOs across the sky enable the study of the absorbers as a population. This can lead to profound insights on the gas properties in high-redshift galaxies, crucial to constrain models of galaxy formation and evolution.
One of the most well-studied classes of absorbers are the damped Ly absorbers (DLAs). With an H I column density N cm-2, the DLAs contain most of the neutral gas in the Universe at (O’Meara et al., 2007). Also, by being associated with high gas overdensities in the cosmic web, DLAs are intimately connected with galaxy formation at high redshifts.
Besides the actual identification of DLAs, absorption spectroscopy can provide detailed information about the H I column density distribution of the absorbers, their chemical composition and kinematics, as well as the physical state of the neutral hydrogen (see the review by Wolfe et al., 2005). As a result of several decades of observations of DLAs, the distribution of neutral hydrogen in the Universe and its evolution with redshift is well constrained at high redshift (Prochaska et al., 2005; Prochaska & Wolfe, 2009; Noterdaeme et al., 2009). Still, pencil beam surveys yield only a limited picture of the morphology of DLA galaxies. In turn, this limits the utility of the absorbers for studying galaxy assembly and evolution.
While at low redshift (), DLAs are clearly associated with galaxies (e.g. Zwaan et al., 2005a, and references therein), the nature of high redshift DLAs is still uncertain. Since their discovery (Wolfe et al., 1986), the absorbers have often been associated with massive disks, as suggested by velocity profiles of low-ion metal transitions (Prochaska & Wolfe, 1997) and consistent with recent findings that massive thick disks with typical rotational velocities up to 200 km/s are already in place at redshift (Genzel et al., 2006; Förster Schreiber et al., 2009). However, the abundance patterns in DLAs indicate star formation histories more similar to those of dwarf irregular galaxies (Dessauges-Zavadsky, Calura, Prochaska et al., 2007), while the elusive nature of the DLA galaxies hints towards a population of low surface-brightness systems.
From a theoretical point of view, smoothed particle hydrodynamic (SPH) simulations which include gas physics are able to reproduce most of the observed DLA properties within a cold dark matter (CDM) formulation (see, however, Jedamzik & Prochaska, 1998). Although the results may depend on the treatment of feedback and winds, there is general agreement that the major contribution to the DLA cross-section at comes from low- and intermediate-mass halos with (see also Barnes & Haehnelt, 2009). This is consistent with the value inferred by Cooke et al. (2006) from the clustering of DLAs and Lyman-break galaxies (LBGs). Nevertheless, the debate around DLAs has not yet been settled. In fact, simulations tend to predict small impact parameters, suggesting that DLAs are more compact at high redshifts than modern disk galaxies. But this causes simulations to under-predict the observed rate of incidence (e.g. Nagamine et al., 2007) or the number of high velocity absorbers (Pontzen et al., 2008). Several mechanisms such as tidal-streams, outflows (e.g. Schaye, 2001) or filamentary structures (e.g. Razoumov et al., 2006) and cold flows penetrating inside massive halos (Kereš et al., 2005; Dekel et al., 2009) can provide a larger cross-section for DLA gas. More quantitative analysis of adaptive mash refinement (AMR) simulations are ongoing to understand if gas overdensities inside these more extended structures can reproduce the spectrum of kinematics observed in DLAs, as well as the incidence of the absorbers.
To identify which one, or which combination, of the above scenarios applies to DLAs requires direct imaging of the galaxies responsible for the absorption. Unfortunately, this task is particularly difficult at optical wavelengths due to the bright emission of the background quasar. In the past years, several attempts have been made in this direction111See Appendix B for a review of previous studies aimed at identifying DLA galaxies., typically by inspecting the residual images after subtracting out the quasar light. However, the galaxy counterparts of these absorbers are expected to be faint and probably at low impact parameters (e.g. Wolfe & Chen, 2006; Nagamine et al., 2007). Therefore, imperfections of the quasar subtraction are a challenge to such studies (see Kulkarni et al., 2000, 2001). As a result, only six spectroscopically-confirmed galaxy counterparts are currently known at (Møller & Warren, 1993; Djorgovski et al., 1996; Fynbo et al., 1999; Møller et al., 2002; Møller et al., 2004).
To overcome these limitations, new techniques are being explored. Surveys based on adaptive optics and improved modelling of the QSO point spread function (PSF) can minimise the impact of the quasar light on nearby objects, although some regions at very small impact parameters may still not be accessible. Narrow-band images from integral field unit (IFU) observations have the great advantage of providing both spatial and redshift information at the same time. Unfortunately, current instruments do not provide very high sensitivity at the short wavelengths needed to detect the Ly line at (see Christensen et al., 2007). A very promising technique to image high- absorbers was proposed by O’Meara et al. (2006), who considered imaging Mg II absorbers at . The basic idea, presented in more detail in section 2, consists of imaging QSO sightlines with two known high column density absorbers. The higher-redshift absorber can then act as a natural filter to block the quasar light, so that the rest-frame far-ultraviolet (FUV) emission of the lower-redshift DLA can be detected without any contamination from the quasar.
This paper, the first of a series, presents initial results from a new survey to image DLAs at , using the above technique. In section 2, we discuss the target selection criteria, in section 3, we describe the observations of two quasar fields, the data reduction procedure, and our results, while, in sections 4 and 5, we focus on different methods to identify the galaxy counterparts. Analysis and discussion follow in sections 6 and 7, while section 8 summarizes our present results and considers prospects for the future. We adopt a -cold-dark-matter (CDM) cosmology throughout this paper, with , , and . All lengths are proper distances unless otherwise stated. Physical quantities are computed including the Hubble constant, in units of .
2 Survey design
The selection criteria for our targets are based on an updated version of the O’Meara et al. (2006) method, used to eliminate quasar contamination. We search among all the known QSOs with a foreground DLA in the Sloan Digital Sky Survey (SDSS) that also harbour a higher-redshift Lyman-limit system (LLS)222We refer to the second absorber as an LLS to make clear the distinction with the target DLA, at a lower redshift, that is to be imaged. However, the higher-redshift absorber can also be a DLA.. By requiring N cm-2 for the LLS, we only include absorbers that are highly optically thick () to Lyman continuum photons. This configuration of two absorbers allows us to use the higher-redshift absorber to completely block the quasar light, allowing the FUV emission of the lower-redshift DLA to be imaged without any quasar contamination or source confusion from the QSO host galaxy.
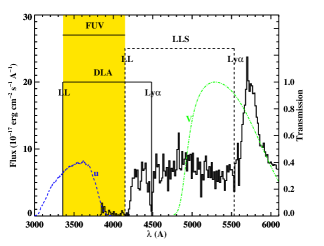
An example is provided in Figure 1, where we show the SDSS spectrum of the QSO J073149+285449. For illustrative purposes, the LRIS333Low Resolution Imaging Spectrometer at Keck I (Oke et al., 1995). and filter transmission curves are superimposed with blue dashed and green dash-dotted lines, respectively. The quasar spectrum exhibits an LLS at with a corresponding Ly absorption line at 5500Å and a Lyman limit (LL) at ÅÅ. In addition, Ly absorption from a lower redshift DLA can be seen at Å, with an associated Lyman limit at ÅÅ. The higher-redshift LLS entirely absorbs the quasar light at , as seen in the spectrum. This allows the lower-redshift DLA to be imaged in filters covering wavelengths blueward of .
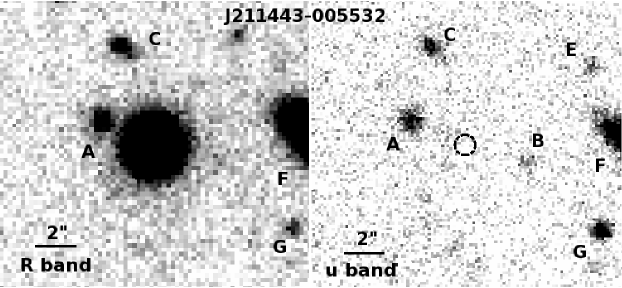
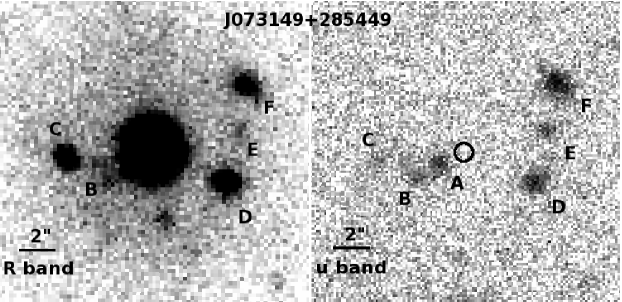
A comparison between the -band and -band images of two such fields, containing the quasars J211444-005533 (top) and J073149+285449 (bottom), is shown in Figure 2. The QSOs are visible only in the -band images (the left panels of the figure), while they are fully absorbed by the higher-redshift LLSs in the -band images (the right panels). This allows the detection of faint lower-redshift galaxies at all impact parameters. It is useful to note that, even if the LLS is associated with a star-forming galaxy, it is unlikely to be visible in the filter unless the galaxy has a very high escape fraction. Moreover, the UV light from the LLS will eventually recover from the absorption at , but without a significant contribution in the -band. This prevents confusion for the identification of the lower- DLA. The LLS could be detected in the - or -band imaging as a Lyman-break galaxy, unless it is projected onto the quasar.
Next, since the DLA has its own Lyman limit, its FUV emission can be detected only in the wavelength interval
| (1) |
highlighted with a yellow shaded area in Figure 1. Therefore, it is strategic to impose the selection criterion that , so as to maximise the emission from the DLA in the -band filter. Conversely, a lower limit on the DLA redshift is imposed by the condition ÅÅ, i.e. the DLA Ly line has to be visible in the spectrum. The latter improves upon the original selection criterion of O’Meara et al. (2006), who relied on strong metal lines (e.g. Mg II, Fe II, etc) to infer the presence of a high column-density absorber (see also Christensen et al., 2009). While strong Mg II absorbers and DLAs are often considered highly overlapping populations (Rao et al., 1995), only of strong Mg II absorbers have been found to have a column density above the DLA limit (Rao et al., 2006). An additional advantage of our approach is that the H I column density for our targets is directly measurable from the Ly absorption line, implying that it is possible to determine the metallicity and relative abundances in the absorber’s ISM along the QSO sightline. The downside is that we impose another constraint on the redshift separation of the two absorbers which limits the number of possible targets. Finally, two additional conditions set the absolute redshift space that we can probe with our survey using current technology. An upper limit at is imposed by the absorption from the intergalactic medium (IGM). In fact, at higher redshifts the blanketing effect of the IGM starts affecting the emission from the DLA galaxy, lowering the chance of a detection. Conversely, a lower limit at is imposed by the target selection using SDSS and, more generally, by the use of optical rather than UV facilities. We note, finally, that the short wavelength imaging can be carried out with either ground- or space-based facilities.
 |
 |
At first, the requirement that two absorbers should lie in a narrow range of redshifts along a single sightline may suggest that we will be able to target only a few systems in this particular spatial configuration. However, among the DLAs known at from the SDSS (DR5; Prochaska et al., 2005), sightlines meet our selection criteria. Therefore, the proposed technique is a promising way of obtaining a large sample of DLAs for a statistical study of the emission properties of the host galaxies. Note that it is important to restrict the wavelength range that is imaged to the region between the Lyman limits of the two DLAs, to minimize both the leakage from the QSO and the sky emission at . Using a tunable medium-band filter would be ideal for this project, but such filters are not typically available on large telescopes. To isolate a first sample of high-priority targets, we require that the broad-band filters that are currently available overlap with the FUV visibility window defined by Eq. (1). With these additional constraints, we have selected a sample of sightlines, of which will be imaged with Wide Field Camera-3 (WFC3) on the Hubble Space Telescope (HST)444The HST-WFC3 observations have been scheduled for the ongoing Cycle 17, proposal ID 11595., and with ground-based facilities.
In summary, with this survey we aim to increase the number of known host galaxies of high- DLAs, over a wide range of both redshift () and H I column density (N cm-2). Since any bias towards large impact parameters is completely removed, even non-detections of DLA emission will provide interesting constraints on the star formation rates (SFRs) of the absorbers. While such non-detections might have been attributed to the quasar glare in previous studies, our technique will yield robust upper limits on the DLA luminosities.
3 Observations
We have applied the technique described in the preceding section to two QSOs, J211444-005533 and J073149+285449, each with two high H I column density absorbers along the sightline. Details concerning the quasars and the absorbers are provided in Table 1. The last column lists the fraction of the -band filter transmission that covers the FUV window in which the DLA can be imaged:
| (2) |
In the case of J211444-005533, the “blocking” absorber is a system at , associated with the quasar, while the target absorber is a super Lyman-limit system (SLLS; or a sub-DLA555J211444-005533 has been included in our sample since the measured value of column density together with the associated error places this object at the edge of the DLA classification.), at . Conversely, for J073149+285449, the blocking absorber and the intervening DLA are at and , respectively.
Imaging of the fields of J211444-005533 and J073149+285449 was obtained at Keck I using LRIS. The first field was observed in October 2008, during a photometric night, and the second field in January 2009, during a stable but non-photometric night. A set of short exposures for J073149+285449 were subsequently acquired in a photometric night for flux calibration. The blue side of LRIS is equipped with a 22K4K back-side-illuminated Marconi CCD with a plate scale of ′′ pix-1. Before June 2009, a 2K4K front-side-illuminated Textronic CCD with a plate scale of ′′ pix-1 was in operation on the red side.
| DLA | log N | f(FUV) | |||||
|---|---|---|---|---|---|---|---|
| (mag.) | (Å) | (cm-2) | |||||
| J211444-005533 | 3.44 | 18.67 | 3.44 | 4052 | 2.92 | 20.20 | 0.38 |
| J073149+285449 | 3.68 | 18.47 | 3.55 | 4152 | 2.69 | 20.55 | 0.73 |
3.1 Imaging
We acquired multiple exposures for each target, dithering 15′′ to remove CCD defects in the final image. A summary of the observations is in Table 2. By splitting the incoming light through a dichroic mirror (50% transmission at 4874Å), -, - and -band images were obtained for J211444-005533, simultaneous with the -band exposures. During the observations of J073149+285449, water vapor condensed on the window of the red-side camera, producing a halo around the quasar (see bottom-left panel of Figure 2). For this target, besides the -band image, we hence only acquired - and -band images, which have limited value. Observations were taken close to the meridian in order to minimise the atmospheric extinction. Seeing conditions were good (FWHM in the band). The data were reduced following standard procedures. After the bias subtraction, we applied twilight flats and then averaged background-subtracted exposures after scaling them to a common zero. A weight proportional to the background variance was adopted for the stacking.
Photometric calibrations were obtained by observing multiple photometric standard stars in the fields PG2213006 and PG0918+029 (Landolt, 1992). A photometric zero-point in AB magnitude was fitted together with a color term, assuming fixed air mass coefficients typical for the atmosphere in Mauna Kea (0.41, 0.12, 0.11 and 0.07 for , , , and ; Cooke et al., 2005). For galaxies with fluxes affected by the quasar emission in all filters besides -band, we set the color term to zero, assuming a flat continuum typical of star-forming galaxies. Uncertainties on the final zero-point are between and mag. for J211444-005533, while between and mag. for J073149+285449. The higher uncertainty for J073149+285449 is due to the intermediate step required to extrapolate the zero-point from shallow exposures acquired in photometric conditions. Corrections for Galactic extinction (Table 2) are computed from the far-IR dust map of Schlegel et al. (1998). The extinction in each filter is computed as , , , and (Cardelli et al., 1989). Under good seeing conditions, a total Keck-LRIS exposure time of min. enables a depth of mag. at 1 for a aperture in the -band images. This sensitivity allows the detection of a star formation rate of h M⊙ yr-1at 3 significance for a target, once we correct for IGM absorption (see Sect. 6). Exposure times and depths in each filter are listed in Table 2.
| Field | R.A. | Dec. | UT Date | Filter | Exp. Time | FWHM | 1 depth | E(B-V) |
|---|---|---|---|---|---|---|---|---|
| (J2000) | (J2000) | (s) | (′′) | (mag in ap.) | (mag) | |||
| J211444-005533 | 21:14:43.9 | -00:55:32.7 | 2008 Oct, 2nd | 6900 | 0.6 | 29.20 | 0.062 | |
| 6220 | 0.6 | 28.22 | ||||||
| 6220 | 0.6 | 27.99 | ||||||
| 6245 | 0.6 | 27.59 | ||||||
| J073149+285449 | 07:31:49.5 | +28:54:48.7 | 2009 Jan, 28th | 6900 | 0.7 | 28.88 | 0.055 | |
| 6360 | 0.8 | 27.83 | ||||||
| 6360 | 0.7 | 27.60 |
3.2 Photometry
Candidate host galaxies were selected from the -band images using the SExtractor package (Bertin & Arnouts, 1996). The detection threshold was set to with a minimum area of 3 pixels; these parameters force the inclusion of faint sources. We include in the final catalogue only galaxies within a projected angular distance of from the quasar (corresponding to a proper distance of h kpc at ). This search area is slightly larger than the maximum impact parameter of an absorber (), as inferred from absorption line statistics (Storrie-Lombardi & Wolfe, 2000). Since the region under consideration is small, we can inspect the segmentation maps to clean the catalogue of spurious detections or to include undetected sources, if any.
Integrated magnitudes are computed within Kron-like elliptical apertures. The background is subtracted locally, measuring the sky mean value in a square box 40 pixels on a side, centered on the target. All the pixels flagged as belonging to an object are first masked, and the sky variance is added to the Poisson error from the source to compute the uncertainty on the flux measurement. The final uncertainty also includes the error on the photometric calibration. To test the accuracy of the photometry, we have simulated Keck -band observations for different seeing conditions with the software SkyMake (Bertin, 2009). For good seeing (), we are able, on average, to recover of the total flux at 1 down to mag, while, for the faintest magnitudes ( mag), this fraction approaches 90%. In all cases, the total flux is fully recovered within significance. For worse seeing conditions (), the fraction of recovered flux drops slightly, as expected. Due to the increase in the uncertainty, the fraction of flux recovered at 1 remains constant.
An additional source of uncertainty comes from possible leakage of the quasar flux. Although for the H I column densities of the higher- LLSs, we conservatively test for any possible contamination from the quasar by comparing the surface brightness in a box centered on the quasar region with a local sky determination. The difference in surface brightness normalised to the sky variance is for J211444-005533 and for J073149+285449. Since these discrepancies are within a few percent of the sky variance in both cases, we conclude that the intervening LLSs are effective in fully blocking the light from the background quasars.
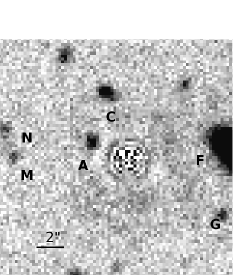
Table A6 in the appendix provides photometric information for objects detected at . However, we will conservatively consider only targets with in the band to be candidates for the DLA counterparts. The photometry in the , , and filters is mainly intended to provide colors for the photometric redshift analysis, rather than an accurate determination of the total flux. To alleviate color gradient effects and seeing differences, we compute the half-light radius () for our targets on a white image, produced by stacking the -, -, and -band images, where available. For all the galaxies detected in the band, we compute colors in circular apertures, multiples of . Some candidates lie at very small impact parameters to the quasar sightline and their colors need to be corrected for quasar contamination. Therefore, we model and subtract the quasar light-profile by fitting a 4th-order b-spline model (See Appendix A of Bolton et al., 2006). An example of the residual image in the band is presented in Figure 3 for J211444-005533. Although the result is quite satisfactory, the residuals may still affect the photometry and we choose to use only colors which are stable to the quasar subtraction. As already noted, the red-side images for the field of J073149+285449 were affected by instrumental problems; since we are not able to model the scattered light, we do not present colors for this field.
3.3 Impact parameter
The impact parameter is defined as the proper distance at the absorber redshift between the line of sight to the quasar and the center of the absorbing galaxy, the latter computed as the first moment of the light distribution. Since the quasar is completely absorbed in the band, we transfer the quasar position from the -band image to the -band image, using accurate relative astrometry. This is done by first fitting an astrometric solution over the -band image, using stars with known positions. We then fit a second astrometric solution to the -band image, using more than five reference objects, whose positions are extracted from the -band image and selected to be within from the quasar. Using this procedure, we achieve a high accuracy for the distances of objects close to the QSO sightline, better than that obtained from a single astrometric solution. The typical errors on the angular separation from this procedure are for J211444-005533 and for J073149+285449 (corresponding to 0.4 h kpc at ). Once the quasar position is known in the band, we compute the projected quasar-galaxy angular separation () for each candidate host galaxy. The angular distance is then converted into a physical separation , assuming comoving distances of h Mpc for J211444-005533 and h Mpc for J073149+285449. The impact parameters obtained for the different candidates are listed in Table 3. The lowest impact parameter for candidates in the J073149+285449 field is (i.e. 11.89 h kpc at , the DLA redshift), while that for systems in the J211444-005533 field is (i.e. 21.61 h kpc at ).
4 Identification of the DLA hosts
The -band images described in the previous section reveal a number of candidates for the DLA host galaxy within an angular distance of from the quasar. We wish to identify which, if any, of these is responsible for the observed damped absorption line. In studying absorption line systems, the impact parameter to the quasar sightline is often used to identify host candidates, following the general rule that the nearest object to the line of sight is likely to be the galaxy that causes the absorption. However, as will be shown later, the number of interlopers increases significantly in very deep searches; for this reason, a more quantitative treatment is needed. In this section, we discuss the two most straightforward methods to confirm that the DLA indeed arises in one of the candidate host galaxies. A more indirect, statistical approach to quantify the relative probability that one of the candidates gives rise to the DLA is described and discussed in the next section.
4.1 Spectroscopy
The only way to confirm a galaxy-absorber association for each system is through a spectroscopic detection of the galaxy, with an emission/absorption redshift consistent with the redshift of the DLA. For targets close to or aligned with the quasar, detecting Ly emission in the DLA trough is a simple way to measure the redshift of the host galaxy. The quasar light is blocked by the damped Ly absorption, and one can hence search for Ly emission from the same redshift with impunity (e.g. Møller et al., 2004). Previous searches for Ly emission were mostly limited by lack of knowledge of the location of the star-forming regions in the host galaxy, due to which it was not clear where to place (and how to orient) the slit for a spectroscopic search. This meant that a non-detection of Ly emission might arise simply because the brightest regions of the host galaxy were not covered by the chosen position and orientation of the slit. Crucially, our survey will directly yield the positions of the candidate host galaxies, allowing follow-up spectroscopic studies to correctly position slits on all candidates. Note that the detection of other spectral lines at optical wavelengths is likely to be affected by the bright quasar continuum. However, the H transition, redshifted into the near-IR waveband for DLAs at , is the other plausible transition by which the galaxy redshift can be measured.
Beside Ly (or H) emission, the technique adopted here allows an alternative route to confirm or at least constrain the galaxy redshift. Figure 1 shows that the QSO contamination disappears blueward of the Lyman break of the higher-redshift LLS; any continuum detected in this part of spectrum comes only from foreground objects that are in the slit. Therefore, we can establish the redshift of the candidate by identifying other absorption features such as metal lines. Furthermore, a less precise but still useful redshift determination can be obtained by searching for a signature of the galaxy Lyman limit, if visible redward to the atmospheric cut-off.
A limitation of the above spectroscopic methods is that dust extinction can suppress the Ly or FUV emission. Also, our poor knowledge on the escape fraction of Ly photons makes it very difficult to estimate the expected Ly flux at a given UV luminosity (see for example Matsuda et al., 2004). In addition, the detection of the galaxy continuum in spectra can only be obtained within a reasonable integration time ( hours at a 10m-class telescope) for targets brighter than 25 or 26 magnitudes. As discussed in the introduction, simulations (and some observational studies in the literature) suggest that DLAs may be associated with even fainter objects. Finally, the H line is only observable from ground-based facilities from a narrow redshift range. For these reasons, it may not be possible to spectroscopically confirm all candidate host galaxies and different approaches are required.
| ID | ID | |||||||
|---|---|---|---|---|---|---|---|---|
| () | (kpc) | () | (kpc) | |||||
| J211444-005533 | J073149+285449 | |||||||
| A | 2.86 | 21.61 | 0.19 | A | 1.54 | 11.89 | 0.06 | |
| B | 3.27 | 24.69 | 0.56 | B | 2.87 | 22.14 | 0.28 | |
| C | 5.10 | 38.50 | 0.51 | C | 4.54 | 35.01 | 0.82 | |
| D | 5.07 | 38.30 | 0.97 | D | 4.33 | 33.45 | 0.29 | |
| E | 7.46 | 56.34 | 0.98 | E | 4.74 | 36.59 | 0.62 | |
| F | 8.67 | 65.43 | 0.08 | F | 6.33 | 48.86 | 0.38 | |
| G | 7.93 | 59.85 | 0.82 | G | 10.46 | 80.76 | 1.00 | |
| H | 10.25 | 77.40 | 0.82 | H | 12.69 | 97.92 | 0.95 | |
| I | 9.61 | 72.52 | 0.58 | I | 12.38 | 95.55 | 0.18 | |
| L | 8.41 | 63.46 | 1.00 | L | 8.59 | 66.30 | 0.98 | |
| M | 8.35 | 63.07 | 0.78 | M | 9.92 | 76.56 | 1.00 | |
| N | 9.15 | 69.07 | 0.89 | N | 12.69 | 97.94 | 1.00 | |
| O | 5.12 | 38.64 | 0.99 | - | - | - | - | |
| P | 12.04 | 90.87 | 1.00 | - | - | - | - | |
| Q | 11.89 | 89.79 | 1.00 | - | - | - | - | |
| R | 12.03 | 90.78 | 1.00 | - | - | - | - | |
| S | 12.95 | 97.75 | 0.76 | - | - | - | - | |
| T | 12.15 | 91.73 | 1.00 | - | - | - | - | |
4.2 Photometric redshift
A second method to determine the redshifts of the candidate host galaxies is via a photometric redshift (“photo-”) estimate. The advantage of this technique over spectroscopy is that it can also be used for faint galaxies. Unfortunately, there are two main issues that affect the photo- analysis. First, quasar contamination does not allow a robust color estimate for targets at low impact parameter, i.e. those more likely to be associated with the DLA (see below). For this reason, the photo- method can only be used to estimate the redshift for targets at large projected distances from the quasar. Second, photometry in 4 optical filters covers only a narrow range of the blue part of the spectral energy distribution (SED) of a galaxy. This significantly increases the number of catastrophic outliers (e.g. Hildebrandt et al., 2008), making the results less reliable. It is worth mentioning that one can try to constrain the redshift through photometry by combining our ground-based -band imaging with HST UV observations in narrow- or medium-band filters.
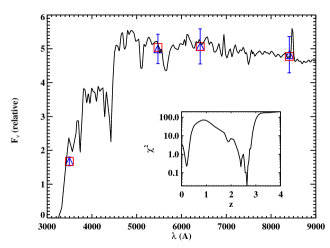
As noted earlier, instrumental problems caused colors for the galaxies in the field of J073149+285449 to be contaminated by scattered light from the quasar, making these colors unreliable for a photo- analysis. For the J211444-005533 field, we have computed photometric redshifts for the candidate host galaxies using the eazy code (Brammer et al., 2008) and an SED template library from Grazian et al. (2006). The fit was performed on a grid of redshifts ranging from 0.01 to 4 with a resolution , including the effects of IGM absorption. Although the code allows linear combinations of SEDs, we used individual templates, without priors on the galaxy magnitude. We initially focused on targets A and C in the J211444-005533 field since these are the two galaxies with lowest impact parameters to the quasar line of sight. For J211444-005533-C, the best-fit redshift is . The SED, the synthetic fluxes (red square), and the observed fluxes (blue triangles) are shown in Figure 4, with the distribution as a function of redshift displayed in the inset. No other significant relative minima are found besides the two in the same redshift interval. Conversely, for target A, the best fit is at , but a second minimum is found at , making this redshift determination less secure. Unfortunately, the limited number of available filters means that neither redshift can be constrained at a high confidence level (C.L.). In fact, although J211444-005533-A and J211444-005533-C appear to be located at lower redshifts than the DLA (), we cannot rule out the galaxy-absorber correspondence at C.L. for either candidate; this illustrates the problems with the photo- approach, and emphasizes the need for spectroscopic confirmation. Among the other galaxies with color determinations in the field of J211444-005533, we do not find any significant DLA candidates using the photo- approach.
5 Statistical approaches
As discussed, spectroscopy is required to securely identify the host galaxies of DLAs. However, besides being an expensive observational task, it may even be unsuccessful in some cases. Statistical approaches to quantify the probability that a given galaxy is associated with a DLA are therefore valuable. Similar to the identification of optical counterparts for radio and X-ray sources, we would like to estimate the probability that a given galaxy is associated with a DLA, given some observables (e.g. the impact parameter, the H I column density, etc). We will use two different treatments for this purpose: (i) a frequentist approach, used to test whether a candidate is an interloper, and (ii) a Bayesian estimator used to assign a probability that a candidate is actually associated with the DLA. Considered jointly, they can help to decide which galaxy (if any) is the DLA host, without the limitations imposed by color determinations or galaxy brightness.
We stress that we do not aim to provide a secure galaxy identification by this approach. Nevertheless, this technique is useful to pre-select the best candidates for spectroscopic follow-up. Also, when the present and future searches will yield a significant number of spectroscopically-confirmed galaxies, one can refine the statistical methods introduced here to select a bona fide DLA sample, useful to study the properties of the DLA population rather than those for individual detections.
5.1 Frequentist approach
The frequentist method is based on Poisson statistics applied to number counts of the surface density of galaxies. For each candidate with an impact parameter and apparent magnitude , we can compute the probability of detecting one interloper in the parameter space (,). Low values for this probability indicate that the candidate is unlikely to be an unrelated object, suggesting that it is likely to be the DLA host or the host of a second absorber at lower redshift along the sightline.
Given the surface number density of objects brighter than a fixed magnitude , the mean number of interlopers expected for is
| (3) |
and the probability to detect at least one galaxy is (Downes et al., 1986)
| (4) |
If , it is unlikely that the candidate corresponds to an interloper. However, as widely discussed in the literature (e.g. Downes et al., 1986; Sutherland & Saunders, 1992), the probability of the candidate being the right identification does not follow immediately as . In fact, when multiple candidates lie within the search radius, the probability for each object is computed independently, leading to the ill-defined case in which the total probability for all candidates is not unity. The correct probability of a galaxy-absorber association comes from a Bayesian treatment (see next section).
For , we use galaxy number counts derived by Grazian et al. (2009) (their Table 1; see also Rafelski et al., 2009) from -band imaging in a wide sky region ( sq. deg.), down to AB mag.; this limit matches the depth of our survey. In Figure 5, we plot the dependence of on the impact parameter, derived from Eq. (4) for different magnitude cuts. This analysis outlines how two competing effects play a role: depth and confusion. In fact, deep imaging is desirable to increase the chance of detecting absorber counterparts, but at the same time the number density of interlopers increases steeply, introducing significant confusion even at low impact parameters. Specifically, deep surveys, to magnitudes fainter than mag., have a significant probability (%) of finding interlopers at impact parameters . This result stresses the need for a quantitative treatment to identify DLAs: simply assuming the closest candidate to the quasar sightline to be the counterpart can lead to false detections. Note, however, that the figure also shows that this assumption is likely to be a good one for (corresponding to a physical distance of kpc at ).

Table 3 lists the frequentist probability for all candidates in the fields of J211444-005533 and J073149+285449. In the latter field, candidate-A has a low probability of being an interloper (), making it the most likely candidate for the DLA host. Conversely, for J211444-005533, the minimum probability () is for candidate-F, a bright galaxy at (as measured in the SDSS and confirmed by our photometric redshift analysis), while the next lowest probability of being an interloper (, for candidate-A) is non-negligible. This case suggests that the frequentist analysis needs to be complemented with additional priors on the impact parameter, in the absence of spectroscopic information. In fact, as we will show in the next section, it is quite unlikely that luminous DLA galaxies lie at very large distances ( h kpc for J211444-005533-F) from the quasar sightline.
5.2 Bayesian approach
Although independent of any priors, the frequentist approach does not yield a relative probability that an identification is correct, nor does it take into account the fact that several candidates can be considered for a single DLA. Both of these can be achieved by a Bayesian treatment. The present section is organised as follows: after a review of the basic Bayesian formalism, we propose a method that can be applied to identify the host galaxies of generic absorption line systems (ALSs), such as Mg II absorbers, LLSs or DLAs. We then derive specific priors on the impact parameters of DLAs based on theory and indirect observational constraints. In the end, after testing this procedure on a sample of six spectroscopically-confirmed DLA hosts, we apply the method to compute probabilities for our targets in the fields of J211444-005533 and J073149+285449.
| Type | ||||
|---|---|---|---|---|
| OB0 | 0.0640.001 | 0.370.02 | 0.0570.009 | 1.290.05 |
| SB3 | 0.234 | 0.68 | 0.37 | 1.05 |
| OB2 | 0.112 | 0.37 | 0.10 | 1.29 |
| OB2.5 | 0.138 | 0.37 | 0.12 | 1.29 |
| OB3 | 0.166 | 0.37 | 0.14 | 1.29 |
5.2.1 Formalism
 |
 |
Different approaches based on Bayes’ theorem have been developed to identify the optical counterparts of X-ray or radio sources and, more recently, sub-mm sources. Due to the large number of works focused on this topic, varying terminology has been introduced over the past years. To make explicit our choice, we will review the fundamental concepts at the base of this method, mostly following Rutledge et al. (2000). Further, we also optimize the procedure for the issue addressed in this paper, namely the identification of the galaxy counterparts of high- absorbers.
For a group of candidates, the likelihood ratio is defined as the product of the normalised probability distribution functions (PDFs) of some properties of the ALSs to those of random foreground666Due to the design of our experiment, objects at redshifts higher than the LLS one cannot be detected in the proximity of the quasar. Therefore we define interlopers as foreground galaxies, even though this is not entirely appropriate for objects at redshifts between those of the DLA and the LLS. galaxies. The useful physical quantities are various observable parameters, including magnitude, impact parameter, H I column density, metal line equivalent widths, and kinematics. However, while the inclusion of many properties enables a narrower distribution of the likelihood ratio which restricts the number of false detections, this method is sensitive to the functional form adopted for . To avoid subtle biases, it is hence better to restrict the number of priors to only well-known quantities. Here we consider a simple case in which only priors on the impact parameter and magnitude distribution are assumed.
Following Sutherland & Saunders (1992), we define as
| (5) |
is the ratio of the probability of detecting a real counterpart at an impact parameter and magnitude
| (6) |
to the probability of detecting a random foreground object
| (7) |
where gives the distribution of galaxy number counts per unit area. This last quantity is not related to the nature of any particular ALS, and it can be derived empirically from deep imaging; as with the frequentist approach, we use the result of Grazian et al. (2009).
According to Bayes’ theorem, the reliability of a correct identification is
| (8) |
which is the ratio of the probability of true associations to the sum of true and false associations. expresses the probability that a candidate with a given is the correct identification and not an unrelated foreground object. As pointed out by Sutherland & Saunders (1992), equation (8) does not account for the fact that multiple candidates can be considered for a single absorber. In other words, a high value of indicates that the considered candidate is an unusual source compared to the foreground galaxies, but frequently high reliability is assigned to more than one object. Eq. (8) provides no insight to solve this ambiguity.
To add this missing information, we introduce two other statistics. The first one is the probability that none of the possible candidates is associated with the ALS:
| (9) |
The second is the probability that the -th source is uniquely associated with the ALS:
| (10) |
In the previous two equations, is a normalization factor that ensures that :
| (11) |
In the end, Eq. (10) is the quantity that will be used to identify likely galaxy-absorber associations.
Before we apply this procedure to the case of DLAs, we highlight a possible problem that can affect the computation of with Eq. (5). For ALS studies, the form of the prior has to be chosen carefully. Properties of ALSs in emission are currently poorly constrained and very little or nothing can be inferred about from observations. Simulations can only partially help, especially because the star formation rate and stellar emission here are mostly computed based on semi-empirical prescriptions; this implies that any priors derived from simulations may not be reliable. Conversely, the use of the observed luminosity functions of high-redshift galaxies might imply a strong a priori constraint on the nature of the ALS counterparts. Furthermore, although with significant noise, can be obtained in a statistical sense by subtracting the magnitude distribution of galaxies in fields without DLAs from that in fields with known absorbers. This procedure requires a significant number of fields for convergence, but these observations are currently unavailable. Without a reliable estimate for , we suggest reducing the number of priors in the likelihood ratio, rather than adopting an inappropriate choice that might introduce uncontrolled biases. Note that one of the goals of our survey is to characterise the star formation properties of DLAs; incorrect information on the magnitude prior might have significant implications for the final result.
To remove from the likelihood ratio, following Sutherland & Saunders (1992), we modify the definition of the likelihood ratio by marginalising Eq. (5) over . We define as
| (12) |
where
| (13) |
and
| (14) |
are the priors and , integrated up to the limiting magnitude . Both and are constants; the fact that is unknown implies that the likelihood ratio has now an unspecified normalisation. Therefore, we adopt an operational definition of Eq. (8) as the probability of not obtaining randomly for the -th candidate (Gilmour et al., 2007). The idea behind this procedure is to compute a distribution for using several sets of interlopers (). High reliability is assigned to candidates whose exceeds typical values found among interlopers. Formally, this is granted by
| (15) |
where is the number of interlopers with a likelihood ratio that exceeds . should be large enough to guarantee the convergence of . Because the condition in Eq. (15) is satisfied modulo an arbitrary positive constant, the final reliability is independent of and . Since the likelihood ratio distribution is computed directly from the imaging (see Sect. 5.2.3), this procedure offers the additional advantage of treating the limiting magnitudes self consistently. The downside of this empirical approach is that we lose knowledge on , a well-defined quantity. However, we complement the Bayesian treatment with the frequentist approach, which includes the number count statistics.
 |
 |
5.2.2 Impact parameter modelling
Considering the specific case of DLAs, the only unspecified quantity at this point is the prior on the impact parameter . This can be derived from observations if a sample of spectroscopically-confirmed objects is available. Unfortunately, the hosts of only six DLAs at have so far been confirmed with spectroscopy, implying that it is not currently possible to use the observed impact parameters to constrain . We will hence indirectly derive a prior on ; the downside is that the final derived probabilities will carry additional uncertainty. In the future, an updated form of derived directly from observations can provide a more reliable prior for statistical analysis.
Here we introduce and compare two different priors. The first one is based on the CDM cosmology framework, in which galaxies assemble through a series of minor and major mergers. During this process, gas is thought to be distributed in clumps and filaments which do not necessarily resemble low-redshift disks. In addition, gas in individual halos can cool to form a disk whose size follows the size evolution of the dark matter halo. For this reason, we refer to this prior as “evolutionary”. Conversely, our second prior is based on the observational results of Prochaska & Wolfe (2009), who used a large DLA sample ( DLAs) to find that the shape of the frequency distribution of projected H I column densities does not evolve significantly with time at and also matches the one at . This implies that the convolution of the projected H I surface density distribution in individual DLAs, their sizes and number density is preserved over Gyr. A stronger interpretation presented by Prochaska & Wolfe (2009) is that galaxies have H I disks whose distribution matches that of present-day spirals, a result that in turn suggests how H I in individual galaxies could be not especially sensitive to the underlying dark matter distribution. Therefore, we refer to this second prior as “non-evolutionary”. Further investigations are required to confirm or disprove this hypothesis, but for now we note that the non-evolutionary prior is also useful to account for more extended H I than the one found inside simulated disks at high redshift.
We construct the non-evolutionary prior by simulating the quasar experiment, using sightlines through H I-21cm maps of local galaxies to reproduce the DLAs seen against background quasars (c.f. Zwaan et al., 2005a). For this purpose, we use H I-21cm maps from the THINGS survey (Walter et al., 2008) which includes 22 spirals and 12 Sm/dIrr galaxies at a resolution of . For each galaxy, we measure the local H I column density by averaging the signal within a resolution element in random positions. We re-project the observed N to a variety of inclinations, thus accounting for the fact that face-on disks are more likely to be selected in absorption than edge-on ones. For H I column densities above the DLA limit, we then compute by combining all the different sightlines for each galaxy. To reproduce a population of galaxies, we weight each object in the THINGS sample with the H I mass function (HIMF) (Zwaan et al., 2005b) and the sky covering factor . This is computed assuming that the H I radius scales with the H I mass (Verheijen, 2001). We also include a correction factor proportional to the number of galaxies () in a given mass range (that defines bins) to compensate for the fact that dwarf galaxies are undersampled in the THINGS survey with respect to spirals. Combining all of these elements, we derive with
| (16) |
It is worth mentioning that high-redshift DLAs do not probe exclusively sight-lines similar to the ones through local disks as seen in 21cm. In fact, highly ionized species (e.g. N V) most likely associated with the halo are sometimes observed (Fox et al., 2009). However, the use of local 21cm maps seems an appropriate analogy to model H I-rich galaxies at high redshift.
In the left panel of Figure 6, we show (dashed histogram) from one realisation of the above equation (16). To model this distribution, we fit a function of the form
| (17) |
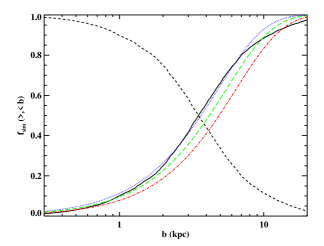
This analytic formula is designed to reproduce for local galaxies: the power law accounts for the increasing probability of intersecting a disk at larger radii, while the exponential term accounts for the radial decay of the H I surface density profiles. The solid line shows the fit computed over 50 such experiments; the derived parameters and statistical uncertainties for this non-evolution model (OB0) are quoted in Table 4. It is reassuring that, although we are using a smaller sample, resembles qualitatively the distribution derived by Zwaan et al. (2005a). In the right panel of Figure 6, we plot the cumulative distributions (dashed line) and (solid line), obtained from the OB0 model. From this analysis, we infer that of DLAs at are expected within from the quasar with the maximum probability located around . Since DLAs are expected with low probability at impact parameters h kpc ( at ), our search radius of seems large enough to guarantee sufficient sky coverage during our candidate selection.
Turing our attention to the evolutionary prior, we derive , using a cosmologically-weighted sample of DLAs drawn from the SPH simulation of Pontzen et al. (2009). This is similar to the simulation presented in Governato et al. (2007) and analysed in Pontzen et al. (2008), but at higher resolution. According to these authors, the impact parameter is defined as the projected distance to the minimum of the dark-matter halo potential. This is not an observable quantity, but it is reasonable to assume that high star formation occurs when the gas funnels towards the center of the halo, so that this definition of the impact parameter does not yield different results from our observational one. It is useful to note that by selecting individual halos, we are considering the gas distribution inside individual galaxies, with no distinction between the central galaxy and satellites (see Sect. 5.2.3).
The dashed histogram in the left panel of Figure 7 shows from a realisation of DLAs at from the SPH simulations of Pontzen et al. (2009). We model (solid line) using the fitting formula in Eq. (17); although designed for local galaxies, this function seems flexible enough to describe also the shape of in high-redshift CDM simulations. The only discrepancy with the data arises at high . The fitted parameters for this evolutionary model (SB3) are quoted in Table 4. In the right panel of Figure 7, we plot the cumulative distributions (dashed line) and (solid line), as obtained directly from the data. From these simulations, we deduce that a DLA can be found with probability within an impact parameter of at . The maximum probability is located around , roughly a factor of 2 less than that predicted in a non-evolutionary model. These low values stress the advantage of our drop-out technique in observations limited by seeing. From a comparison of with the rate of incidence derived by Nagamine et al. (2007), we note a similarity with their no-wind run, although our distribution exhibits a narrower tail.
The major difference between models OB0 and SB3 resides in the fact that gas follows the dark-matter potential more closely in simulations than in the non-evolving model, which assumes that the gas distribution does not change with redshift. This is reflected in a distribution for OB0 that is broader and peaks at higher impact parameters than the one for SB3. To extrapolate the simulation results to , we scale the H I distribution observed at following the size evolution of dark matter halos as a function of redshift. Starting with H I-21cm maps of local galaxies, we repeat the quasar experiment as for OB0, but this time accounting for a redshift dependence of . In this toy model, we keep the observed surface density distribution constant, assuming that the total H I mass in the halo increases due to gas accretion onto the disk. In the literature, several scaling relations for the galaxy radius as a function of the redshift can be found, from both theoretical arguments and observations of high- galaxies. In our model, we adopt (Bouwens et al., 2004) for . This is in agreement with Papovich et al. (2005) who show that the size distribution of galaxies at is broadly consistent with that observed in the local Universe. This particular choice enables us to reproduce almost perfectly the SM3 model, starting from H I-21cm maps of galaxies. This agreement is shown in the right panel of Figure 7, where the extrapolated model (OB3) is shown with a blue dotted line. The only significant discrepancy arises for h kpc. The figure also includes the cumulative distribution at (OB2.5) and (OB2) (green long-dashed and red dash-dotted lines, respectively). The parameters of the analytic expression (17) are listed in Table 4.
Being able to match the simulations with an ad hoc may not seem an interesting result. However, other scaling relations (e.g. Ferguson et al., 2004) are equally able to reproduce a distribution at least consistent with the simulations. We speculate that there might be a more profound reason for this agreement: gas clumps re-assemble in growing dark matter halos without a drastic change in the radial distribution of the H I column density since or even beyond. Further investigations on the gas distribution in SPH simulations are desirable to investigate this hypothesis. While accounting for disk evolution, we have assumed that the weighting procedure defined in Eq. (16) does not change as a function of redshift. Note that the impact parameter distribution is a normalised quantity, and is hence not much affected by any mass-independent variation in the number density of H I galaxies or in the covering factor . Conversely, a change in the slope of the HIMF may alter the relative contribution of massive and dwarf galaxies, altering . No direct determinations of the HIMF as a function of redshift are currently available, and we hence keep the slope constant, consistent with the semi-analytic model of Obreschkow & Rawlings (2009) for (see their figure 1).
5.2.3 Implementation, procedure test and discussion
Once the priors on the impact parameter are known, we test this Bayesian procedure using a sample of six spectroscopically-confirmed high-redshift DLAs (see Appendix B). Although heterogeneous, this sample provides the only present observational test. To evaluate the reliability with Eq. (15), we need a realisation of for foreground objects. For this purpose, we compute for all the galaxies detected within of a random position in a field where no absorbers are known. We repeat this procedure for several random positions to guarantee the convergence of . Since we restrict to a searching area , we implicitly impose the condition for . This well-defined boundary prevents probability from flowing towards high impact parameters. Note that, if is allowed to increase to arbitrarily large radii, the number of interlopers at large impact parameters with small but non-zero will increase accordingly. Therefore, a non-zero reliability will be assigned also to DLA candidates with a low likelihood ratio, effectively decreasing for the most likely candidates. This issue is bypassed by limiting the search radius to .
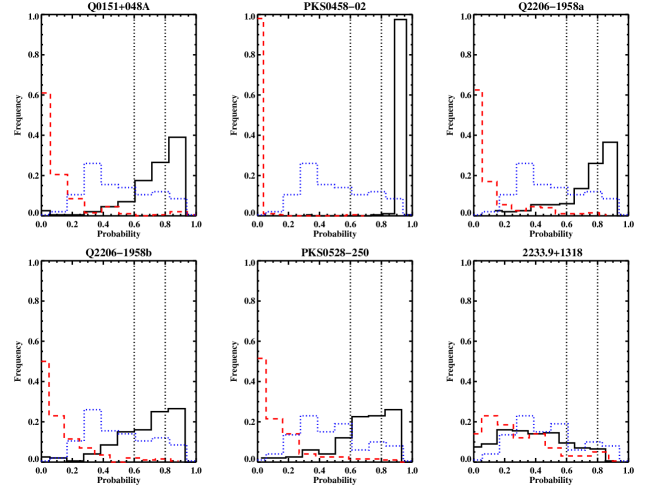
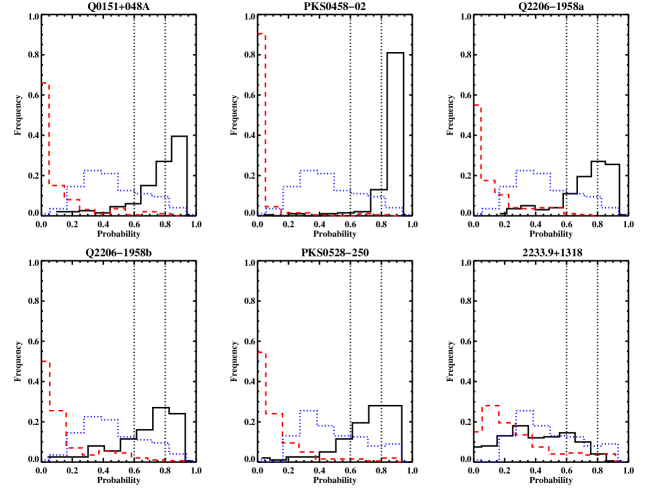
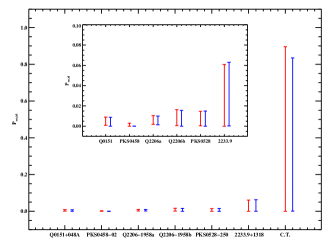
After this, we extract all the sources detected within from a random position in a field not hosting any known DLAs. Then, we add to this list of interlopers a known DLA at its measured impact parameter; finally, we compute and for all of these candidates using both the evolutionary (SB3, OB2.5 and OB2) and the non-evolutionary (OB0) priors. We repeat this test 200 times for each confirmed DLA. To estimate the number of interlopers that are incorrectly identified as DLAs, we also run a control test in which only foreground sources are included. The results are in Figures 8 and 9 where we compare results for the evolutionary and non-evolutionary priors, respectively. For each known DLA, the probability assigned to the correct galaxy counterpart is indicated by a solid line, while that assigned to the interloper with the highest reliability is shown with a red dashed line. Finally, we display the results of the control test in fields without DLAs: the blue dotted line represents the probability assigned to the foreground galaxy with highest reliability when only interlopers have been detected.
Several pieces of useful information can be derived from the plotted distributions. First, looking at the six panels in Figures 8 and 9, it is evident that in all but one case our procedure assigns the highest probability to the correct candidate DLA host. We therefore conclude that the Bayesian method is successful in finding the right galaxy-absorber association. The only evident failure is for the target 2233.9+1318, an SLLS with N cm-2. As shown by Zwaan et al. (2005a) (see also Figure 13), the impact parameter is a decreasing function of the H I column density; using a prior derived for absorbers with N cm-2 may hence underestimate the quasar-galaxy separation for absorbers with lower H I column densities by more than a factor of 2. Second, it appears that the evolutionary and the non-evolutionary priors reproduce similar values of probability. In fact, the relevant feature that distinguishes the two models is the location of the maximum. From the definition of Eq. (15), similar values of are expected with both priors when candidates lie on the tail of the distribution.
It is also useful to note that the probability associated with the interlopers with highest (red dashed line) peaks at low . This shows that Eq. (10) distinguishes between targets that share a high reliability. Finally, considering (Figure 10), we notice that this statistic is not particularly useful in deep imaging. In fact, although it behaves as expected for the fields with a known absorbers, for our control test in which only interlopers are included, exhibits a highly dispersed distribution with a mean value around 0.1. This is not exceedingly higher, although a factor of 10 larger, than the mean values derived from the other six experiments where DLAs are present. This is mostly due to the fact that very deep fields have a high number density of interlopers. When the number of candidates is large, even if no DLAs are detected in the field, can increase enough to make drop accordingly (since ).
The fact that is not a useful indicator makes our analysis slightly more complicated. Our test shows that whenever a DLA is detectable in the field, the Bayesian procedure is able to correctly identify it (as shown by the comparison between solid black and dashed red histograms). However, if the DLA is too faint to be detected, interlopers may be incorrectly identified as the absorber, without any warnings from . We quantify the number of spurious identifications by using our control test. For this purpose, we use the frequency with which high probability is assigned to interlopers in fields without DLAs. This provides an estimate of the contamination rate in our survey. Since the control test assumes that no DLAs are in the fields, this rate is somewhat overly-pessimistic. Finally, we note that our control test is not formally included in the Bayesian procedure, and the contamination rate we assume does not contribute to the probability . Therefore, for a given probability limit on , the frequency with which a DLA is correctly identified (i.e., the number of trials for which in the solid histogram) and the frequency with which an interloper is incorrectly identified as the absorber (i.e., the number of trials for which in the dotted histogram) do not add up to one.
Nevertheless, these rates provide two extreme cases, useful to estimate the completeness and contamination in a bona-fide DLA sample derived with statistics. Our tests indicate that for galaxy-absorber associations with Bayesian probability the DLA galaxy is correctly identified of the time, whereas interlopers exceed only of the time. These rates have been computed excluding the SLLS towards quasar 2233.9+1318, not representative of the DLA population777Due to the limited sample available, one might be concerned that these values are driven by the results for DLA PKS0458-02. However, even if we do not include this object, we find that still 55% of the galaxies are correctly identified, showing that the mean is not strongly dominated by this system.. This means that such criteria should correctly identify 60 counterparts out of 100 fields with detectable DLAs. Conversely, in 100 fields that do not show a DLA galaxy, these criteria would result in 15 interlopers being incorrectly classified as DLAs. If we weaken the probability limit down to , our tests show that the 5 DLA fields have on average of the time whereas interlopers exceed typically of the time.
Turning to the discussion, we should emphasis that this statistical method is based on a set of assumptions that may not hold for all the sight-lines under consideration. We wish to discuss some of them in more details. First, the fact that we are considering a single galaxy-absorber association at a time can pose a limitation when a group of galaxies is located at the absorber redshift (e.g. towards Q22061958; Weatherley et al., 2005). In fact, our analysis will favor only one object and reject the other as interlopers. Conversely, clustering around the quasar (Hennawi & Prochaska, 2007) and the QSO host galaxy itself do not affect our analysis since UV light from these galaxies is absorbed by the intervening LLS, as long as the systems are covered in projection by this absorber.
In addition, we cannot rule out with this statistical method that the detected objects are not associated with other intervening absorbers at . Indeed, towards QSO J211444-005533 we detect two Mg II systems at and and a C IV system at . Similarly, there are two Mg II systems at and , towards J073149+285449. This source of confusion is partially alleviated by the fact that the priors on the impact parameters for Mg II peak at larger values. In fact, both observations and simulations (e.g. Kacprzak et al., 2009; Chen et al., 2010) show that Mg II are frequently (but not uniquely) found at kpc.
As for the choice of the non-evolutionary prior, simulations show that massive halos can host multiple gas-rich satellites (e.g. Ceverino et al., 2009). In magnitude-limited surveys, only the brightest systems (central galaxies) will be detected, but also the satellites can give rise to an absorption line. Therefore, the most valuable quantity to set the priors may be the distance from each gas clump to the brightest star-forming center in the halo. In this configuration, a prior will exhibit a more extended tail towards larger impact parameters than the one here presented. Future works will address this issue. For now, we caution that we will probe only those DLAs that originate within the brightest central star-forming centers. Indeed, the inclusion of larger impact parameters in this statistical procedure is not a trivial task: the number of foreground sources is a steeply increasing function of the distance from the quasar and the high degree of confusion is not optimal to identify this particular class of DLAs via statistics. Integral-field or multi-object spectroscopy down to faint magnitudes becomes essential.
Finally, we already mentioned a few times that a set of spectroscopically confirmed DLAs can be used to improve this statistical procedure. In order to establish how large a sample should be to determine , we extract randomly a subset of DLAs from the SPH simulation. While a large number of DLAs ( 50-100 objects) is required to precisely reconstruct , a smaller sample ( 20-30 objects) is sufficient to constrain the peak and the tail of the impact parameter distribution. Therefore, the present and other ongoing attempts to enlarge the sample of known DLAs may provide soon enough objects to improve this Bayesian procedure.
| ID | ID | ||||||||||
|---|---|---|---|---|---|---|---|---|---|---|---|
| (kpc) | (kpc) | ||||||||||
| J211444-005533 | J073149+285449 | ||||||||||
| A | 21.61 | 0.91 | 0.35 | 0.91 | 0.35 | A | 11.89 | 0.98 | 0.61 | 0.98 | 0.61 |
| B | 24.69 | 0.89 | 0.26 | 0.89 | 0.26 | B | 22.14 | 0.92 | 0.17 | 0.92 | 0.17 |
| C | 38.50 | 0.73 | 0.09 | 0.73 | 0.09 | C | 35.01 | 0.80 | 0.06 | 0.80 | 0.04 |
| D | 38.30 | 0.73 | 0.09 | 0.73 | 0.09 | D | 33.45 | 0.82 | 0.07 | 0.82 | 0.07 |
| E | 56.34 | 0.43 | 0.02 | 0.43 | 0.02 | E | 36.59 | 0.78 | 0.05 | 0.78 | 0.05 |
| F | 65.43 | 0.23 | 0.01 | 0.23 | 0.01 | F | 48.86 | 0.60 | 0.02 | 0.61 | 0.02 |
| G | 59.85 | 0.35 | 0.02 | 0.35 | 0.02 | G | 80.76 | 0.00 | 0.00 | 0.00 | 0.00 |
| H | 77.40 | 0.00 | 0.00 | 0.00 | 0.00 | H | 97.92 | 0.00 | 0.00 | 0.00 | 0.00 |
| I | 72.52 | 0.06 | 0.00 | 0.06 | 0.00 | I | 95.55 | 0.00 | 0.00 | 0.00 | 0.00 |
| L | 63.46 | 0.27 | 0.01 | 0.28 | 0.01 | L | 66.30 | 0.28 | 0.01 | 0.28 | 0.01 |
| M | 63.07 | 0.28 | 0.01 | 0.29 | 0.01 | M | 76.56 | 0.05 | 0.00 | 0.05 | 0.00 |
| N | 69.07 | 0.14 | 0.01 | 0.15 | 0.01 | N | 97.94 | 0.00 | 0.00 | 0.00 | 0.00 |
| O | 38.64 | 0.73 | 0.09 | 0.73 | 0.09 | - | - | - | - | - | - |
| P | 90.87 | 0.00 | 0.00 | 0.00 | 0.00 | - | - | - | - | - | - |
| Q | 89.79 | 0.00 | 0.00 | 0.00 | 0.00 | - | - | - | - | - | - |
| R | 90.78 | 0.00 | 0.00 | 0.00 | 0.00 | - | - | - | - | - | - |
| S | 97.75 | 0.00 | 0.00 | 0.00 | 0.00 | - | - | - | - | - | - |
| T | 91.73 | 0.00 | 0.00 | 0.00 | 0.00 | - | - | - | - | - | - |
5.3 Results for J211444-005533 and J073149+285449
Before we compute for our candidates, we remark on two points that have already been discussed. (1) Being a statistical analysis, this classification is subject to individual failures and carries all the assumptions and uncertainty related to the choice of the priors. (2) Due to the nature of our experiment, objects detected in the band images at low impact parameters are at . Therefore, the high-redshift LLS and the QSO host galaxy are not included in this analysis and they do not contribute to additional confusion. Additional confusion can arise from other absorbers (e.g. Mg II) in the line of sight.
Bearing these caveats in mind, but encouraged by the positive results from our tests, we apply the above statistical procedure to the galaxies detected in the fields of J211444-005533 and J073149+285449. Reliabilities and probabilities of galaxy-absorber association are listed in Table 5. For the DLA towards J211444-005533, we use the templates OB0 and SB3, while for the DLA towards J073149+285449, we adopt OB0 and OB2.5. For the DLA towards J211444-005533, our statistics indicate that none of the detected targets has a probability greater than 35% of being associated with the DLA. Conversely, in the case of J073149+285449, there is a probability of that object A is associated with the DLA. Adding the fact that the probability of being an interloper is less than 10% from the frequentist analysis, we consider J073149+285449-A an excellent candidate for the DLA host galaxy. We are presently trying to confirm the association in J073149+285449 through spectroscopy in the Ly line and UV continuum.
6 SFR calibration
The metal lines observed in DLAs support the idea that star formation activity has occurred at least previously in these objects, enriching the surrounding gas (e.g. Wolfe et al., 2003). A key issue in DLA studies is the star formation rate in these objects and its distribution across the ISM of the host galaxy.
At , the -band filter covers the rest frame wavelengths Å, where a galaxy’s emission is expected to be dominated by massive () and short-lived ( yr) stars. To recover the emitted rest-frame UV flux , we apply a simple K-correction to the observed flux under the assumption that the SED is not a sensitive function of wavelength in the FUV region:
| (18) |
where is the luminosity distance to . We also correct for absorption by the IGM, using an updated calculation of the effective opacity computed from a recent determination of (Prochaska et al., 2009) over a large interval of H I column densities ( cm-2) at .
We compute the transmission to FUV photons considering the first 35 lines in the Lyman series as:
| (19) |
where the effective opacity is defined by
| (20) |
with the optical depth of an individual cloud at the frequency computed for the -th element of the Lyman series with frequency . To relate derived at by Prochaska et al. (2009) to at an arbitrary redshift, we assume
| (21) |
where
| (22) |
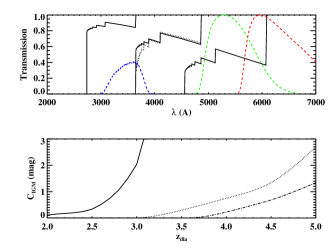
In Eq. (21), we model the redshift evolution in the interval with a density dependent power law index. Specifically, we assume for N cm-2 (Kim et al., 2002), for N cm-2 (Prochaska et al., 2009), for N cm-2 (Rao et al., 2006; O’Meara et al., 2007), and for N cm-2 (Rao et al., 2006). A plot of the IGM transmission at redshifts 2, 3 and 4 is presented in the top panel of Figure 11 (solid lines), together with the (blue dashed line), (green dashed line) and (red dashed line) LRIS filter transmission curves. Comparing the results of our calculation with those from a similar analysis by Madau (1995) (dotted line) at , we find that the major discrepancy arises for high order lines in the Lyman series. In fact, the main contribution to the opacity at these wavelengths comes mostly from optically-thick absorbers, which are more numerous in the Madau (1995) calculation than the estimate of Prochaska et al. A slight offset is also visible in the Lyman- line, where our opacity is 2% higher than that computed by Madau (1995). Despite these differences, the two calculations for the transmission through a broad-band filter agree to within a few percent in the interval . We derive the IGM correction to an observed -band flux by integrating the product of the effective opacity and the -band transmission curve
| (23) |
The final values, in magnitudes, are presented in the lower panel of Figure 11 as a function of redshift: the solid, dotted, and dash-dotted lines are for the -, - and -bands, respectively.
Finally, we convert the UV luminosity (erg s-1 Hz-1) into an SFR (M⊙ yr-1) using the calibration at 1500Å from Madau et al. (1998), divided by 1.58 to account for a Chabrier IMF (Salim et al., 2007):
| (24) |
There are some caveats to this determination of the absolute SFR. First, it is not obvious whether the conversion of Madau et al. (1998) is applicable at wavelengths lower than 1500Å. In fact, the presence of molecular gas in the ISM can significantly increase the opacity of the UV photons in the Lyman-Werner band, resulting in an underestimated SFR if the star forming regions of DLAs are rich in molecules. Unfortunately, it is very difficult to properly account for this effect. In addition, the SED is most likely frequency-dependent, especially towards harder UV frequencies. Comparing fluxes at 1000 Å and 1500 Å with the SED templates of Grazian et al. (2006), we find that within a factor of 2 in scatter. Ad hoc calibrations can be computed, as done for example by Christensen et al. (2009). However, the same order of uncertainty is associated with different choices for the template age at a fixed metallicity. As a consequence, we infer that the absolute value of the SFR is uncertain at the level of a factor of 2. This is without considering additional complications due to dust extinction. Contamination from Ly emission is not an issue for our two DLAs, as the Ly line by design does not lie within the band.
Applying our calibration, we derive for DLA J073149+285449-A an unobscured SFR of h M⊙ yr-1, corrected by a factor of 1.9 due to IGM absorption. Here, the first uncertainty refers only to the error in the flux measurement, while the second one refers to a 50% uncertainty on the star formation calibration, combined with a 10% error from the IGM correction. To estimate the total star formation rate corrected for dust, one can include a factor of , as suggested by X-ray measurements (Reddy & Steidel, 2004) for galaxies with h M⊙ yr-1. For DLA J211444-005533, we derive an upper limit to the unobscured SFR of 1.4 h M⊙ yr-1, computed at 3 C.L. in a aperture, and corrected by a factor 4.4 for IGM absorption.
7 Discussion
7.1 Star formation rate in DLAs and LBGs
One of the outstanding questions in DLA studies is whether DLAs arise from the extended hydrogen reservoirs surrounding LBGs (e.g. Møller & Warren, 1998). This idea is in agreement with the finding that Ly emission is more spatially extended than the UV emission, suggesting that photons from newly formed stars are resonantly scattered before they can escape from the wings of the Ly line (Rauch et al., 2008). It is also consistent with the finding that DLAs have too low an in situ star formation rate to justify the chemical enrichment and the cooling rate inferred from [C II*] absorption lines888It should be noted that the [C II*] model of Wolfe et al. (2003) is inconsistent with the H I temperature distribution in DLAs, as derived from H I-21cm absorption studies. See Kanekar & Chengalur (2003); Kanekar et al. (2009). (Wolfe et al., 2003). The possible link between DLAs and LBGs has been the subject of several studies, comparing the sizes, morphology and luminosities of the two classes of objects (e.g. Fynbo et al., 1999; Møller et al., 2002). It should be emphasized, however, that only one DLA, the system towards Q22061958, has so far been directly shown to be associated with an LBG.
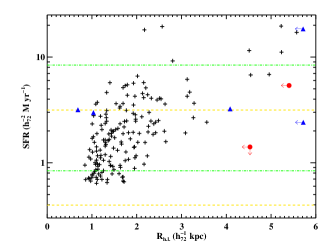
In Figure 12, we present an updated comparison of SFRs and sizes between LBGs and DLAs, using the SFRs derived for a sample of LBGs at by Bouwens et al. (private communication; see also Bouwens et al., 2004). The LBGs are shown with crosses, while the blue triangles represent DLAs with spectroscopically-confirmed hosts (see Appendix B). The red circles refer to candidate DLA J073149+285449-A and the 3 upper limit for DLA J211444-005533, from this work. We also overplot with green dash-dotted lines a typical L∗ and 1/10L∗ LBG from Reddy & Steidel (2009) ( at ). Finally, the dashed lines indicate the expected range of SFRs in DLAs, as inferred from the [C II*] model of Wolfe et al. (2003). The lower value is for a cold neutral medium (CNM), while the higher one is for a warm neutral medium (WNM); in both cases we assume a disk size of 100 kpc2 to convert the SFR surface density into an integrated value. Regarding the DLA sizes, we assume the seeing FWHM as an upper limit on the half-light radius for our determinations; for previously-known DLAs, we quote half-light radii from Møller et al. (2002) for 3 galaxies, while we assume an FWHM of 0.8′′ as a conservative upper limit for the remaining cases. All of the quantities presented here have been rescaled to match our SF calibration, IGM correction and cosmology. This allows for a relative comparison which is not affected by the systematic uncertainty on the absolute value for the SFR.
Interestingly enough, J073149+285449-A lies in the same interval of SFR observed for the earlier DLAs. Although the statistics are still limited, as noted in previous studies, the detected DLAs appear to be consistent with the SFR distribution of LBGs, at least for the redshift interval considered. The only exception is the bright DLA towards Q0151+048A, whose gas is known to be photo-ionized by a nearby QSO (Fynbo et al., 1999). Due to the small sample and the many upper limits for sizes, we refrain from additional discussion here. We only comment on the fact that DLAs, being H I selected galaxies, are expected to span a wide range in UV luminosity (e.g. Pontzen et al., 2008). However, the optical follow-up of these objects imposes an additional selection bias since only the most luminous DLAs can be observed. We remark that non-detection from our imaging can only be attributed to the sensitivity limits and hence will directly constrain the DLA luminosity function.
Finally, considering the SFR surface density expected from the [C II*] cooling rate in DLAs, we note that a disk of 100 kpc2 (lower yellow dashed lines in Figure 12) significantly underestimates the observed SFR, for the CNM model of Wolfe et al. (2003). For such a scenario, DLAs should typically arise in galaxies with star-forming regions extended over more than kpc2, similar to present day disks. If this is the case, a significant number of DLAs may be at low-surface brightness. Conversely, if DLAs originate exclusively from a WNM, model and observations agree for more compact disks, suggesting a typical DLA size of kpc2 (close to the higher yellow dashed line in Figure 12). We hope to improve our knowledge of the DLA size through our upcoming HST (PI: O’Meara, ID 11595) observations.
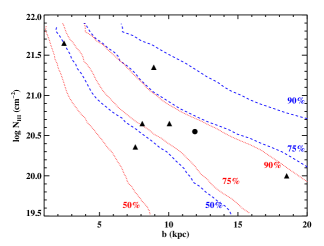
7.2 The HI distribution at
One of the most valuable results we hope to achieve is to directly trace how neutral gas is distributed around star-forming galaxies at . This will address the fundamental question of the origin of DLAs and ultimately provide important constraints for models of galaxy formation. Whereas next generation arrays such as the SKA will allow direct imaging of individual (albeit large) galaxies at in the H I 21cm line, our analysis should, given a large enough DLA sample, constrain the radial distribution of H I in DLAs as a function of the projected distance to the star-forming center.
Evidence for an anti-correlation between the impact parameter and the H I column density has been obtained by previous studies aimed to identify DLA host galaxies (Møller & Warren, 1998; Christensen et al., 2007). Similar results emerge from absorption line studies in QSO pairs or multiple images of lensed quasars (Monier et al., 2009). Once again, this is consistent with a model in which DLAs arise in gas located around star-forming galaxies. In Figure 13, we show the /N distribution for all DLAs whose impact parameters have been measured (triangles), along with our candidate DLA J073149+285449-A (circle). Our system lies within the population of confirmed DLA hosts, supporting previous claims for such an anti-correlation.
Figure 13 also overlays the above DLA data on the conditional probability of the impact parameter as a function of the H I column density, derived for local disk galaxies by Zwaan et al. (2005a, see their figure 15). After inverting N, the 50%, 75% and 90% percentiles of this distribution are plotted with blue dashed lines in the figure. The probability is found to increase with increasing impact parameters, as seen tentatively in the high- DLA sample. We also show (red dotted lines) the values expected after scaling the impact parameter (using the toy model of section 5.2.2) to , i.e. the median redshift of the observed DLAs. Compared with the local H I 21cm data, we find that almost all the high- DLAs lie within 75% of the H I distribution seen in present-day galaxies. Conversely, DLAs are seen to lie outside the 75th percentile of the expected H I distribution for models in which the gas at high redshifts follows the dark matter halo potential. Interestingly, this result is consistent with the gas distribution of lower redshift () absorbers (Monier et al., 2009). We emphasize that some of the previous observations are likely to have been biased against DLAs at small impact parameters; further, our toy model is based on very simplistic assumptions. Given these caveats, we infer that gas in high- DLA galaxies is distributed on larger scales than those inferred from the simulated disks. This is suggestive that the null hypothesis that gas in high- DLA galaxies has not changed its distribution from to the present epoch is consistent with the present data, in agreement with the absence of evolution in , as pointed out by Prochaska & Wolfe (2009). While this agrees with the notion that DLAs are large disks at high redshifts, a model in which gas-rich satellites surround a central star-forming galaxy may explain the observed distribution equally well. In fact, even if gas is distributed in small disks inside individual halos, multiple satellites around a central galaxy could be responsible for an overall extended H I distribution.
8 Summary and future prospects
We have presented a new imaging programme, aimed to increase the sample of DLA host galaxies known between and , based on an updated version of the dropout technique of O’Meara et al. (2006). We imaged QSO sightlines containing two optically-thick absorption line systems, using the Lyman limit of the higher-redshift absorber to block the quasar light at wavelengths shortward of the limit. This allows the rest-frame UV emission from the lower-redshift DLA to be imaged at wavelengths between the Lyman limits of the two absorbers, without any contamination from the QSO light. Using this criterion, we have selected a sample of 40 targets for HST and ground-based observations, which are currently being carried out. Once the locations of the candidate host galaxies have been determined from imaging, follow-up long-slit spectroscopy in either the Ly or the H lines will allow a measurement of the redshift of the DLA host. IFU spectroscopy will also reveal properties of the ISM (e.g. the metallicity or SFR via emission lines) from regions that are not probed by the QSO absorption lines. A significant advantage of the DLAs targeted in our survey is that, even for spectroscopy, the QSO contamination disappears blueward of the Lyman limit of the higher-redshift absorber. Any continuum detected in the spectrum comes only from foreground sources which are in the slit, increasing the probability of confirming the redshift of the galaxies associated with the low- DLA.
In this paper, we have presented preliminary results from the application of this technique to sightlines towards two QSOs, J211444-005533 and J073149+285449, each hosting two high column density absorbers. Our Keck-LRIS -band imaging of these fields achieved a depth of mag. at , resulting in the detection of a number of candidates for the host galaxy in each case. Follow-up spectroscopic studies are ongoing to confirm the galaxy-absorber associations for these and other candidate hosts identified in the programme.
To pre-select galaxies for spectroscopy or for those cases (e.g. very faint galaxies) where spectroscopic confirmation will be expensive, we have also proposed a statistical approach based on both number count statistics and a Bayesian treatment. This procedure is based on several simple assumptions and it does not aim to correctly identify each DLA, but provides a means to build a statistical sample of DLA galaxies that is representative of the entire population. We provide a general Bayesian identification procedure that can be applied to identify the galaxy counterparts of different types of absorption line systems, including DLAs. Due to the scarce present information on the impact parameter distribution in DLAs, we derived two different priors on this distribution, based on SPH simulations from Pontzen et al. (2009) and H I-21cm observations of local galaxies from THINGS (Walter et al., 2008). The second prior is computed under the assumption that the H I column density distribution does not evolve significantly with redshift (Prochaska & Wolfe, 2009), while the first is more consistent with a hierarchical picture of galaxy assembly. An observational determination of this prior will be possible once a larger sample ( objects) of spectroscopically-confirmed DLA will be available, from the present and other ongoing surveys.
We have tested the proposed statistical approach on a sample of five DLAs and one SLLS whose host galaxies have been spectroscopically confirmed. For all DLAs, the procedure correctly identified the galaxy giving rise to the absorber; conversely, we could not identify the galaxy responsible for the sub-DLA (with N cm-2), perhaps because our prior has been calibrated for higher H I column densities. Our test suggests that with this statistical method we can select a sample of bona fide DLAs complete to 60%-85% (depending on the required confidence level) with a contamination from interlopers around 15%-35%.
We then applied the proposed identification procedure to the candidate hosts detected in Keck-LRIS images of the fields of J211444-005533 and J073149+285449. For J211444-005533, no galaxies is found to be associated with the DLA at high significance, while for J073149+285449 we found a good candidate with 60% probability of being the DLA and less then 10% probability of being an interloper. This system is at a projected distance from the quasar , corresponding to an impact parameter of h kpc at . Spectroscopic confirmation of this candidate is now being carried out. Converting the rest-frame UV emission into a SFR, we measure for candidate DLA J073149+285449-A an unobscured SFR of h M⊙ yr-1, where the first uncertainty refers only to the error in the flux measurement, while the second one refers to a 50% uncertainty on the star formation calibration, combined with a 10% error from the IGM correction. Conversely, we place the 3 upper limit of h M⊙ yr-1 on the SFR of the DLA towards J211444-005533.
The SFR properties of our candidate and DLAs with identified hosts from the literature appear consistent with those of two independent samples of LBGs at similar redshifts (Bouwens et al., 2004; Reddy & Steidel, 2009), supporting earlier suggestions that the brightest DLA galaxies and LBGs might be overlapping galaxy populations. The impact parameter measured for the new candidate DLA J073149+285449-A is also consistent with an anti-correlation between impact parameter and H I column density N, as suggested by earlier studies of DLAs and local galaxies. Comparing the b-N distribution with the conditional probability of the impact parameter as a function of the H I column density derived in local disk galaxies, we find that most DLAs lie within the 75th percentile. This is consistent with the an absence of redshift evolution in at , consistent with the distribution at (Prochaska & Wolfe, 2009), but it could be equally well explained with systems composed by a central star-forming galaxy and multiple gas-rich satellites, in concordance with cold dark matter simulations.
With the direct images of high- DLA host galaxies that will be available from our HST/Keck survey we aim to enlarge the current sample to answer some fundamental questions on the absorbers. What is the typical star formation rate in DLAs at ? How are gas and stars distributed in the absorbers at these redshifts? Are rotationally-supported disks already in place at ? Or are DLAs associated with merging gas clumps? How do the metallicity, the dust-to-gas ratio, and the H I column density depend on the impact parameter? Is there an SFR/metallicity or a mass/metallicity relation in DLAs? Over the next few years, it should hence be possible to obtain a comprehensive picture of the properties of high redshift DLAs, providing new insights into their role in the broad picture of galaxy formation and evolution.
Acknowledgments
We thank Rychard Bouwens for providing LBG data and Andrew Pontzen and Fabio Governato for permission to use their simulations prior to publication. We thank the referee for their careful revision of the manuscript, useful to improve this work. We acknowledge helpful discussions with Mark Krumholz, Robert da Silva, Marc Rafelski, Chris Howk and Eric Gawiser. J.M.O. is partially supported by NASA grant HST-GO-10878.05-A and by a generous gift from the Ross family for faculty development at Saint Michael’s College. J.X.P. is supported by NSF grant (AST-0709235). N.K. thanks the Department of Science and Technology for support through a Ramanujan Fellowship. The authors wish to recognize and acknowledge the very significant cultural role and reverence that the summit of Mauna Kea has always had within the indigenous Hawaiian community. We are most fortunate to have the opportunity to conduct observations from this mountain. We acknowledge the use of the Sloan Digital Sky Survey (http://www.sdss.org/).
| ID | tot. | S/Nu | ap. | ap. | ap. | ap. | |||||||
| (′′) | (mag.) | (mag.) | (mag.) | (mag.) | (mag.) | (mag.) | (mag.) | (mag.) | (mag.) | (mag.) | |||
| J211444-005533 | |||||||||||||
| A | 2.54 E | 1.32 N | 25.53 | 0.08 | 15.8 | 25.62 | 0.11 | 24.31 | 0.10 | 24.49 | 0.10 | 24.25 | 0.11 |
| B | 3.19 W | 0.73 S | 26.98 | 0.15 | 7.5 | - | - | - | - | - | - | - | - |
| C | 1.45 E | 4.88 N | 25.58 | 0.09 | 14.3 | 25.84 | 0.08 | 24.64 | 0.06 | 24.65 | 0.05 | 24.69 | 0.09 |
| D | 0.54 E | 5.05 S | 27.78* | 0.24 | 4.6 | - | - | - | - | - | - | - | - |
| E | 6.35 W | 3.92 N | 26.95 | 0.15 | 7.8 | - | - | - | - | - | - | - | - |
| F | 8.67 W | 0.07 N | 22.76 | 0.06 | 90.5 | 23.19 | 0.06 | 20.22 | 0.05 | 20.78 | 0.04 | 19.93 | 0.05 |
| G | 6.77 W | 4.12 S | 25.59 | 0.08 | 18.7 | 25.71 | 0.07 | 25.71 | 0.11 | 25.75 | 0.10 | 26.10 | 0.22 |
| H | 0.84 W | 10.22 S | 24.99 | 0.07 | 24.6 | 25.40 | 0.06 | 24.99 | 0.06 | 25.09 | 0.06 | 24.97 | 0.09 |
| I | 3.81 E | 8.82 S | 24.44 | 0.06 | 41.3 | 24.75 | 0.06 | 24.63 | 0.06 | 24.74 | 0.05 | 24.63 | 0.08 |
| L | 7.88 E | 2.93 S | 27.93* | 0.30 | 3.7 | - | - | - | - | - | - | - | - |
| M | 8.35 E | 0.374 N | 25.33 | 0.09 | 14.9 | 26.10 | 0.08 | 25.98 | 0.13 | 25.99 | 0.11 | 26.02 | 0.19 |
| N | 8.87 E | 2.25 N | 25.55 | 0.09 | 14.6 | 25.76 | 0.07 | 25.81 | 0.13 | 25.71 | 0.10 | 25.94 | 0.20 |
| O | 4.06 E | 3.11 N | 28.61* | 0.34 | 3.2 | - | - | - | - | - | - | - | - |
| P | 6.21 E | 10.31 S | 27.28 | 0.22 | 5.1 | - | - | - | - | - | - | - | - |
| Q | 5.81 E | 10.38 S | 27.37* | 0.25 | 4.3 | - | - | - | - | - | - | - | - |
| R | 3.29 W | 11.57 S | 26.99 | 0.16 | 7.3 | 27.04 | 0.13 | 27.13* | 0.35 | 27.23* | 0.32 | 27.25* | 0.54 |
| S | 12.47 E | 3.46 S | 24.35 | 0.06 | 37.3 | 24.83 | 0.06 | 24.21 | 0.05 | 24.46 | 0.05 | 24.23 | 0.07 |
| T | 12.05 E | 1.57 S | 26.89 | 0.21 | 5.4 | 26.75 | 0.20 | 26.05* | 0.25 | 25.83 | 0.18 | 25.84* | 0.28 |
| J073149+285449 | |||||||||||||
| A | 1.28 E | 0.86 S | 25.49 | 0.11 | 13.3 | - | - | - | - | - | - | - | - |
| B | 2.44 E | 1.51 S | 26.05 | 0.16 | 7.4 | - | - | - | - | - | - | - | - |
| C | 4.50 E | 0.58 S | 27.10 | 0.22 | 5.2 | - | - | - | - | - | - | - | - |
| D | 3.97 W | 1.73 S | 25.11 | 0.10 | 15.0 | - | - | - | - | - | - | - | - |
| E | 4.61 W | 1.10 N | 26.17 | 0.16 | 7.4 | - | - | - | - | - | - | - | - |
| F | 5.21 W | 3.59 N | 24.67 | 0.09 | 20.2 | - | - | - | - | - | - | - | - |
| G | 8.71 W | 5.80 N | 27.26* | 0.24 | 4.7 | - | - | - | - | - | - | - | - |
| H | 11.19 W | 5.98 N | 25.13 | 0.10 | 14.3 | - | - | - | - | - | - | - | - |
| I | 2.44 E | 12.14 N | 22.86 | 0.07 | 64.6 | - | - | - | - | - | - | - | - |
| L | 0.26 E | 8.59 S | 26.39 | 0.17 | 6.8 | - | - | - | - | - | - | - | - |
| M | 0.58 E | 9.90 S | 27.02 | 0.23 | 5.0 | - | - | - | - | - | - | - | - |
| N | 11.81 E | 4.63 N | 27.72* | 0.24 | 4.7 | - | - | - | - | - | - | - | - |
| Name | N | SFR | F(Ly) | F() | Magnitude | rhl | |||||||
|---|---|---|---|---|---|---|---|---|---|---|---|---|---|
| (”) | (kpc) | (cm-2) | (M⊙ yr-1) | (cgs) | (cgs) | (′′) | |||||||
| (1) | (2) | (3) | (4) | (5) | (6) | (7) | (8) | (9) | (10) | (11) | (12) | (13) | (14) |
| 1Q0151+048A | 1.922 | 1.934 | 10.93 | 7.59 | 20.36 | - | - | 18.45 | 1191 | - | 122.9 | u | - |
| 3PKS0458-02 | 2.286 | 2.039 | 30.30 | 2.44 | 21.65 | 61.5 | Ly | - | 35.4 | - | - | - | - |
| 4PKS0528-250 | 2.797 | 2.811 | 51.17 | 8.92 | 21.35 | 44.2 | Ly | 3.17 | 77.4 | - | 725.43 | V | 70.09 |
| 7Q2206-1958a | 2.559 | 1.920 | 70.99 | 8.09 | 20.65 | 5.7 | UV | 3.23 | 626 | 7.6 | 24.69 | V | 70.5 |
| 2Q2206-1958b | 2.559 | 1.920 | 1.23 | 10.05 | 20.65 | 4.2 | UV | 2.41 | - | 10.7 | 25.01 | V | - |
| 82233.9+1318 | 3.298 | 3.150 | 2.51 | 18.52 | 20.00 | 5.9 | UV | 2.98 | 86.4 | 6.8 | 25.75 | V | 70.14 |
Appendix A Photometric quantities
Quantities derived from the photometry of galaxies detected in the fields J211444-005533 and J073149+285449 are listed in Table A6. Relative separations from the quasar are in columns 2 and 3, in arcsec. Total magnitudes, uncertainties and signal-to-noise ratios for the band are in columns 4, 5, and 6, respectively. The remaining columns list the magnitudes computed in circular apertures in the , , and bands. Additional details are provided in section 3.2. All the listed magnitudes have been corrected for Galactic extinction.
Appendix B Previous imaging studies of high- DLAs
In this appendix, we review all previous emission studies of DLAs that are known to the authors. Table B7 summarizes the properties of the six such DLAs for which a galaxy counterpart has been spectroscopically confirmed. The DLA towards PKS045802 is included in this list although direct imaging of the associated galaxy is not available (See, however, Warren et al., 2001). For this object, the impact parameter has been computed via long-slit spectroscopy at two orientations. Conversely, the table does not include DLAs whose emission lines have been detected in spectra, but for which no spatial information is available; these are discussed separately below. The columns of Table B7 are:
-
(1)
The quasar name and a reference to the first identification of the galaxy counterpart.
-
(2)
The quasar redshift.
-
(3)
The DLA redshift.
-
(4)
The impact parameter, in ′′.
-
(5)
The impact parameter, in kpc.
-
(6)
The H I column density.
-
(7)
The published SFR.
-
(8)
The SFR diagnostic used for column (7).
-
(9)
The unobscured SFR, computed from the UV emission with our calibration, after applying a K-correction and an IGM correction.
-
(10)
The Ly flux in erg cm-2 s-1.
-
(11)
The [OIII] flux in erg cm-2 s-1.
-
(12)
The broad-band magnitude, in AB mag.
-
(13)
The filter used for broad-band photometry in column (12).
-
(14)
The half-light radius, deconvolved for the PSF.
Individual references are:
-
(1)
Fynbo et al. (1999)
-
(2)
Weatherley et al. (2005)
-
(3)
Møller et al. (2004)
-
(4)
Møller & Warren (1993)
-
(5)
Møller & Warren (1998)
-
(6)
Wolfe et al. (2005)
-
(7)
Møller et al. (2002)
-
(8)
Djorgovski et al. (1996)
Where not explicitly specified, data are taken from Weatherley et al. (2005) and references therein.
Three other DLAs with confirmed redshifts can be found in the literature. A DLA at has been reported to exhibit Ly emission in the spectrum of PC0953+4749 by Bunker (HST Proposal ID 10437), but no additional imaging has been published. Djorgovski et al. report (private communication in Weatherley et al., 2005) the detection of emission lines from a DLA at towards the quasar DMS2247-0209. The most likely association is a galaxy at , whose inferred SFR is 0.7 M⊙ yr -1. Finally, Leibundgut & Robertson (1999) report the detection of Ly emission which is spatially extended in the absorption trough of a DLA at . Due to the large velocity offset between absorption and emission redshifts, the emission feature could result from an object not associated with the DLA.
We next summarize results from other studies that have either identified possible galaxy counterparts of high- DLAs, or placed upper limits on the host luminosity. Aragon-Salamanca et al. (1996) reported deep near-IR images of 10 fields containing DLAs, finding two DLA candidates at small impact parameters (). In a long-slit K-band spectroscopic search for H emission from eight DLAs at , Bunker et al. (1999) obtained limits in the range M⊙ yr-1. Kulkarni et al. (2000, 2001) used HST NICMOS images of two DLAs at and to place upper limits of M⊙ yr-1 and M⊙ yr-1, respectively, on the DLA star formation rates. Ellison et al. (2001) found a possible association between the DLA towards the quasar Q0201+113 and a galaxy at an impact parameter of kpc. In a deep narrow-band imaging survey of six fields with heavy-element quasar absorption lines, Kulkarni et al. (2006) searched for Ly emission from absorbers at , obtaining SFR limits of M⊙ yr-1, assuming no dust attenuation of the Ly line. HST photometry for several galaxies detected in 18 DLA fields is presented in Warren et al. (2001). Finally, Christensen et al. (2007) used IFU spectroscopy in the Ly line to identify candidate hosts for six DLAs at .
References
- Aragon-Salamanca et al. (1996) Aragon-Salamanca A., Ellis R. S., O’Brien K. S., 1996, MNRAS, 281, 945
- Barnes & Haehnelt (2009) Barnes L. A., Haehnelt M. G., 2009, MNRAS, 397, 511
- Bertin (2009) Bertin E., 2009, Memorie della Societa Astronomica Italiana, 80, 422
- Bertin & Arnouts (1996) Bertin E., Arnouts S., 1996, A&AS, 117, 393
- Bolton et al. (2006) Bolton A. S., Burles S., Koopmans L. V. E. et al., 2006, ApJ, 638, 703
- Bouwens et al. (2004) Bouwens R. J., Illingworth G. D., Blakeslee J. P. et al., 2004, ApJ, 611, L1
- Brammer et al. (2008) Brammer G. B., van Dokkum P. G., Coppi P., 2008, ApJ, 686, 1503
- Bunker et al. (1999) Bunker A. J., Warren S. J., Clements D. L. et al., 1999, MNRAS, 309, 875
- Cardelli et al. (1989) Cardelli J. A., Clayton G. C., Mathis J. S., 1989, ApJ, 345, 245
- Ceverino et al. (2009) Ceverino D., Dekel A., Bournaud F., 2009, ArXiv e-prints
- Chen et al. (2010) Chen H., Helsby J. E., Gauthier J. et al., 2010, ArXiv e-prints
- Christensen et al. (2007) Christensen L., Wisotzki L., Roth M. M. et al., 2007, A&A, 468, 587
- Christensen et al. (2009) Christensen L., Noterdaeme P., Petitjean P. , 2009, A&A, 505, 1007
- Cooke et al. (2005) Cooke J., Wolfe A. M., Prochaska J. X. et al., 2005, ApJ, 621, 596
- Cooke et al. (2006) Cooke J., Wolfe A. M., Gawiser E. et al., 2006, ApJ, 636, L9
- Dekel et al. (2009) Dekel A., Birnboim Y., Engel G. et al., 2009, Nature, 457, 451
- Dessauges-Zavadsky, Calura, Prochaska et al. (2007) Dessauges-Zavadsky M., Calura F., Prochaska J. X. et al., 2007, A&A, 470, 431
- Djorgovski et al. (1996) Djorgovski S. G., Pahre M. A., Bechtold J. et al., 1996, Nature, 382, 234
- Downes et al. (1986) Downes A. J. B., Peacock J. A., Savage A. et al., 1986, MNRAS, 218, 31
- Ellison et al. (2001) Ellison S. L., Pettini M., Steidel C. C. et al., 2001, ApJ, 549, 770
- Ferguson et al. (2004) Ferguson H. C., Dickinson M., Giavalisco M. et al., 2004, ApJ, 600, L107
- Förster Schreiber et al. (2009) Förster Schreiber N. M., Genzel R., Bouché N. et al., 2009, ApJ, 706, 1364
- Fox et al. (2009) Fox A. J., Prochaska J. X., Ledoux C. et al., 2009, A&A, 503, 731
- Fynbo et al. (1999) Fynbo J. U., Møller P., Warren S. J., 1999, MNRAS, 305, 849
- Genzel et al. (2006) Genzel R., Tacconi L. J., Eisenhauer, F. et al., 2006, Nature, 442, 786
- Gilmour et al. (2007) Gilmour R., Gray M. E., Almaini O. et al., 2007, MNRAS, 380, 1467
- Governato et al. (2007) Governato F., Willman B., Mayer L. et al., 2007, MNRAS, 374, 1479
- Grazian et al. (2006) Grazian A., Fontana A., de Santis C. et al., 2006, A&A, 449, 951
- Grazian et al. (2009) Grazian A., Menci N., Giallongo E. et al, 2009, A&A, 505, 1041
- Hennawi & Prochaska (2007) Hennawi J. F., Prochaska J. X., 2007, ApJ, 655, 735
- Hildebrandt et al. (2008) Hildebrandt H., Wolf C., Benítez N., 2008, A&A, 480, 703
- Jedamzik & Prochaska (1998) Jedamzik K., Prochaska J. X., 1998, MNRAS, 296, 430
- Kacprzak et al. (2009) Kacprzak G. G., Churchill C. W., Ceverino D. et al., 2009, ArXiv e-prints
- Kanekar & Chengalur (2003) Kanekar N., Chengalur J. N., 2003, A&A, 399, 857
- Kanekar et al. (2009) Kanekar N., Smette A., Briggs F. H. et al., 2009, ApJ, 705, L40
- Kereš et al. (2005) Kereš D., Katz N., Weinberg D. H. et al., 2005, MNRAS, 363, 2
- Kim et al. (2002) Kim T., Carswell R. F., Cristiani S. et al., 2002, MNRAS, 335, 555
- Kulkarni et al. (2000) Kulkarni V. P., Hill J. M., Schneider G. et al., 2000, ApJ, 536, 36
- Kulkarni et al. (2001) Kulkarni V. P., Hill J. M., Schneider G. et al., 2001, ApJ, 551, 37
- Kulkarni et al. (2006) Kulkarni V. P., Woodgate B. E., York D. G. et al., 2006, ApJ, 636, 30
- Landolt (1992) Landolt A. U., 1992, AJ, 104, 340
- Leibundgut & Robertson (1999) Leibundgut B., Robertson J. G., 1999, MNRAS, 303, 711
- Madau (1995) Madau P., 1995, ApJ, 441, 18
- Madau et al. (1998) Madau P., Pozzetti L., Dickinson M., 1998, ApJ, 498, 106
- Matsuda et al. (2004) Matsuda Y., Yamada T., Hayashino T. et al., 2004, AJ, 128, 569
- Møller & Warren (1993) Møller P., Warren S. J., 1993, A&A, 270, 43
- Møller & Warren (1998) Møller P., Warren S. J., 1998, MNRAS, 299, 661
- Møller et al. (2002) Møller P., Warren S. J., Fall S. M. et al., 2002, ApJ, 574, 51
- Møller et al. (2004) Møller P., Fynbo J. P. U., Fall S. M., 2004, A&A, 422, L33
- Monier et al. (2009) Monier E. M., Turnshek D. A., Rao S., 2009, MNRAS, 397, 943
- Nagamine et al. (2007) Nagamine K., Wolfe A. M., Hernquist L. et al., 2007, ApJ, 660, 945
- Noterdaeme et al. (2009) Noterdaeme P., Petitjean P., Ledoux C. et al., 2009, A&A, 505, 1087
- Obreschkow & Rawlings (2009) Obreschkow D., Rawlings S., 2009, ApJ, 696, L129
- Oke et al. (1995) Oke J. B., Cohen J. G., Carr M. et al., 1995, PASP, 107, 375
- O’Meara et al. (2006) O’Meara J. M., Chen H.-W., Kaplan D. L., 2006, ApJ, 642, L9
- O’Meara et al. (2007) O’Meara J. M., Prochaska J. X., Burles S. et al., 2007, ApJ, 656, 666
- Papovich et al. (2005) Papovich C., Dickinson M., Giavalisco M. et al., 2005, ApJ, 631, 101
- Pontzen et al. (2009) Pontzen A., Deason A., Governato F. et al., 2009, MNRAS, pp 1943
- Pontzen et al. (2008) Pontzen A., Governato F., Pettini M. et al., 2008, MNRAS, 390, 1349
- Prochaska & Wolfe (1997) Prochaska J. X., Wolfe A. M., 1997, ApJ, 487, 73
- Prochaska & Wolfe (2009) Prochaska J. X., Wolfe A. M., 2009, ApJ, 696, 1543
- Prochaska et al. (2005) Prochaska J. X., Herbert-Fort S., Wolfe A. M., 2005, ApJ, 635, 123
- Prochaska et al. (2009) Prochaska J. X., O’Meara J. M., Worseck G., 2009, ArXiv e-prints
- Rafelski et al. (2009) Rafelski M., Wolfe A. M., Cooke J. et al., 2009, ApJ, 703, 2033
- Rao et al. (1995) Rao S. M., Turnshek D. A., Briggs F. H., 1995, ApJ, 449, 488
- Rao et al. (2006) Rao S. M., Turnshek D. A., Nestor D. B., 2006, ApJ, 636, 610
- Rauch et al. (2008) Rauch M., Haehnelt M., Bunker A. et al., 2008, ApJ, 681, 856
- Razoumov et al. (2006) Razoumov A. O., Norman M. L., Prochaska J. X. et al., 2006, ApJ, 645, 55
- Reddy & Steidel (2004) Reddy N. A., Steidel C. C., 2004, ApJ, 603, L13
- Reddy & Steidel (2009) Reddy N. A., Steidel C. C., 2009, ApJ, 692, 778
- Rutledge et al. (2000) Rutledge R. E., Brunner R. J., Prince T. A. et al., 2000, ApJS, 131, 335
- Salim et al. (2007) Salim S., Rich R. M., Charlot, S. et al., 2007, ApJS, 173, 267
- Schaye (2001) Schaye J., 2001, ApJ, 559, L1
- Schlegel et al. (1998) Schlegel D. J., Finkbeiner D. P., Davis M., 1998, ApJ, 500, 525
- Storrie-Lombardi & Wolfe (2000) Storrie-Lombardi L. J., Wolfe A. M., 2000, ApJ, 543, 552
- Sutherland & Saunders (1992) Sutherland W., Saunders W., 1992, MNRAS, 259, 413
- Verheijen (2001) Verheijen M. A. W., 2001, ApJ, 563, 694
- Walter et al. (2008) Walter F., Brinks E., de Blok W. J. G. et al., 2008, AJ, 136, 2563
- Warren et al. (2001) Warren S. J., Møller P., Fall S. M. et al., 2001, MNRAS, 326, 759
- Weatherley et al. (2005) Weatherley S. J., Warren S. J., Møller P. et al., 2005, MNRAS, 358, 985
- Wolfe & Chen (2006) Wolfe A. M., Chen H.-W., 2006, ApJ, 652, 981
- Wolfe et al. (2005) Wolfe A. M., Gawiser E., Prochaska J. X., 2005, ARA&A, 43, 861
- Wolfe et al. (2003) Wolfe A. M., Prochaska J. X., Gawiser E., 2003, ApJ, 593, 215
- Wolfe et al. (1986) Wolfe A. M., Turnshek D. A., Smith H. E. et al., 1986, ApJS, 61, 249
- Zwaan et al. (2005b) Zwaan M. A., Meyer M. J., Staveley-Smith L. et al., 2005b, MNRAS, 359, L30
- Zwaan et al. (2005a) Zwaan M. A., van der Hulst J. M., Briggs F. H. et al., 2005a, MNRAS, 364, 1467