Diffusion anomaly and dynamic transitions in the Bell-Lavis water model
Abstract
In this paper we investigate the dynamic properties of the minimal Bell-Lavis (BL) water model and their relation to the thermodynamic anomalies. The Bell-Lavis model is defined on a triangular lattice in which water molecules are represented by particles with three symmetric bonding arms interacting through van der Waals and hydrogen bonds. We have studied the model diffusivity in different regions of the phase diagram through Monte Carlo simulations. Our results show that the model displays a region of anomalous diffusion which lies inside the region of anomalous density, englobed by the line of temperatures of maximum density (TMD). Further, we have found that the diffusivity undergoes a dynamic transition which may be classified as fragile-to-strong transition at the critical line only at low pressures. At higher densities, no dynamic transition is seen on crossing the critical line. Thus evidence from this study is that relation of dynamic transitions to criticality may be discarded.
pacs:
61.20.Gy,65.20.+wI Introduction
Water is the most familiar substance in nature, and nonetheless a satisfactory understanding of its properties is still lacking. Many of its properties are regarded as anomalous, when compared with those of other substances URL . Its most well-known peculiar property is probably the density anomaly An76 , which increases with temperature for a range of pressures. In addition, different response functions, such as specific heat, isothermal compressibility and thermal expansion coefficient also display peculiar behaviors.
Besides thermodynamic anomalies, water also exhibits dynamic anomalies, seen in both experiments An76 and in simulations Ne01 . In usual fluids, diffusivity increases with decreasing density, since mobility is enhanced in a less dense medium. However, in the case of liquid water, a range of pressures exists for which diffusivity exhibits non monotonic behavior with density, and both minima and a maxima in the diffusion coefficient may be found.
It has been proposed a few years ago that these anomalies would be related to the second critical point between two liquid phases, the low-density liquid (LDL) and the high-density liquid (HDL) phases Po92 . This critical point, discovered through computer simulations, might be located in the supercooled region beyond the line of homogeneous nucleation and is thus unacessible experimentally. This hypothesis has been supported by indirect experimental results Mi98 . In spite of the limit of below which water cannot be found in the liquid phase without crystallization, two amorphous phases were observed at much lower temperatures Mi84 . There is some evidences, even if not definitive, of the presence of the two liquid phases Mi02 ; Ma04 ; Sm99 .
Recently, experimental results in nanoscale hydrophilic pores show a crossover from fragile to strong diffusivity as temperature is lowered,in the supercooled region, at constant pressure Li04 ; Li05 ; Xu05 . The concept of fragility, introduced by Angell An97 , classifies the liquids as strong or fragile, whether the diffusion coefficient displays Arrhenius or non-Arrhenius behavior, respectively. In order to give further support to the hypothesis of a critical point at the end of the coexistence line between the two liquid phases, it was suggested that this crossover from a fragile to strong regime in water would signal the presence of criticality. In particular, it was proposed that the fragile-to-strong transition observed in water is associated with crossing the Widom line, the analytic continuation of the coexistence line.
Is the fragile-to-strong transition associated to the presence of criticality? In order to address this question, a number of models which display criticality were investigated as to the presence of fragile-to-strong transitions Ku08 ; Sz09 ; Sz10 . These studies have shown that on crossing the critical line, fragile-to-strong, strong-to-strong or even fragile-to-fragile transitions could be observed, depending on the specific structure of the phases separated by the critical line. In the particular case of the Associated Lattice Gas Model, which presents two critical lines, two kinds of dynamic transitions are also present. The critical line separating the fluid from the low density liquid phase, at lower pressures, could be associated to a fragile-to-strong transition, whereas the critical line separating the high density fluid from the high density liquid phase, at higher pressures, was associated to a strong-to-strong dynamic transition Sz09 . In both cases, the the dynamic transition is of the same kind along the whole critical line. Thus a logical question arises: is the type of the dynamic transition linked with the universality class of the critical line? or does it only depend on the nature of the phases related to the dynamic transition?
In this paper, we test these ideas on a very simple model that exhibits a single critical line separating two fluids. If the universality class of the critical line and the class of the dynamic transition are associated, we would expect the model to display dynamic transitions of one class only. We investigate the diffusion properties of the Bell Lavis (BL) water model Be70 , the only two dimensional ice-like orientational model known to us which does not require an energy penalty in order to present a density anomaly. It is a triangular lattice gas model in which water molecules are represented by particles with three symmetric bonding interacting through van der Waals and hydrogen bonds. It is probably the simplest orientational model that reproduces water like anomalies. Our study will focus on three questions: are dynamic anomalies and dynamic transitions verified in a minimal model? If present, how are they related to thermodynamic anomalies? Are dynamic transitions related the criticality?
This paper is organized as follows: in Sec. II the model is described and its phase diagram is reviewed; in Sec. III the simulation results for the model dynamic anomalies and dynamic transitions are presented; Sec V resumes our conclusions.
II The Bell-Lavis model and phase diagram
The Bell-Lavis model is a two-dimensional system in which molecules are located on a triangular lattice and are represented by two kinds of variable, in order to represent occupational and orientational states. The occupational variables assume the value , if the site is empty, and , if the site is occupied by a molecule. The orientational variables are introduced to represent the possibility of bonding between molecules. Each molecule has six arms, separated by 120∘, three of them inert, with , while the other three are the bonding arms, with . The two possible orientations and for the molecule are illustrated in Fig. 1.

Two neighbor molecules interact via van der Waals and hydrogen bonding. The model energy is described by the following effective Hamiltonian, in the grand-canonical ensemble:
| (1) |
where and are the strength of hydrogen bond (hb) and van der Waals (vdW) interaction energies, respectively and is the chemical potential.
The phase diagram of this model was investigated for different values of the bonding strength, with different approaches: under a mean-field approach Be70 ; La73 ; Ba08 , with renormalization group techniques Yo79 ; So80 and very recently, through detailed numerical simulations Fi09 . In this paper, we restrict our analysis to two values of the bonding strength parameter , and . These two parameter values are interesting because in both cases the system exhibits two liquid phases. However, for , the critical line ends at a tricritical point, while for it does end at a critical end point.
The chemical potential versus temperature model phase diagram is shown in Figs. 2 and 3, for and , respectively. Reduced units for temperature and chemical potential are defined as
| (2) |


For both and , the system displays three different phases. For low chemical potential, the system is constrained in the gas phase, with density . For intermediate values of the chemical potential, the system is in the low density liquid phase (LDL). For high chemical potentials, the system exhibits a high density liquid phase (HDL). The LDL and HDL phases are separated by a critical line, which has been identified as an order-disorder transition Fi09 . Typical configurations for the zero temperature LDL and HDL configurations are illustrated in Fig. 4.

The phase transition between gas and LDL phases is first-order for both values of Fi09 . For this transition, the order-parameter is associated to density , where is the number of occupied sites while is the number of sites. At zero temperature, the two phases coexist, with for the gas, and for the LD liquid. For higher bonding strength, , the coexistence line ends at a tricritical point, whereas for lower bonding strength, , it ends at a critical point. The HDL-LDL critical line ends at the coexistence line, thus yielding coexistence between the HDL and the gas phases. The phase transition between LDL-HDL phases is second-order for both value of and has been associated to an orientational order-disorder transition Fi09 .
In both cases of smaller and larger bonding strengths, the system displays a region of anomalous thermodynamic behavior. For , the line of temperatures of maximum density (TMD) is located inside the HDL phase. For , it crosses the LDL phase, for lower pressures, and migrates to the HDL phase, for high pressures.
III Diffusivity and dynamic transitions
We have studied diffusivity for the Bell-Lavis model over its phase diagram through Monte Carlo simulations.
The numerical algorithm for studying mobility is described as follows: (i) the system is equilibrated with fixed chemical potential (or density) and fixed temperature; (ii) an occupied site and it’s neighbor are chosen randomly; (iii) if the neighbor site is empty, the molecule moves to the empty site and the difference between the final and the initial energy is computed; (iv) if , the movement is accepted, otherwise the movement is accepted with a probability . A Monte Carlo step is defined through the number of trials of movement for every particle. After repeating this algorithm times, where is the number of molecules in the lattice, the diffusion coefficient is evaluated according to Einstein’s equation
| (3) |
where is the mean square displacement per particle and time is measured in Monte Carlo steps.
Our data have been obtained for lattice size under periodic boundary conditions.
III.1 Diffusion anomaly
In normal liquids, the diffusion coefficient grows as the density decreases. However, in anomalous liquids, the diffusivity decreases from a maximum at to a minimum at , as the density is decreased. For densities outside this region the diffusion behaves as described above, i. e, as a normal liquid.
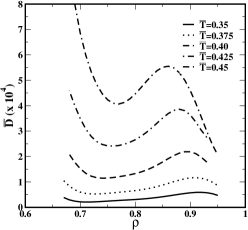
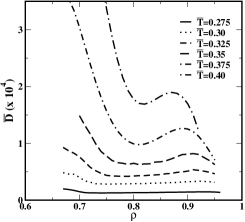
In order to investigate the existence of this anomaly for the BL model, the diffusion coefficient was computed as a function of density, for fixed temperatures, for both and . The results are shown in Figs. 5 and 6.
For , the diffusion coefficient exhibits a maximum in the region and a minimum for , and temperatures between 0.35 and 0.45. For densities lower than diffusivity behaves normally, increasing as the density decreases. A similar behavior is verified for , with the diffusivity maximum located in the interval , and the minimum diffusivity in the range , for temperature interval ranging from 0.275 and 0.400.
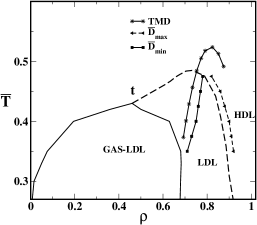
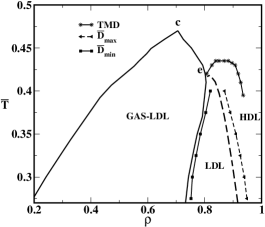
The locci of maxima and minima in diffusivity define a region of diffusion anomaly in the phase diagram, which are illustrated in Figs. 7 and 8, for and in the space of versus and in Figs. 2 and 3 in the space of chemical potential . As can be seen, the maximum in diffusivity is located just above the critical line in the HDL phase, whereas the minimum in diffusivity is within the low density liquid, close to the gas-liquid coexistence line. Thus the diffusion anomalous region lies across the LDL-HDL critical line. Since the LDL phase is characterized by bonds ordering, this explains the loss of particle mobility, as the LDL phase is approached from the HDL bond-disordered phase. Note that loss in mobility initiates in the bond-disordered phase close to the critical line, may being related to large fluctuations in bonding density. On the other hand, inside the LDL phase, as density is further lowered, mobility again increases, in spite of bond order, probably due to the large increase of vacant sites vacant sites, as the 2/3 density of the fully translationally ordered phase is approached.
A point to note further is that the anomalous diffusion region is enveloped by the border of the region of density anomaly. This is different from the behavior presented by liquid water, but is common to other lattice models Sz07 ; Sz09 ; Sz10 . A possible reason for this discrepancy is the fact that bonding is more rigid in the lattice model, thus reducing the mobility of particles as compared to continuous models, in which rotations allow for slightly distorted bonds.
III.2 Dynamic transitions
In order to verify the existence of dynamic transitions and its possibility of relation to the criticality, diffusivity was computed as a function of temperature, for fixed chemical potentials. The present analysis has been carried out in different regions of the phase diagram. Results for two different chemical potentials have been presented for both stronger and weaker bonding strength cases ( and ).
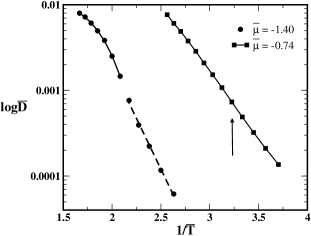
For , the behavior of the diffusion coefficient with temperature was analyzed for chemical potentials and . The two values of chosen are indicated by arrows in the phase diagram of Fig. 2. Fig. 9 shows vs. for the two cases. For the lower chemical potential, the diffusion coefficient undergoes a dynamic transition at the critical line: at high temperatures, diffusivity follows non-Arrhenius polynomial behavior, given generally by , which characterizes the system as a fragile liquid; in the low temperature region, diffusivity follows an Arrhenius law given by , thus characterizing the system as a strong liquid. The coefficients Ai and Bi are fitting parameters, which are not investigated in this study. Surprisingly, for the higher chemical potential the dynamic crossover at the critical line is no longer detected. At this chemical potential, the critical line is crossed at a temperature (1/) and, as can be seen in Fig. 9, the system is insensible to the presence of the critical line.
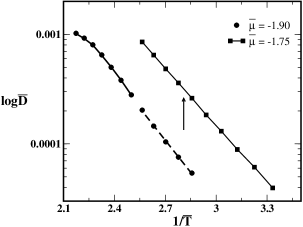
For the behavior of the diffusivity was also analyzed for two different chemical potentials, and , as indicated by arrows in the phase diagram of Fig. 2. The assumptions for the weaker hydrogen bonding case is similar to that of the stronger bonding one, as shown in Fig. 10. A dynamic transition is seen only for the lower chemical potential , whereas for the higher chemical potential,, diffusivity is no longer affected by the presence of the critical line, showing once more that despite the system presenting a thermodynamic phase transition, no significant structural changing has occurred in the latter case, implying therefore in the absence of dynamic transition.
IV Conclusions
In this paper we have addressed the question of the relation between critical lines and dynamic transitions. In order to highlight the answer to this question we we have investigated the dynamic behavior of the Bell-Lavis water model. This model has been considered because it presents a relative single critical line that separates two fluid phases of different structure. Our study focuses on the diffusion anomaly and dynamic transitions, and on their relation to criticality. In the first analysis, we have found that, in similarly to other two length scales models, the BL model presents a diffusion anomalous region inside the region of density anomalies Sz09 ; Sz07 .
Second, we looked for dynamic transitions by analyzing the behavior of diffusivity with temperature across the critical line, at fixed chemical potentials. Our results showed that two different regimes may be found: if the critical line is crossed at low chemical potential, near the minimum in diffusivity, a fragile-to-strong transition is observed; for higher chemical potentials, near the diffusivity maximum, no dynamic transition is seen. Thus, different dynamic behavior is seen upon crossing distinct segments of the same critical line. Our explanation for this result is that the structural difference on both sides of the critical line, in the region of higher chemical potential, is not enough to provoke a change in diffusivity.
In summary, our results indicate that dynamic transition and criticality are not directly associated. Instead, the fragile-to-strong transition (and possibly strong-to-strong or even a fragile-to-fragile transitions) is the result of an expressive change in the structure of the liquid and of polymorphism An07 .
ACKNOWLEDGMENTS
We thank for financial support the Brazilian science agencies CNPq and Capes. This work is partially supported by CNPq, INCT-FCx.
References
- (1) M. Chaplin, Sixty-three anomalies of water, http://www.lsbu.ac.uk/water/anmlies.html, 2006.
- (2) C. A. Angell, E. D. Finch, and P. Bach, J. Chem. Phys. 65, 3065 (1976).
- (3) P. A. Netz, F. W. Starr, H. E. Stanley, and M. C. Barbosa, J. Chem. Phys. 115, 344 (2001).
- (4) P. H. Poole, F. Sciortino, U. Essmann, and H. E. Stanley, Nature (London) 360, 324 (1992).
- (5) O. Mishima and H. E. Stanley, Nature (London) 396, 329 (1998).
- (6) O. Mishima, L. D. Calvert, and W. E., Nature 310, 393 (1984).
- (7) O. Mishima and Y. Suzuki, Nature 419, 599 (2002).
- (8) R. Martonak, D. Donadio, and M. Parrinello, Phys. Rev. Lett. 92, 225702 (2004).
- (9) R. S. Smith and B. D. Kay, Nature 398, 788 (1999).
- (10) A. Faraone, L. Liu, C.-Y. Mou, C. W. Yen, and S. H. Cen, J. Chem. Phys. 121, 10843 (2004).
- (11) L. Liu, S.-H. Chen, A. Faraone, S.-W. Yen, and C.-Y. Mou, Phys. Rev. Lett. 95, 117802 (2005).
- (12) L. Xu et al., Proc. Natl. Acad. Sci. U.S.A. 102, 16558 (2005).
- (13) C. A. Angell, J. Res. Natl. Inst. Stand. Technol. 102, 171 (1997).
- (14) P. Kumar, G. Franceze, and H. E. Stanley, Phys. Rev. Lett. 100, 105701 (2008).
- (15) M. Szortyka, M. Girardi, V. B. Henriques, and M. C. Barbosa, J. Chem. Phys. 130, 184902 (2009).
- (16) M. Szortyka, M. Girardi, V. B. Henriques, and M. C. Barbosa, J. Chem. Phys. 132, 134904 (2010).
- (17) G. M. Bell and D. A. Lavis, J. Phys. A 3, 568 (1970).
- (18) D. A. Lavis, J. Phys. C 6, 1530 (1973).
- (19) M. A. A. Barbosa and V. B. Henriques, Phys. Rev. E 77, 051204 (2008).
- (20) A. P. Young and D. A. Lavis, J. Phys. A 12, 229 (1979).
- (21) B. W. Southern and D. A. Lavis, J. Phys. A 13, 251 (1980).
- (22) C. E. Fiore, M. M. Szortyka, M. C. Barbosa, and V. B. Henriques, J. Chem. Phys. 131, 164506 (2009).
- (23) M. M. Szortyka, M. Girardi, and M. C. Barbosa, Physica A 380, 27 (2007).
- (24) C. A. Angell, J. Phys:. Condens. Matter 19, 205112 (2007).