Carrier localization mechanisms in InGaN/GaN quantum wells
Abstract
Localization lengths of the electrons and holes in InGaN/GaN quantum wells have been calculated using numerical solutions of the effective mass Schrödinger equation. We have treated the distribution of indium atoms as random and found that the resultant fluctuations in alloy concentration can localize the carriers. By using a locally varying indium concentration function we have calculated the contribution to the potential energy of the carriers from band gap fluctuations, the deformation potential and the spontaneous and piezoelectric fields. We have considered the effect of well width fluctuations and found that these contribute to electron localization, but not to hole localization. We also simulate low temperature photoluminescence spectra and find good agreement with experiment.
pacs:
73.20.Fz, 73.21.Fg, 31.50-x, 77.65.LyDespite the relatively high dislocation density in InGaN/GaN quantum well (QW) structures grown on c-plane sapphire, the room temperature photoluminescence (PL) efficiency of such QWs can be very high Nakamura (1998). This is generally attributed to localization of the carriers which reduces the effect of non-radiative recombination at the dislocations Chichibu et al. (1997); Teo et al. (1998); Davidson et al. (2000). The precise nature of this localization is still however a matter of debate. Three possible causes of carrier localization that have been widely cited are well width fluctuations Grandjean et al. (2001); Dhar et al. (2002); Graham et al. (2005), random alloy fluctuations Nguyen et al. (2004) including In-N-In chains Bellaiche et al. (1999), and indium clustering Gerthsen et al. (2000); Cheng et al. (2004). Smeeton et al. have shown however that gross indium clustering observed in TEM images of InGaN QWs can be caused by electron beam damage Smeeton et al. (2003).
In this work we present the results of theoretical calculations which demonstrate the importance of random fluctuations in alloy composition, and of well width fluctuations. Previous theoretical work on carrier localization has considered the properties of bulk InGaN with or without embedded InGaN quantum dots (QDs) Wang (2001); Kent and Zunger (2001). Using an atomistic empirical pseudo-potential method they found that in bulk zinc-blende InGaN hole wave-functions are localised by alloy fluctuations alone, and that the electron wave-functions required a dot, or cluster like confinement to be localised. The properties of these bulk zinc-blende materials are expected to differ from those in the wurtzite QW structures we consider because of the effect of the large strain, and piezoelectric field across the QW in the case of wurtzite materials.
Our method is to calculate the potential energy landscape of the QW using a random distribution of indium atoms. Once we have calculated this potential energy we solve the effective mass Schrödinger equation using the finite difference approximation to find the energy eigenvalues and wave-functions of the carriers. Performing this calculation for different distributions of indium atoms and averaging the results reveals the mean localization lengths for electrons and holes.
Experimental results showing the random nature of the indium distribution and the occurrence of well width fluctuations are described in Section I. Our calculations of the carrier potential energy and the subsequent solution of the Schrödinger equation are described in Section II, and the results of these calculations are discussed in Section III.
I Microstructural data
In order to model the localization of carriers in InGaN QWs, a realistic description of their nanoscale structure is required. Here, we base our model on the experimental data of InGaN QWs gained by Galtrey et al. Galtrey et al. (2007, 2008) using atom probe tomography (APT). APT has two major advantages over conventional transmission electron microscopy (TEM) studies of InGaN QW microstructures: firstly, the three-dimensional nature of the APT data set is more appropriate to the development of a three-dimensional model than the two-dimensional projections usually recorded in TEM, and secondly the high energy electron beam used in TEM has been reported Smeeton et al. (2003) to rapidly damage InGaN QWs, resulting in potentially unreliable structural data. We will outline the key results of APT studies of InGaN quantum wells grown at a single temperature, and highlight the specific features of the APT dataset that we have used as an input to our model.
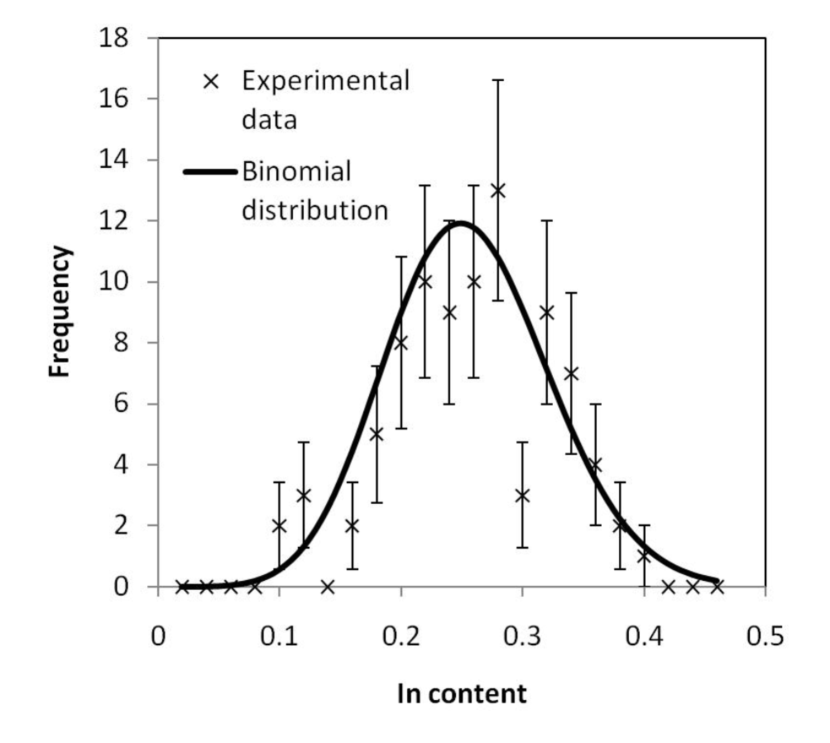
For quantum wells grown at a single temperature, with and , the APT data revealed the InxGa1-xN within the quantum well to be a random alloy Smeeton et al. (2003). The experimentally-determined distribution of indium atoms within the quantum well was compared to the expected binomial distribution for a random alloy. Figure 1 shows this comparison for a typical quantum well sample. A test was used to assess whether there was any statistically significant deviation from the random distribution, but no evidence was found for any indium clustering Galtrey et al. (2007). Hence, in our calculations, the InGaN within the QW has been modeled as having a random, uncorrelated indium distribution.
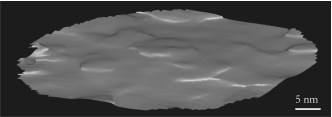
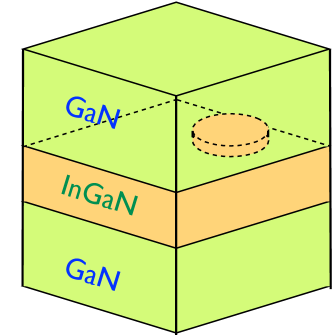
Further APT studies Galtrey et al. (2008) revealed important information regarding the two QW interfaces. We describe the interface in which the InGaN is grown on the GaN as the lower interface and the interface at which the InGaN is capped with more GaN as the upper interface. The lower interface was found to be both smooth and abrupt. In contrast, the upper interface was both more diffuse and rougher Galtrey et al. (2008). In indium iso-concentration surfaces illustrating the upper interface, such as that shown in Fig.2, islands one to two monolayers high and a few nanometers across were observed on the InGaN surface, and this observation was supported by other data from TEM Graham et al. (2005) and atomic force microscopy (AFM) Galtrey et al. (2008). In our model, we have included islands at the upper interface similar to those observed experimentally, since the well width fluctuations (WWFs) the islands cause have previously been predicted to significantly affect carrier localization Grandjean et al. (2001); Dhar et al. (2002); Graham et al. (2005). We have investigated the effect of nm diameter, one mono-layer thick disk-shaped WWFs in our calculations, as schematically demonstrated in Fig. 2. We have not included interface diffuseness in our model, but since this diffuseness is homogeneous in the plane of the QW we expect this to have a less pronounced effect on the localization than the WWFs.
II Theory
To investigate the localization of the carriers in these structures the carrier wave functions are calculated by solution of the effective mass Schrödinger equation. This method requires knowledge of the potential energy for the carriers. Our calculation of the potential energy of the carriers includes the effects of the band offset between InN and GaN, the spontaneous polarization, the piezoelectric field, and the deformation potential. As this potential varies spatially in all three dimensions, this potential energy can be referred to as an “energy landscape”. We discuss the calculation of the potential energy in section II.1 and the solution of the Schrödinger equation in II.2.
II.1 Potential Energy Landscape
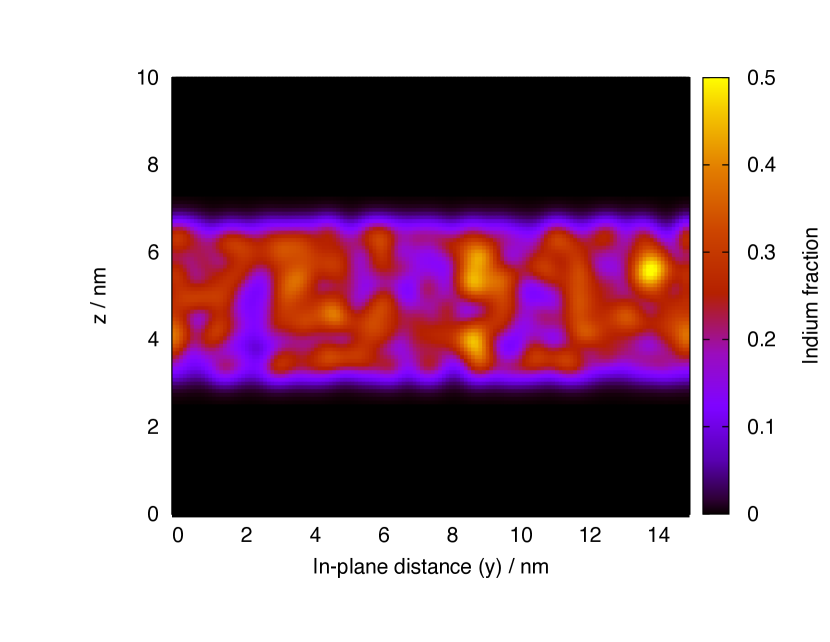
The potential energy landscape depends critically on the distribution of indium atoms. As described above we take the indium atoms to be distributed randomly in the QW. For the continuum strain mechanics we employ, the indium distribution must be described by a smoothly varying concentration function. To calculate this concentration function we first occupy cation lattice sites with indium atoms with probability equal to the nominal concentration. We use Gaussian functions with a standard deviation equal to the cation lattice spacing to smooth this positional data. An example of the resulting indium concentration function, , is shown in Fig. 3. The fluctuations in indium fraction seen in Fig. 3 arise naturally from the random distribution of indium atoms and is fundamental to the calculations which follow. It should be noted that the maxima of the indium concentration seen in Fig. 3 are not due to individual indium atoms, but instead represent the averaged effect of several indium atoms lying close to one another; this can be confirmed by examining the distance scales on the axes of the plot.
These fluctuations in local indium fraction are responsible for the local variations in quantum confinement. To calculate this locally varying band gap we use the quadratic approximation,
| (1) |
, and , are the energy gaps in InN and GaN respectively, and is the bowing parameter. These parameters and all the relevant mechanical constants are taken, or derived, from Vurgaftman and Meyer’s review article Vurgaftman and Meyer (2003), and the effective mass parameters are from Rinke at al. Rinke et al. (2008).
The strength of the spontaneous polarization which occurs in wurtzite structures also depends on the indium concentration and we describe the polarization using a linear approximation,
| (2) |
We can also write this as
| (3) |
As the polarization is purely in the z direction, we can write . This can be used in Poisson’s equation,
| (4) |
which, after taking the Fourier transform, gives
| (5) |
for the corresponding electrostatic potential. This contribution is evaluated numerically and transformed to real space using a fast Fourier transform (FFT).
Further to this the lattice constants of InN and GaN differ, so that the fluctuating indium distribution causes an inhomogeneous strain field. This strain causes a deformation potential and a large piezoelectric field. We use a Green’s function method to find the strain field, and the following description closely follows that by Andreev et al. Andreev et al. (1999). The Green’s tensor gives the displacement at in the direction , due to a unit point force in direction placed at the origin. For an infinite anisotropic, homogeneous elastic medium, it is the solution to the equation Landau and Lifshitz (1986)
| (6) |
For small deformations we are then able to write an expression for the strain tensor in terms of the Green’s function and concentration function, . We solve for the Green’s function by Fourier transform and obtain an expression for the strain in Fourier space. By numerical evaluation of this function, and by performing a FFT we are able to calculate the real space strain distribution due to the inhomogeneous indium concentration function.
The deformation potential accounts for the change in energy levels due to this strain. To calculate the deformation potential the band gap energy is given in terms of the deformation potentials, and , and the strain tensor by:
| (7) |
where the dependance is implicit Wagner and Bechstedt (2002).
Once we have calculated the strain in the material finding the piezoelectric field is straightforward. The polarization caused by the piezoelectric effect can be written as , where is the piezoelectric tensor. Poisson’s equation is solved in the same manner as for the spontaneous polarization.
II.2 Carrier Wavefunctions
The carrier wave functions and energy eigenvalues are obtained by solution of the effective mass Schrödinger equation,
| (8) |
where we use an anisotropic, inhomogeneous effective mass. The hole in-plane (perpendicular to the c-axis) effective mass increases rapidly away from the band edge Shields et al. (2001); Kim et al. (1997) and 1-D calculations for the c-plane QW samples detailed below revealed holes meV away from the band edge. To avoid the use of prohibitively expensive iterative methods we have assumed far from the band edge hole effective masses as given by Chuang and Chang Chuang and Chang (1996).
As our potential energy has already been evaluated numerically, it is a straightforward exercise to solve this equation using a finite difference method, with periodic boundary conditions on the wavefunction. The resulting sparse matrix eigenvalue problem is solved using the ARPACK subroutine library Lehoucq et al. (1998). This allows us to find the lowest energy eigensolutions of the system.
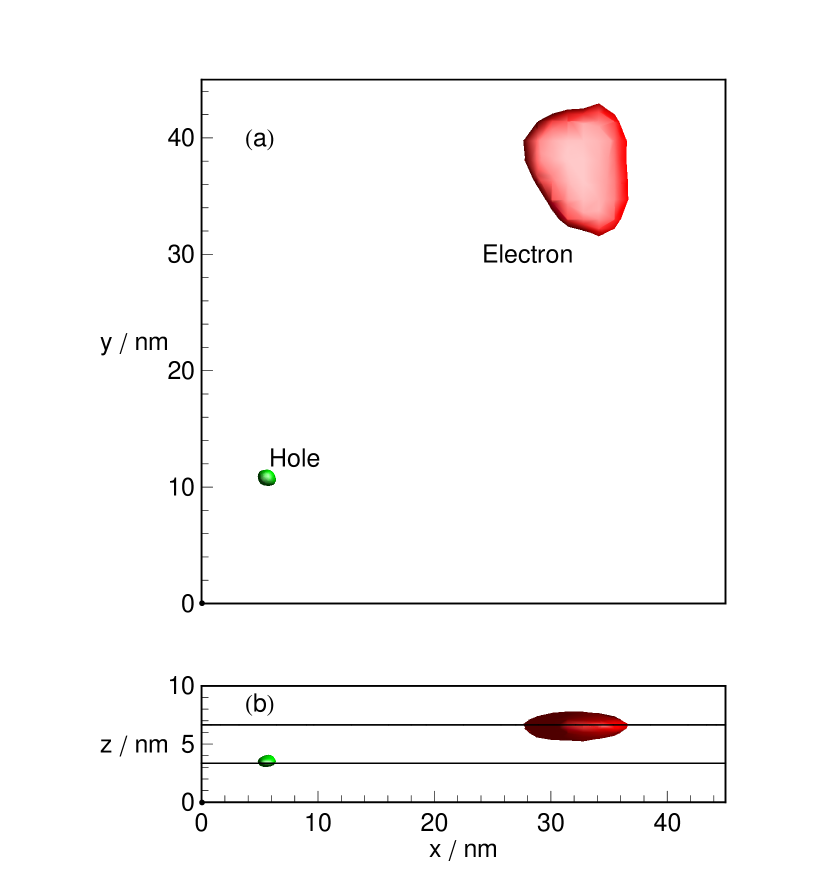
In Fig. 4 we show the calculated ground state probability density of an electron (red) and a hole (green); they were calculated for a 3nm wide 25%-indium QW, and are clearly localised on a scale of just a few nanometers. While Fig. 4 shows both hole and electron wavefunctions it should be noted that the interactions between them is not included in these calculations. To quantify this localization we define our localization length as , using the standard quantum mechanical expression
| (9) |
where
| (10) |
III Results and Discussion
To investigate the localization properties of the carriers we performed the calculations described above for different random distributions of indium atoms. Calculation system sizes of nm were used to find the 15 lowest energy hole states for 45 different distributions. The four lowest energy electron states were calculated in 65 larger nm systems owing to the larger localization lengths of these states. The systems studied were 3nm thick QWs which varied in average indium composition between 5% and 25%. We investigate the effect of the local fluctuations in indium concentration in polar (c-plane) QWs, monolayer WWFs as described in section I, and matching non-polar (a- or m-plane) samples.
The mean localization lengths , as defined in Eq. 9, for the lowest energy hole and electron eigenstates are plotted against the nominal indium fraction in Figs 5(a) and 5(b) respectively. Considering the effects of indium fluctuations only, the hole wavefunctions show a constant localization length of nm across the range of indium concentrations. The electrons show an increasing localization length from nm for the 25% indium sample, to nm for the 5% indium sample. This trend of increasing localization length with decreasing nominal indium concentration is caused by the reduction in magnitude of the fluctuations (strictly the standard deviation of the concentration distribution decreases) as the nominal concentration gets smaller. The holes do not display this behavior as the larger hole effective mass means they are less sensitive to the changing depth of fluctuations. The difference in overall localization length-scale can also be attributed to the difference in the effective mass between the electrons and holes.
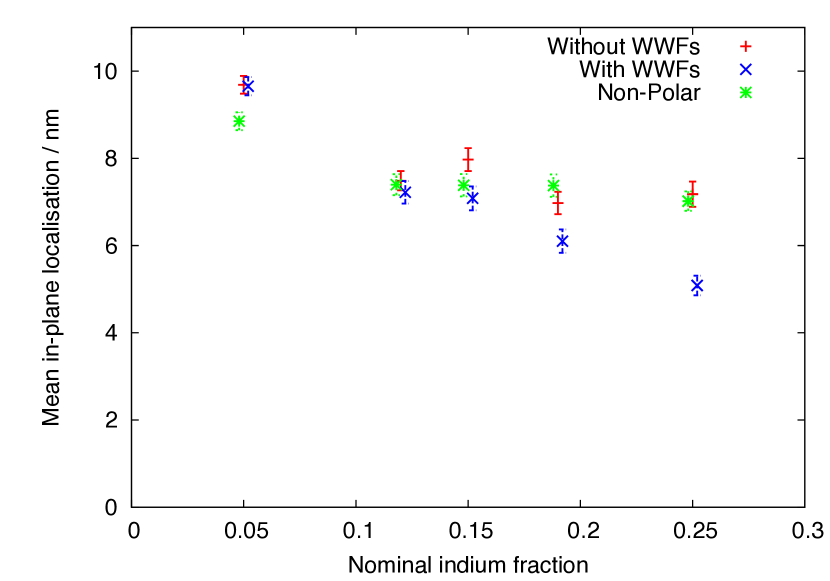
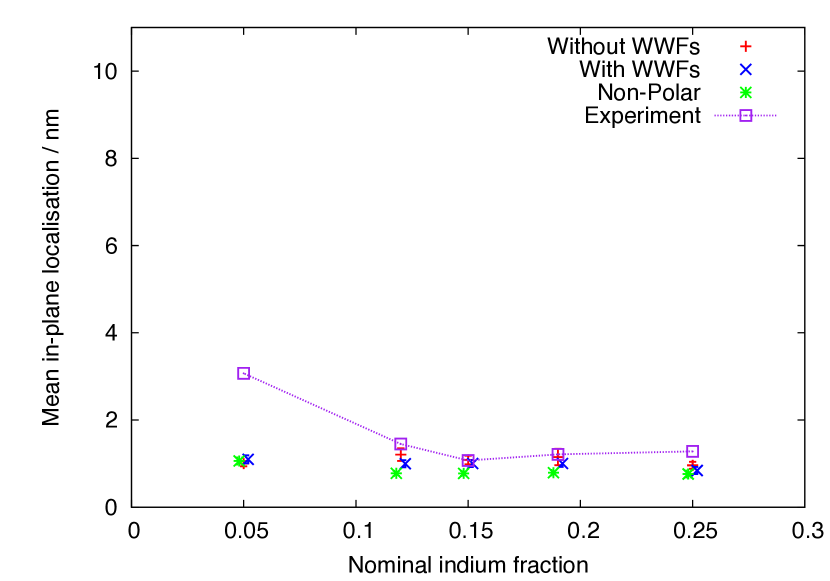
When we consider the added contribution of WWFs on the carrier localization lengths we see a marked difference in their effect on electrons and holes. The mean localization length for the electrons in the 25% indium sample is reduced by a third with the introduction of this WWF, whereas for the holes the WWF has almost no effect on the localization. This difference arises from the effect of the electric field, which causes the holes to be localised on the smoother (lower) interface, and the electrons to be localised on the rougher (upper) interface. It should be noted that the holes are localised on a shorter length scale than the WWF. The effect of the large electric field across the QW was investigated by comparing the polar results with calculations on QWs in a non-polar (a- or m-plane) orientation. For the polar QWs we have neglected the excitonic interaction, which is justified in wide wells due to the separation of the carriers caused by the electric field. This is not the case in non-polar QWs; nevertheless the calculations provide at least qualitative information about carrier localization in such structures. We also only consider the effect of alloy fluctuations in this orientation, not WWFs. We see that again the hole localization lengths are unchanged throughout the range of concentrations investigated. The electron localization is also unchanged, suggesting the electric field has little effect on carrier localization. At this stage we have not yet considered the effect of the electric field on electron localisation in the presence of WWFs. We have also compared our results with the localization lengths of Graham el. al. Graham et al. (2005) in Fig. 5(a). They obtained Huang-Rhys factors from the strength of the LO-phonon replicas in PL spectra at low temperature and compared these with the results of calculations which assumed Gaussian wave functions for the localised carriers. This allowed them to estimate the carrier localization lengths. These show encouraging agreement with our hole localization results, which may demonstrate that the relevant localization length being probed in the experiment is that of the holes.
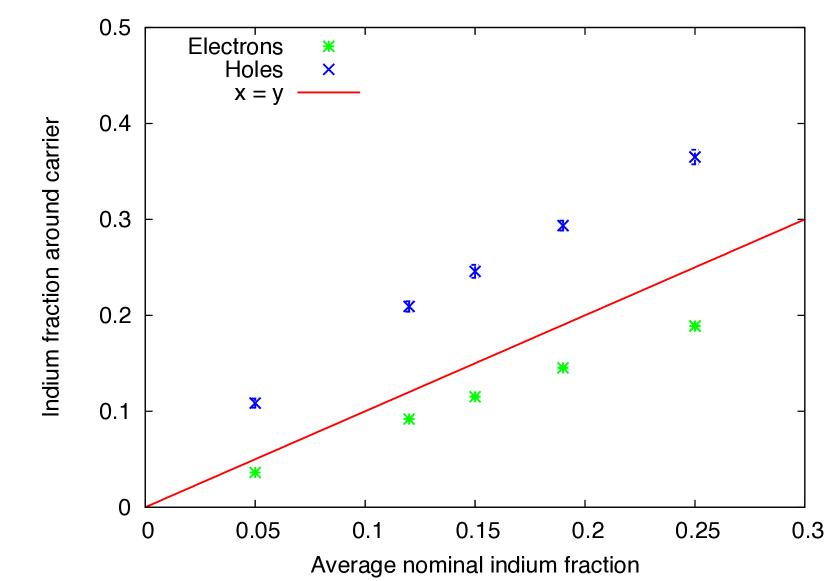
Considering only the polar QWs with no WWFs, Fig 6 shows the mean indium fraction in the neighborhood of the localised carriers for each nominal concentration. We are able to calculate this by comparing the local concentration function for the sample with the calculated wave functions, and take the neighborhood of the carrier to be within one standard deviation of the peak of the wave function. Figure 6 clearly indicates that the holes are localised in naturally occurring regions of higher indium concentration. In the nominally 25% sample for example, the mean indium concentration under the lowest energy hole wave functions was 37%. It should once again be noted that these above average indium regions occur due to random fluctuations in composition. The mean indium concentration around the electrons in this sample was approximately 19%. This is lower than the nominal concentration as the electron wave functions penetrate into the barrier.
We can approximate the localization energies of the carriers by fitting the density of localised states with stretched exponentials,
| (11) |
where for the holes and for the electrons. We find the localization energy () of the holes in the 25% indium c-plane sample without WWFs to be meV, and meV for the electrons. This again emphasizes the stronger localization of the holes in these structures.
All of our results point towards a picture of localization in which the holes are strongly localised by statistical fluctuations in indium concentration, and electrons are localised on a longer length-scale by a combination of these alloy fluctuations, and well width fluctuations. However including the coulombic interaction may change this picture, as the strongly localised holes may “bind” electrons to them.
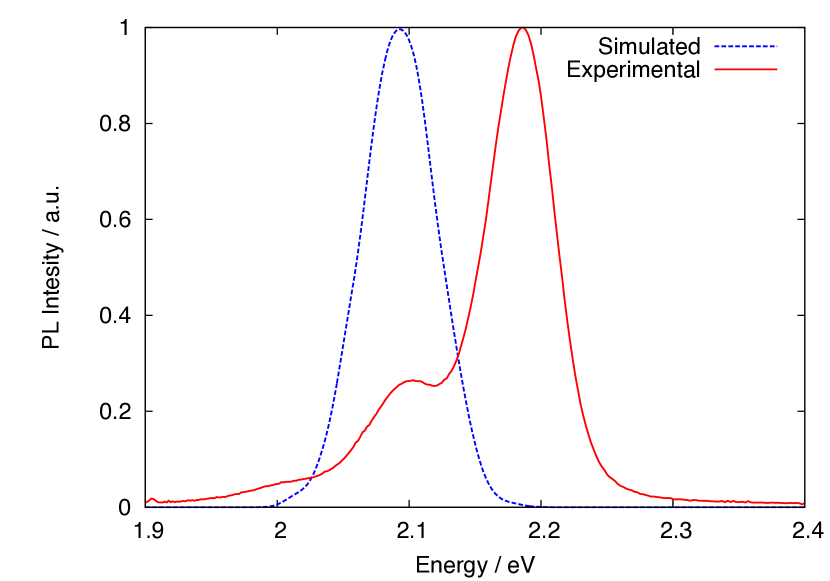
Our calculations allow us to determine the oscillator strengths and energies of photons emitted during recombination. To ensure that we included all of the localised hole states within a given sample, we performed the calculation in a slightly smaller system, and calculated more states. We calculated 4 of the lowest energy electron states in 50 nm samples, and 35 hole states in 800 nm samples. We approximate the low temperature PL spectra of the samples by assuming that the localised states are all occupied by carriers, and by convolving the discrete recombinations with Gaussians of standard deviation 7meV. This width is chosen to be small enough for it not to affect the width of the final spectrum, but large enough for the spectrum to be relatively smooth. Note that due to the finite size of the system there will be long wavelength fluctuations in the indium concentration which are neglected. The effect of these would be to broaden the low energy tail slightly. Comparison of our calculated PL spectrum for a single 3.3nm thick 25% indium QW with no WWFs with an experimental PL spectrum of a nominally identical sample is shown in Fig. 7. The width of the peaks, often attributed to localization effects, compare very well: the simulated PL has a FWHM of 69meV, and the FWHM of the experimental PL is 63meV. In our calculations the strong hole localization is the cause of this broadening. The low energy features in the experimental PL are LO phonon replicas of the main peak and do not appear in the simulated spectrum as we have not included the electron-phonon interaction in our calculations. Including the effects of WWFs increases this broadening on the low energy side of the peak, but the effect is much smaller than that caused by the hole localization. With allowance for the uncertainty in the experimental determination of, for example, the piezoelectric coefficients, the peak energies also agree reasonably well.
IV Summary
We have been able to build a picture of the localization of the carriers in InGaN/GaN QWs by performing effective mass calculations for different random distributions of indium atoms. We have found that the holes are strongly localised in regions of above average indium content. The electrons are less strongly localised by the indium fluctuations, but become more localised by mono-layer well width fluctuations. Our work demonstrates carrier localization without the need for gross indium clusters, which goes some way to explaining the carrier localization mechanisms which are so important for the operation of InGaN optoelectronic devices.
Acknowledgements.
We acknowledge the financial support by the UK Engineering and Physical Sciences Research Council, grant references EP/E035191/1 and EP/E035167/1. RAO would like to acknowledge financial support from the Royal Society.References
- Nakamura (1998) S. Nakamura, Science 281, 956 (1998).
- Chichibu et al. (1997) S. Chichibu, K. Wada, and S. Nakamura, Appl. Phys. Lett. 71, 2346 (1997).
- Teo et al. (1998) K. L. Teo, J. S. Colton, P. Y. Yu, E. R. Weber, M. F. Li, W. Liu, K. Uchida, H. Tokunaga, N. Akutsu, and K. Matsumoto, Appl. Phys. Lett. 73, 1697 (1998).
- Davidson et al. (2000) J. Davidson, P. Dawson, T. Wang, T. Sugahara, J. Orton, and S. Sakai, Semiconductor Science and Technology 15, 497 (2000).
- Grandjean et al. (2001) N. Grandjean, B. Damilano, and J. Massies, Journal of Physics: Condensed Matter 13, 6945 (2001).
- Dhar et al. (2002) S. Dhar, U. Jahn, O. Brandt, P. Waltereit, and K. H. Ploog, Phys. Status Solidi (a) 192, 85 (2002).
- Graham et al. (2005) D. M. Graham, A. Soltani-Vala, P. Dawson, M. J. Godfrey, T. M. Smeeton, J. S. Barnard, M. J. Kappers, C. J. Humphreys, and E. J. Thrush, J. Appl. Phys. 97, 103508 (2005).
- Nguyen et al. (2004) D.-P. Nguyen, N. Regnault, R. Ferreira, and G. Bastard, Solid State Communications 130, 751 (2004).
- Bellaiche et al. (1999) L. Bellaiche, T. Mattila, L.-W. Wang, S.-H. Wei, and A. Zunger, Appl. Phys. Lett. 74, 1842 (1999).
- Gerthsen et al. (2000) D. Gerthsen, E. Hahn, B. Neubauer, A. Rosenauer, O. Schön, M. Heuken, and A. Rizzi, Phys. Status Solidi (a) 177, 145 (2000).
- Cheng et al. (2004) Y.-C. Cheng, E.-C. Lin, C.-M. Wu, C. C. Yang, J.-R. Yang, A. Rosenauer, K.-J. Ma, S.-C. Shi, L. C. Chen, C.-C. Pan, et al., Appl. Phys. Lett. 84, 2506 (2004).
- Smeeton et al. (2003) T. M. Smeeton, M. J. Kappers, J. S. Barnard, M. E. Vickers, and C. J. Humphreys, Appl. Phys. Lett. 83, 5419 (2003).
- Wang (2001) L.-W. Wang, Phys. Rev. B 63, 245107 (2001).
- Kent and Zunger (2001) P. R. C. Kent and A. Zunger, Appl. Phys. Lett. 79, 1977 (2001).
- Galtrey et al. (2007) M. J. Galtrey, R. A. Oliver, M. J. Kappers, C. J. Humphreys, D. J. Stokes, P. H. Clifton, and A. Cerezo, Appl. Phys. Lett. 90, 061903 (2007).
- Galtrey et al. (2008) M. J. Galtrey, R. A. Oliver, M. J. Kappers, C. J. Humphreys, P. H. Clifton, D. Larson, D. W. Saxey, and A. Cerezo, J. Appl. Phys. 104, 013524 (2008).
- Vurgaftman and Meyer (2003) I. Vurgaftman and J. R. Meyer, J. Appl. Phys. 94, 3675 (2003).
- Rinke et al. (2008) P. Rinke, M. Winkelnkemper, A. Qteish, D. Bimberg, J. Neugebauer, and M. Scheffler, Phys. Rev. B 77, 075202 (2008).
- Andreev et al. (1999) A. D. Andreev, J. R. Downes, D. A. Faux, and E. P. O’Reilly, J. Appl. Phys. 86, 297 (1999).
- Landau and Lifshitz (1986) L. Landau and E. Lifshitz, Theory of Elasticity, Landau and Lifshitz Course of Theoretical Physics; Vol. 7 (Pergamon, Oxford, England, 1986), 3rd ed.
- Wagner and Bechstedt (2002) J.-M. Wagner and F. Bechstedt, Phys. Rev. B 66, 115202 (2002).
- Shields et al. (2001) P. Shields, R. Nicholas, F. Peeters, B. Beaumont, and P. Gibart, Phys. Rev. B 64, 081203 (2001).
- Kim et al. (1997) K. Kim, W. Lambrecht, B. Segall, and M. V. Schilfgaarde, Phys. Rev. B 56, 7363 (1997).
- Chuang and Chang (1996) S. L. Chuang and C. S. Chang, Phys. Rev. B 54, 2491 (1996).
- Lehoucq et al. (1998) R. B. Lehoucq, D. C. Sorensen, and C. Yang, ARPACK users’ guide: solution of large-scale eigenvalue problems with implicitly restarted Arnoldi methods (SIAM, 1998).