The dynamics of spiral arms in pure stellar disks
Abstract
It has been believed that spiral arms in pure stellar disks, especially the ones spontaneously formed, decay in several galactic rotations due to the increase of stellar velocity dispersions. Therefore, some cooling mechanism, for example dissipational effects of the interstellar medium, was assumed to be necessary to keep the spiral arms. Here we show that stellar disks can maintain spiral features for several tens of rotations without the help of cooling, using a series of high-resolution three-dimensional -body simulations of pure stellar disks. We found that if the number of particles is sufficiently large, e.g., , multi-arm spirals developed in an isolated disk can survive for more than 10 Gyrs. We confirmed that there is a self-regulating mechanism that maintains the amplitude of the spiral arms. Spiral arms increase Toomre’s of the disk, and the heating rate correlates with the squared amplitude of the spirals. Since the amplitude itself is limited by , this makes the dynamical heating less effective in the later phase of evolution. A simple analytical argument suggests that the heating is caused by gravitational scattering of stars by spiral arms and that the self-regulating mechanism in pure-stellar disks can effectively maintain spiral arms on a cosmological timescale. In the case of a smaller number of particles, e.g., , spiral arms grow faster in the beginning of the simulation (while is small) and they cause a rapid increase of . As a result, the spiral arms become faint in several Gyrs.
Subject headings:
galaxies: kinematics and dynamics — galaxies: spiral — methods: n-body simulations — stellar dynamics1. Introduction
The physical origin and evolution of spiral arms in disk galaxies are long-standing problems of galactic astronomy. The most widely known theory is the Lin-Shu hypothesis, in which spiral structures are interpreted as stationary density waves with a constant pattern speed in a stellar disk (Lin & Shu, 1964; Bertin & Lin, 1996). However, as pointed out by Toomre (1969), Lin-Shu’s mechanism has a serious problem, such that the energy and angular momentum of the tightly wound spiral waves radially propagate with the group velocity, and the waves are absorbed at the inner Lindblad resonance. Therefore, a continuous generating mechanism is necessary to maintain the stationary density waves, e.g., WASER mechanism; an outward-traveling wave is reflected and transmitted into other traveling waves at the co-rotation resonance (Mark, 1976). Alternatively, it has been proposed that spiral arms grow from small-scale disturbances through the swing amplification mechanism (Goldreich & Lynden-Bell, 1965; Julian & Toomre, 1966; Toomre, 1981). In this picture, spiral arms are recurrent and transient rather than stationary (Toomre, 1990; Toomre & Kalnajs, 1991). Previous -body simulations supported the recurrent and transient spirals, especially for multi-arm spirals (Sellwood & Carlberg, 1984; Sellwood, 2000; Sellwood & Binney, 2002; Fuchs et al., 2005; Sellwood, 2010) and also for barred-spirals (Baba et al., 2009).
While -body simulations both with and without gas showed the recurrent and transient spiral arms (Sellwood & Carlberg, 1984; Carlberg & Freedman, 1985; Elmegreen & Thomasson, 1993; Bottema, 2003; Baba et al., 2009), Sellwood & Carlberg (1984) pointed out that spiral arms in pure stellar disks (i.e., without gas) disappeared in several galactic rotations. They performed two-dimensional -body simulations and showed that stars scattered by spiral arms heated up the disk (increase Toomre’s value), and thereby spiral arms disappeared. They argued that some dynamical cooling mechanism was necessary to maintain the spiral arms. They showed that when new stars with circular orbits (i.e., with zero velocity dispersion) were added to the stellar disk with a constant rate, the spirals were maintained for about 10 galactic rotations. This demonstration was based on the idea that stars are formed from the interstellar medium (ISM) with a small velocity dispersion. After their work, the effects of gas and star formation were investigated for cooling and also heating (Elmegreen & Thomasson, 1993; Bottema, 2003). In addition, Bottema (2003) proposed that the filaments of gas trigger the swing amplification (Toomre, 1981) and enhance stellar spiral arms.
However, the dynamical effect of the ISM to stellar spirals is not well understood yet. Recently, Baba et al. (2009) showed that the multi-phase ISM in a stellar disk, in which spiral arms are self-excited, has a complicated velocity field, and the cold, dense gas like the giant molecular clouds (GMCs) has large non-circular motions. Therefore, the newly born stars are not necessarily dynamically cold. Furthermore, since the mass fraction of gas in galactic disks is typically only 10%, it is natural to assume that the stellar component controls the dynamics of the disk. Indeed, Elmegreen & Thomasson (1993) performed two-dimensional -body simulations including gas particles and concluded that the stellar -value controls the formation of spiral structures.
Although Sellwood & Carlberg (1984) reported that the stellar disks are heated up significantly in several galactic rotations, we should be careful on the effect of numerical artifacts. In particular, the number of particles used in their -body simulations is only 2. In such simulations, two-body relaxation might have significantly enhanced the decay of spiral arms. Donner & Thomasson (1994) also performed similar simulations for stellar disks with spiral arms. The number of particles was . They argued that their spiral arms were long-lived. However the lifetime was only several galactic rotations. Their simulations have the same problems as those of Sellwood & Carlberg (1984). Therefore, three-dimensional -body simulations with a large number of particles are necessary to investigate the long-term evolution of stellar disks. Such simulations are now feasible, thanks to the progress of computers and numerical methods. However, recent simulations of galactic disks have focused on evolution of spiral galaxies including gas (Bottema, 2003; Baba et al., 2009). There are also pure -body simulations of disks with a large number of particles such as (Sellwood, 2010), but they still use two-dimensional approximation and the particle-mesh method with a grid size of (Sellwood & Binney, 2002). Three-dimensional calculations focused on the evolution of stellar bars (Athanassoula et al., 2005; Dubinski et al., 2009; Sellwood & Debattista, 2009). Thus, it is important to investigate the basic physics of pure stellar disks using three-dimensional -body simulations with a high enough resolution.
In this paper, we report the result of high-resolution -body simulations of isolated stellar disks, in which multi-arm spirals spontaneously develop. We describe the method of our -body simulations in Section 2. In Section 3, we show the results of simulations, and discuss the evolution of the spiral arms. We also discuss self-regulated mechanism of spiral arms and how the maximum amplitude of spirals is determined. Section 4 is for summary and discussion.
2. -body simulations
We performed a series of -body simulations of stellar disks in a fixed spherical dark halo potential. Our stellar disk and halo models are based on those in Baba et al. (2009). Here, we briefly summarize the parameters and how we generate the initial equilibrium disks. We adopted the NFW model (Navarro et al., 1997) as the dark halo model with the concentration parameter of the halo, . The virial radius of halo, , is 122 kpc, and the mass within , is . 111 We assume that a spherical region, where the mean density is 200 times as high as a background density, is virialized. As the background cosmology, we adopted a concordance cold dark matter (CDM) model with parameters: , , and km s-1 Mpc-1. The formation redshift of the halo is set to be 1.0. We adopted an exponential disk model as disk models. We varied total disk mass, , and initial at the reference radius (8.6 kpc in our models), . The scale radius, , is 3.4 kpc, and the scale height, , is 0.34 kpc. We performed simulations with four different resolutions, , , , and (hereafter, 30M, 9M, 3M, 1M, and 300k, respectively). We summarized our disk models in Table 1. Hereafter, we regard model b ( and ) as our standard model. The circular velocity of the disk at kpc is about for model b. Its circular velocity profile is shown in Figure 1. We generated initial disk models using the Hernquist method (Hernquist, 1993). Initially, the generated models are not exactly in an equilibrium at the galactic center. Thus, they cause ripples spreading through the disk from the center. To remove the ripples, we integrated the models for a few Gyrs randomizing azimuthal positions of particles every four steps to prevent the growth of spiral arms (McMillan & Dehnen, 2007). After the ripples passed through the disk, we used it as the initial condition.
We used a Burnes-Hut treecode (Barnes & Hut, 1986; Makino, 2004) on GRAPE-7 (Kawai et al., 2006) and GRAPE-DR (Makino et al., 2007). The opening angle, , is 0.4 with the center-of-mass approximation. The maximum group size for a GRAPE calculation (Makino, 1991), , is 2048. For the time integration, we used a leapfrog integrator with a fixed stepsize of Myr for M, 9M, and 1M models and Myr for the other models. The gravitational potential is softened using the usual Plummer softening, with the softening length of pc. This is small enough to resolve the typical spiral structures ( pc). For all runs, the energy error was less than 0.1% throughout the simulations. One may concerned about the drift of the disk in the halo potential because treecodes do not conserve the linear momentum of the system. Therefore, we investigated the position of the density center of the disk and confirmed that the drift does not occur (for the details, see Appendices A and B).
| Model | |||
|---|---|---|---|
| a | 1.1 | 0.050 | 3M/300k |
| b | 1.2 | 0.050 | 30M/9M/3M/1M/300k |
| c | 1.3 | 0.050 | 3M/300k |
| d | 1.4 | 0.050 | 3M/300k |
| e | 1.5 | 0.050 | 3M/300k |
| f | 1.8 | 0.050 | 3M/300k |
| g | 0.5 | 0.050 | 3M |
| h | 1.2 | 0.075 | 3M |
| i | 1.2 | 0.033 | 3M |

3. Evolution of stellar disks
3.1. Evolution of spiral arms
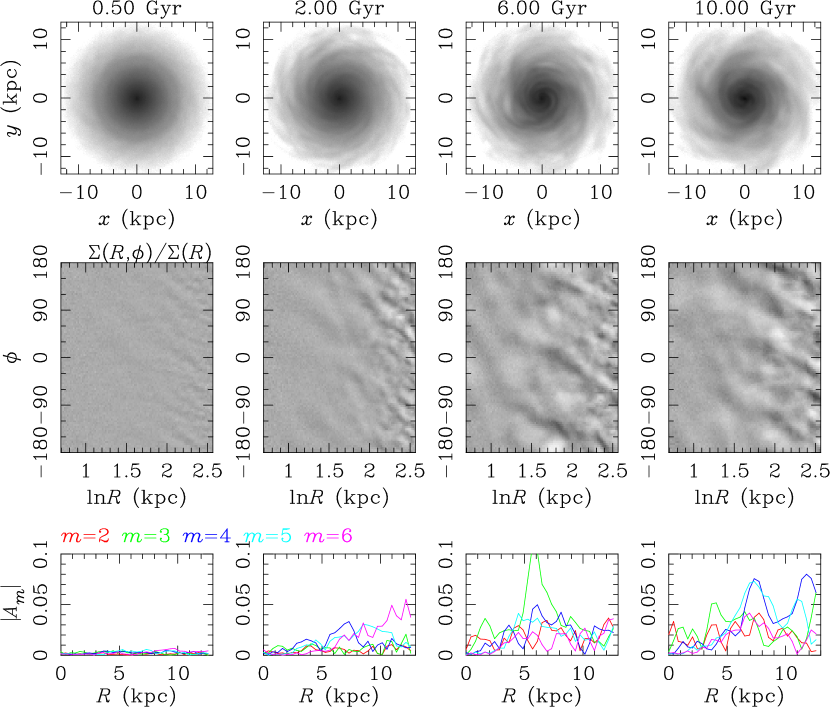
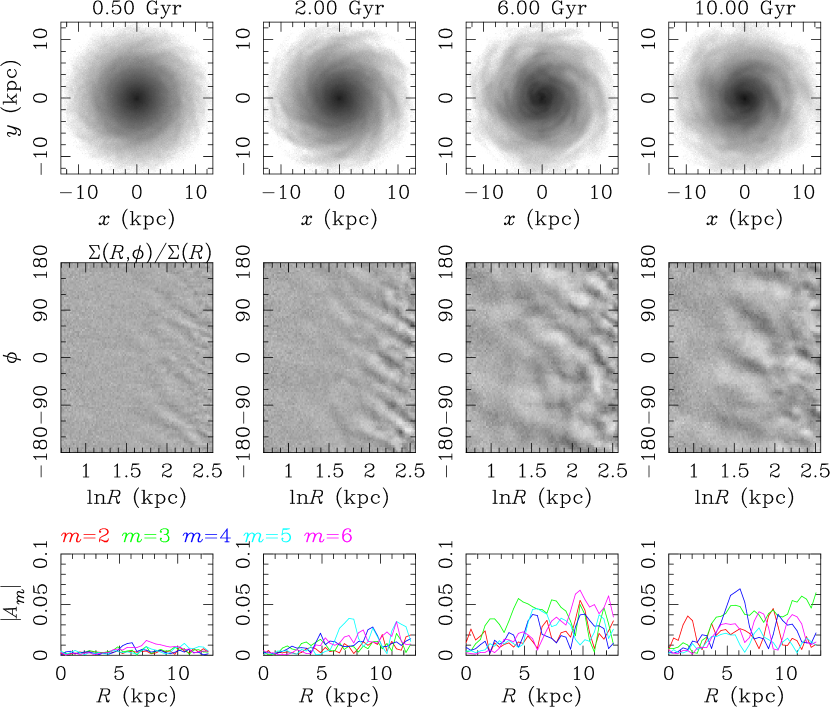
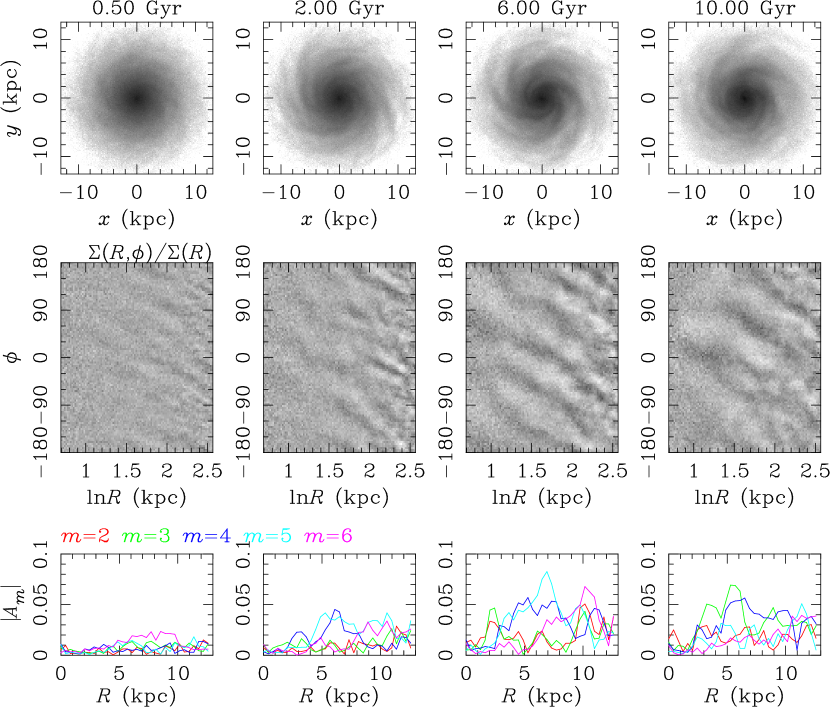
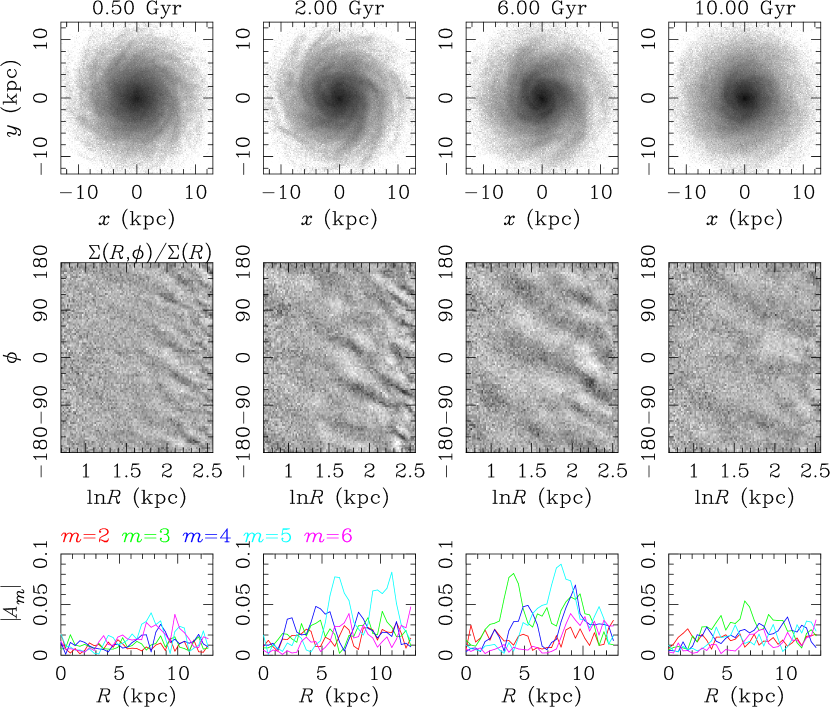
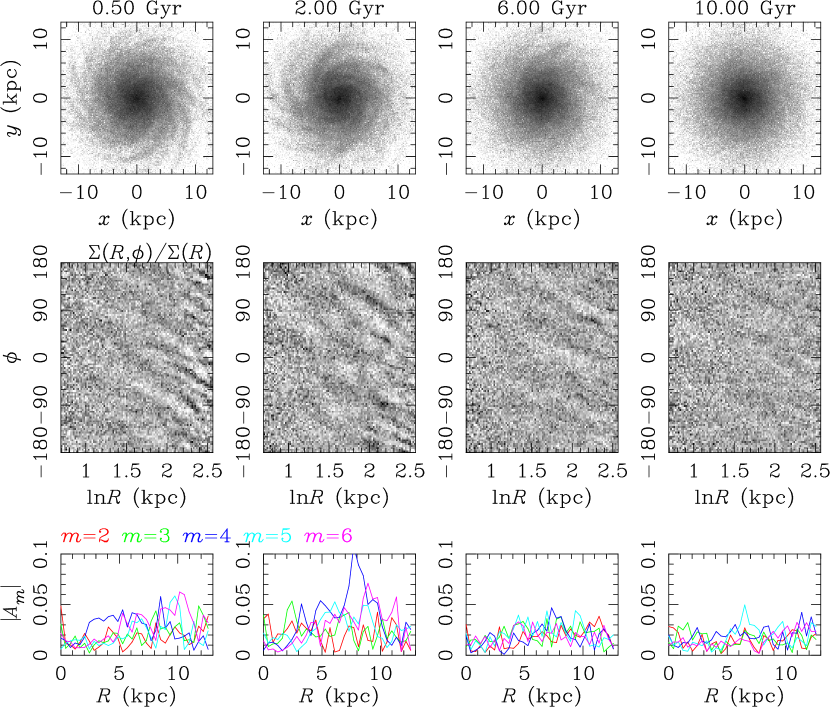
First, we show the evolution of spiral arms of our standard model, model b. Figures 2 – 6 show the evolution of model b for M, 9M, 3M, 1M, and 300k, respectively. Top panels show the surface density of the disk in the Cartesian coordinate. Middle panels show the density contrast, , in the polar coordinate. Here, and are averaged surface density in a polar grid from to and from to and a ring from to , respectively. We used kpc and . Bottom panels show Fourier amplitudes at each radius obtained from a Fourier series:
| (1) |
where is the azimuthal wavenumber (i.e., the number of spiral arms) and is the Fourier amplitude. Only the amplitudes of 2–6 are shown in this figure. Other modes are much smaller than these modes throughout the simulations.
Initially many spiral arms with small amplitudes appear (see Gyr in Figures 2 – 6). Eventually they merge and the amplitude of small wavenumber such as becomes larger. Figure 7 shows the total power, the sum of squared amplitudes defined as , at kpc. The data points are averaged over 0.5 Gyr. In the beginning of the simulations, the total powers grow exponentially from their initial amplitudes, which are determined by Poisson noise. The growth timescale is Gyr. This value is comparable to that in the case of the bar mode (Dubinski et al., 2009). In the case of M, we performed the simulation only to 5 Gyr. However, the evolution in the run is quite similar to those in the runs with M, 9M, and 30M, although the total power grows from a smaller value. The total powers reach their peak values at Gyr for k and Gyr for M. In the case of M, 9M, and 30M, the peak is not clear, but the total powers have developed well at Gyr. Clearly, the dependence on the number of particles exists. In the case of a larger number of particles, it takes more time for the spiral arms to develop because they start from a smaller amplitude of Poisson noise. After the spiral arms have developed, their number is consistent with that expected from the swing amplification theory (Toomre, 1981), in which spiral arms with , where develop most efficiently. In our model b, for .
After Gyr, the amplitudes of k model start to decay (see Figure 7), and the spiral arms almost disappear at Gyr (see Figure 6). The behavior of 1M model is similar to the 300k model. On the other hand, the spiral arms in 3M, 9M, and 30M models are still prominent after 6 Gyr, and their amplitudes are even at the end of the simulation, 10 Gyr, in contrast to in k model (see Figure 4)
Evolutions of the amplitudes of spiral arms are qualitatively different between higher and low resolutions. In k model, the amplitude grows rapidly in the first 2 Gyr, and after this rapid growth it decreases fairly rapidly. On the other hand, the amplitude in M, 9M, and 30M models keeps growing to the end of simulation, i.e., Gyr. The highest resolution run may show the same evolution in Gyr.
We found that spiral arms developed in the disk are not stationary, but timedependent. As shown in Figure 7, the amplitude of the arms in M and 9M models at kpc oscillates quasi-periodically in the timescale of Gyr. Figures 2 – 6 show that all modes of spiral arms are timedependent and the dominant mode changes spatially. Each spiral arm is wound up because of the galactic differential rotation. As a result, the global spiral arms break up into smaller fragments whose sizes are typically a few kpcs. These fragments eventually collide and reconnect with other fragments due to the differential rotation, and the global spiral arms revive. This process of breaking up and reconnection repeats throughout the simulations.
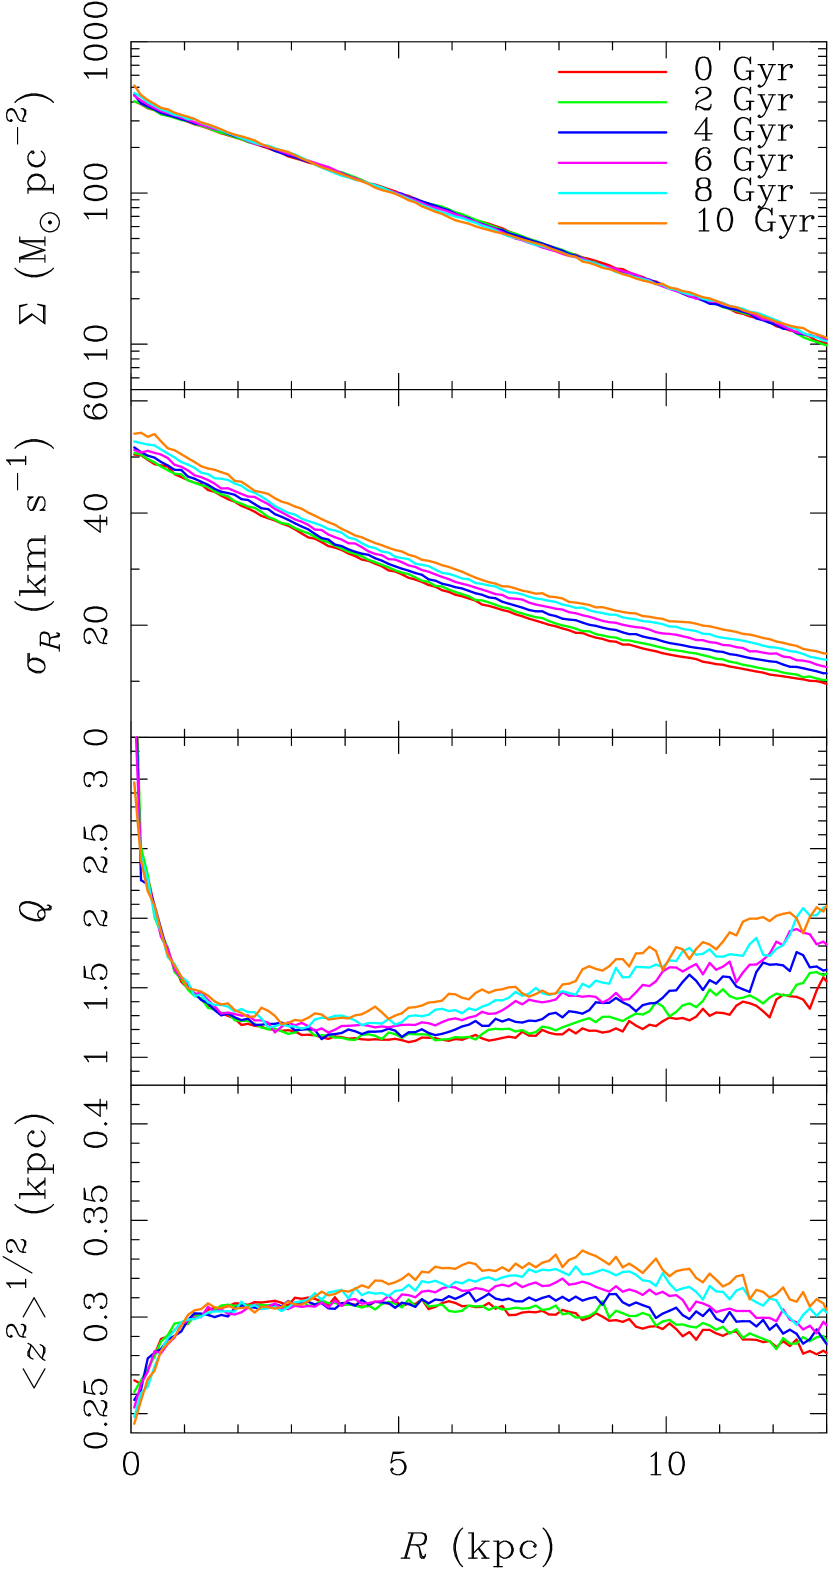
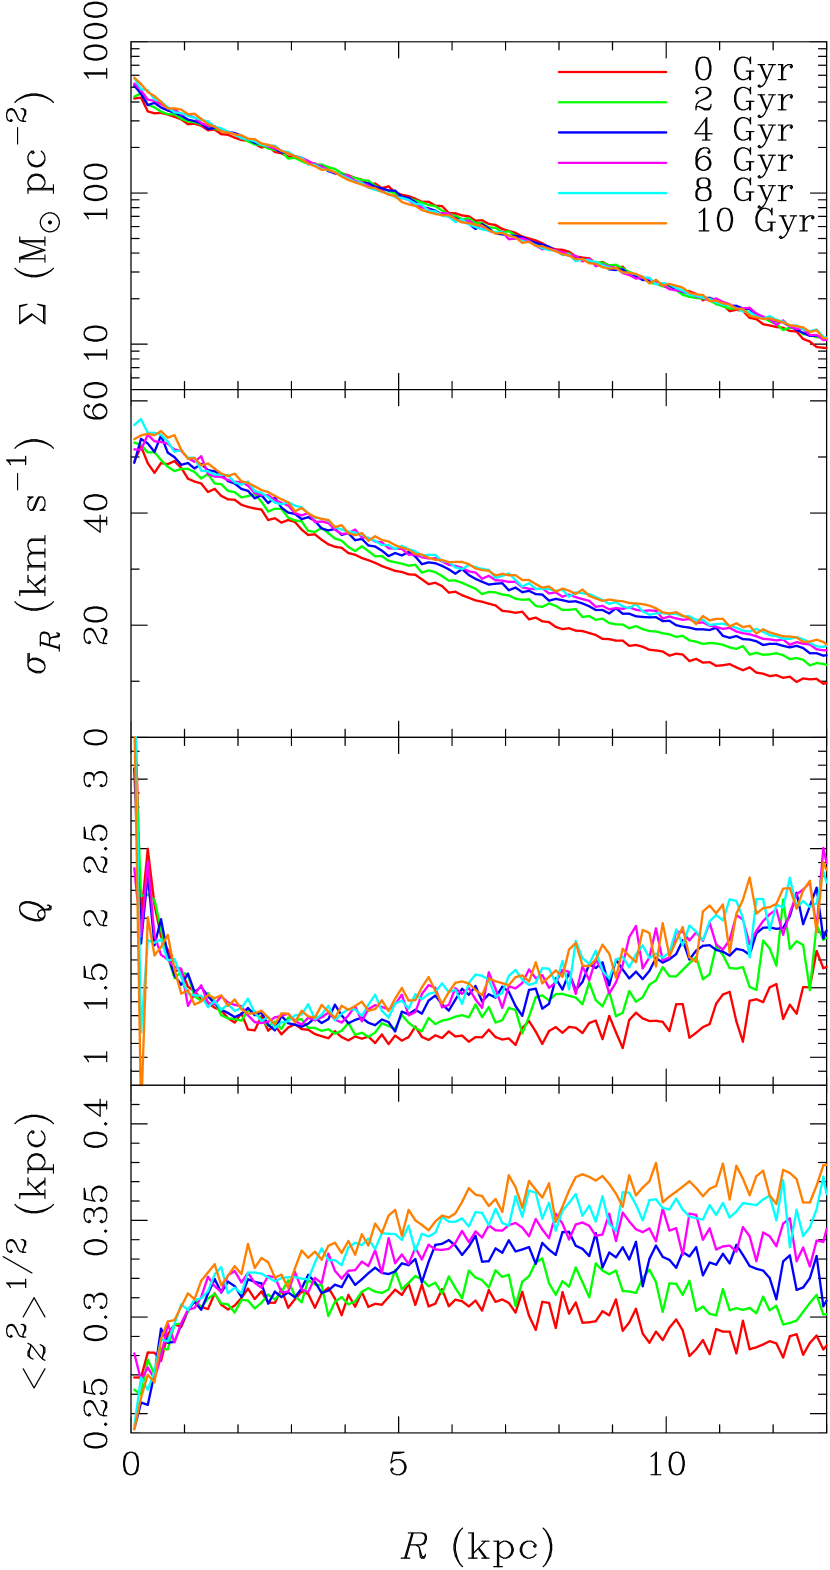
Figure 8 shows the radial distribution of the surface density, , radial velocity dispersion, , Toomre’s , and scale height, , of model b for M and k. These values are averaged over bins of 500 pc. While the distribution of and at Gyr are very similar in both models, in k increases more rapidly than that in M. The evolution of is caused by the two-body relaxation. The two-body relaxation time of this model is Gyr and Gyr for k and 3M. The evolutions of and are also faster in k models. We will discuss the effects of the number of particles in Section 3.5.


3.2. Evolution of the value due to the spiral heating
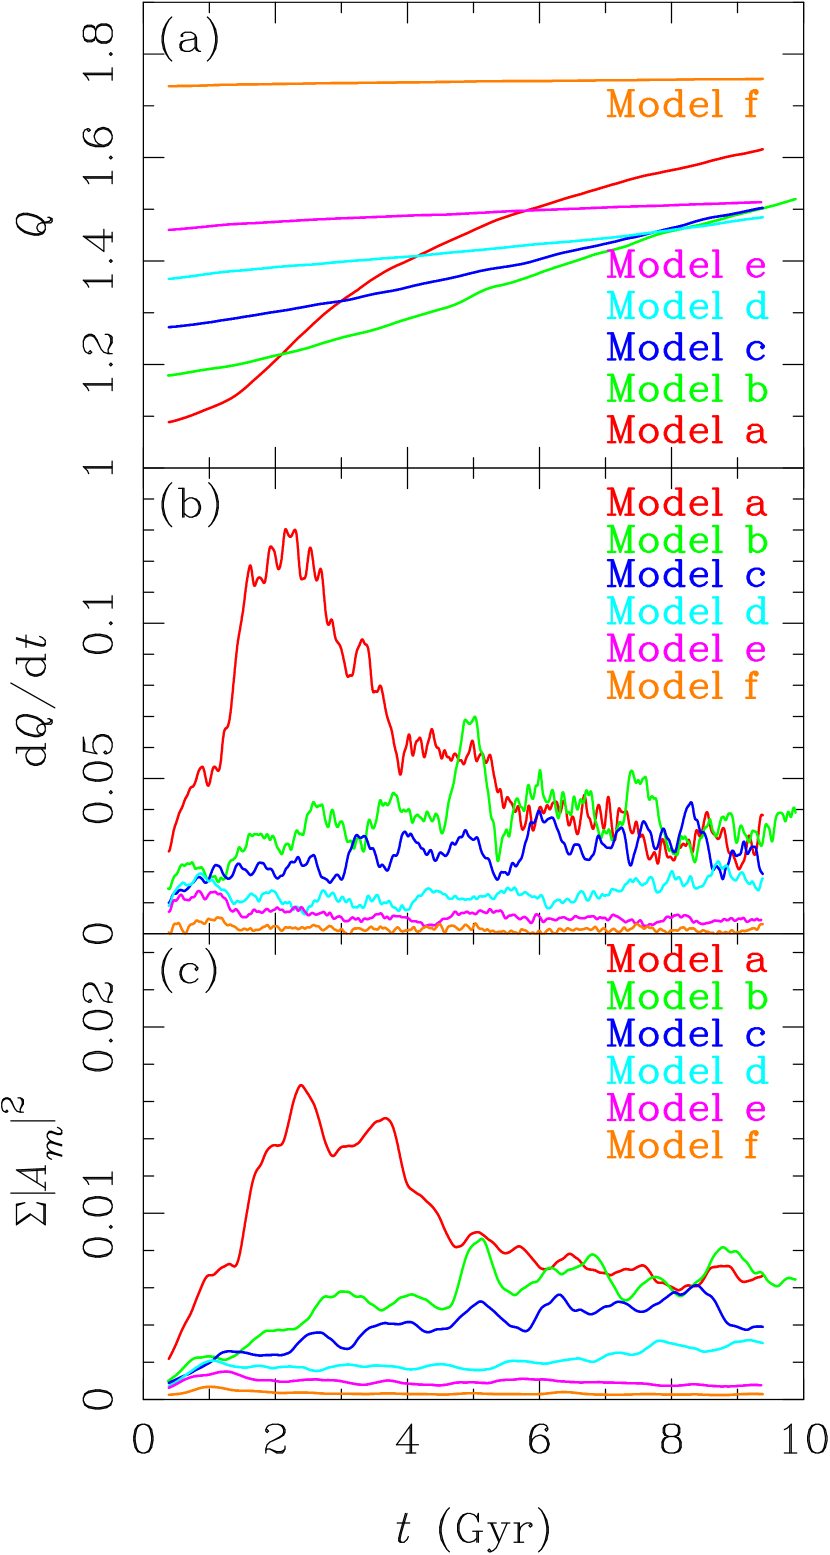
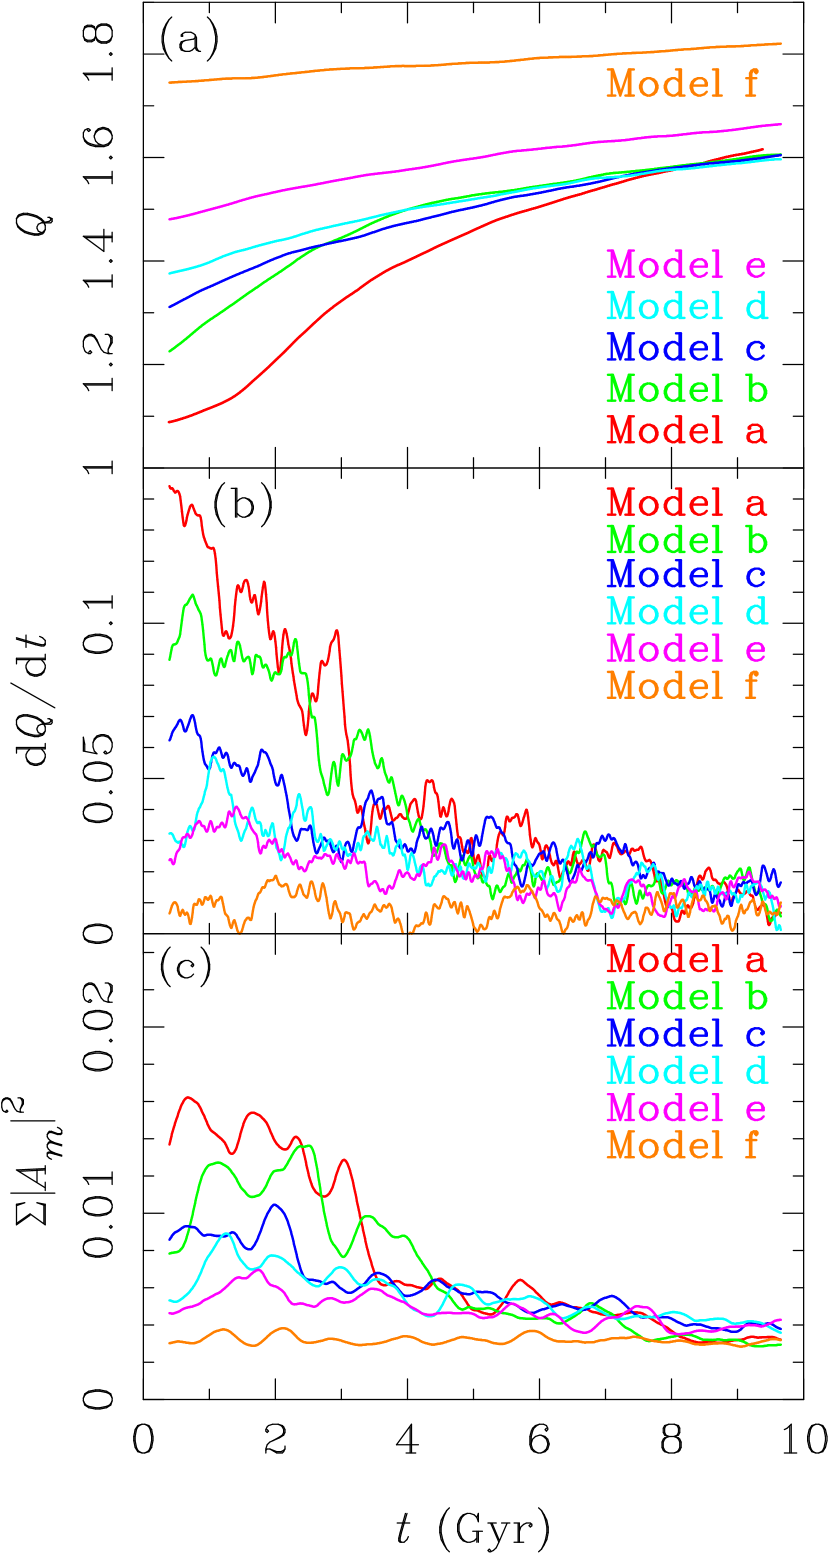
In this section, we compare the results of models with different initial values of , , and investigate how the evolve in time. We performed simulations for models with different (model a–f). Top panels of Figure 9 show the time (a) evolution of , (b) the growth rate of , i.e., , and (c) the total power of the modes, , which corresponds to the amplitude of spiral arms. These values of and are averaged over the range of 5–10 kpc and over 0.5 Gyr. The total powers are evaluated at kpc. If the initial disk is colder (i.e., smaller ), the amplitudes of spiral arms tend to be larger in both k and 3M models. It is also clearly seen that increases more rapidly in colder initial disks (i.e., smaller ). In all M models, the amplitudes of spirals tend to increase toward Gyr, except for model a. On the other hand, the amplitudes start to decrease soon after the simulations start in all k models (right bottom panel of Figure 9). The peak amplitude is larger for models with smaller , for both numbers of particles.
From comparison between panels (a) and (c) of Figure 9, it seems that the increase of the is caused by the spiral arms, since the rapidly increases when the amplitude of spiral arms is large. Since the surface density, , and epicycle frequency, , do not change significantly throughout the simulations (see Figures 8), the change of depends only on the radial velocity dispersion, , by the definition of :
| (2) |
Therefore, can be interpreted as a “heating rate.” The evolution of and that of the total power of the spiral arms, , are very similar (see the left panels (b) and (c) of Figure 9), indicating that the spiral arms increase the velocity dispersion of stars. The similarity between and is also visible in the 300k models (right panels (b) and (c) of Figure 9). Therefore, this mechanism seems to be independent of the number of particles.
In order to confirm the hypothesis that the amplitude of spiral arms, , determines the heating rate, , we analytically estimate from the amplitude of spiral arms in the simulations. The relation that is proportional to the square of amplitudes is suggested by Carlberg & Sellwood (1985). They derived this relation by considering the perturbing potential of spiral arms. We derive the relation between and the spiral amplitude in a different way. As shown in the previous section, the global spiral arms are transient; splitting to smaller sub-arms and merging into global arms recurrently occur. Therefore, as a first approximation, they behave like ‘material arms’ consisting of several massive clumps. With this assumption, we can estimate the increase of stellar velocity dispersion using the same equation as that describes dynamical heating of stars by GMCs in galactic disks (Kokubo & Ida, 1992), replacing a spiral arm in our simulation with several massive clumps. As discussed above, the evolution of corresponds to that of the velocity dispersion. We therefore discuss the time derivative of the velocity dispersion below. The relaxation time of disk stars due to the dynamical heating by clumps with mass , whose number density is , is given by
| (3) |
where and are the three-dimensional velocity dispersion of disk stars and mass of a star respectively, and is Coulomb logarithm (Binney & Tremaine, 2008). Here, since , we can neglect . The number density of stars in spiral arms is given by , where is the scale height of the disk and is the surface density of the spiral arms. The scale height is given by , where is the vertical velocity dispersion and is the angular speed of the disk. In a disk system, (e.g., Kokubo & Ida, 1992), the relaxation time of a disk can be written as
| (4) |
By definition, the relaxation time is . The change of velocity dispersion is written as
| (5) |
We assume that the mass and surface density of each clump of the spiral arms are given by
| (6) | |||||
| (7) |
where and are the total mass and surface density of the disk, and and are the number and amplitude of the spiral arms. Substituting Equations (4), (6), and (7) to Equation (5), we obtain
| (8) |
From Equation (2), the time derivative of is
| (9) |
where we assumed that and are constants. Assuming that the three-dimensional velocity dispersion is , from Equations (8) and (9), we obtain
| (10) |
If we scale as , , and , then
| (11) |
where and in our model. Using Equation (11) and the amplitudes, , obtained from the simulation, we can estimate . We take the sum of Fourier components with 4–6, which are dominant modes. As can be seen in the snapshots and maps of (Figures 2–6), it would be unphysical to include modes with . We adopted because the scale height of the disk is comparable to the size of the clumps. Figures 10 and 11 show the comparison between the analytic and the numerical results of model a and b. It is clear that behavior of in the simulations is quantitatively reproduced by the analytic estimate in models a and b, for both M and 300k. Thus, we conclude that scattering of stars by spiral arms can heat up the stellar disks, and that the heating rate is proportional to the squared amplitude of the spiral arms.


3.3. The maximum amplitude of spiral arms
In the previous section, we showed that is tightly coupled with the amplitude of spiral arms, and this coupling is well understood in a simple picture that spiral arms gravitationally scatter stars and increase . What controls the amplitude of spiral arms? Figure 9 shows that the amplitudes of spiral arms decay, as increases. This suggests that the amplitude of spiral arms is determined by .
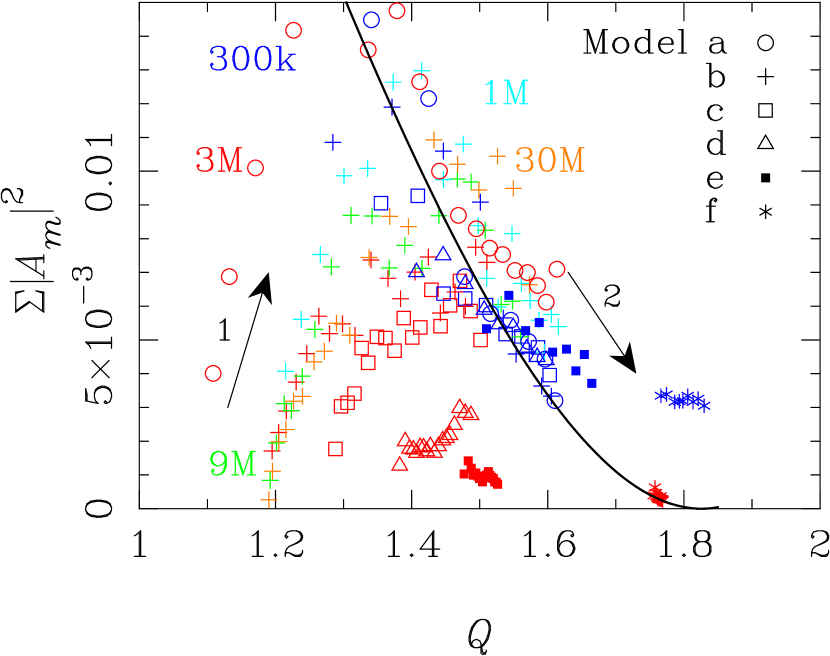
Figure 12 shows the evolution of models in the plane of and the total power of the spiral arms. These values are measured at 7.5 kpc and averaged over 0.5 Gyr in the same way as the previous section. At the beginning of the simulation, both and the total power are small. The amplitude of spiral arms grows rapidly, and the models move in the right-upward direction as shown by arrow 1. Once the amplitudes reach their peak values, they decay and models move right-downward (arrow 2). In this phase, the trajectory in the - plane seems to follow a roughly straight line, irrespective of models and the number of particles. In other words, there seems to be a “forbidden region” in the left-top of the - plane, where both amplitudes and are large. This result implies that the maximum amplitude is determined by . At the beginning, the amplitude is smaller than the maximum amplitude and therefore the spiral arms can grow with time. However, once the amplitude reaches to its limit, it starts to decay because increases due to heating by spiral arms, and the maximum amplitude decreases.
Here we try to estimate the maximum amplitude of spiral arms, assuming that the spiral arms grow through the collapse due to the gravitational instability, and that they evolve until they reach an approximate dynamical equilibrium. Under this assumption, the amplitudes can be simply estimated as a density contrast before and after the collapse. We assume that stars in a region of the disk with a size of a critical wavelength, , collapse to a spiral arm.
The initial energy of the region to collapse can be expressed as
| (12) |
where , , and are the mass, velocity dispersion, and radius of the system, and is a fixed value. We treat as a parameter, depending on geometry and density distribution; e.g., for a homogeneous sphere, . Assuming that the collapsed region is virialized when it forms a spiral arm, the arm satisfies the virial theorem and the potential energy after the virialization is
| (13) |
The amplitude of the spiral arms is obtained from the density contrast of the initial and virialized density. If we assume that the virialized density is the mean density inside the half-mass radius, , we obtain the amplitude from the ratio of the initial and virialized densities,
| (14) |
where we adopt the half-mass radius, (Binney & Tremaine, 2008), and is obtained from Equation (13). From Equation (2) and the critical wavelength, , we obtain
| (15) |
Assuming that and the radius of the sphere, , we can rewrite Equation (14) using Equations (12) and (15) as
| (16) |
where we assumed that . Since , the density contrast is written as a function of ,
| (17) |
While the density contrast in Equation (17) is defined in three dimensions, the amplitude we obtained from the simulation is one-dimensional because it is the contrast of the radially averaged surface density. Therefore, we define the amplitude of a spiral arm as
| (18) |
From Equations (17) and (18), the amplitude relates with as
| (19) |
The black curve in Figure 12 shows obtained from Equation (19), where we assumed . Although Equation (19) qualitatively explains the amplitude as a function of after it reaches the maximum, the amplitude obtained from the simulations is smaller than that obtained from Equation (19) by a factor of 10. The possible reasons are as follows. (1) We assumed that a homogeneous region collapses to estimate the density contrast, but this is not the case in a disk. Especially, the scale height of the disk is much smaller than , which we assumed as the initial radius. (2) We used the radially averaged surface density to calculate the Fourier amplitude from the simulations. This treatment may underestimate the local amplitude of spiral arms because the averaged density depends on the radial width for averaging. We chose a radial width smaller than the critical wavelength. However, the amplitudes increased by % when we halved the width. (3) Growth of spiral arms does not complete because the galactic shear breaks up the spiral arms before they are virialized.
We do not insist that our simple model gives a fully correct description of the mechanism through which controls the amplitude of spiral arms, but it is clear from Figure 12 that determines the amplitude. Thus, the spiral arms evolve in a self-regulated manner as follows. Spiral arms grow from small density perturbations by the swing amplification (Toomre, 1981) to their maximum amplitudes limited by . The spiral arms scatter disk stars, and as a result the velocity dispersion of the disk star increases. The heating rate, , is proportional to the squared amplitudes of spiral arms (see Equation (11)). This heating mechanism increases , and therefore the amplitude of spiral arms decreases. As a result, the heating rate decreases as increases. Through this evolution, the spiral arms become asymptotically faint as qualitatively shown by the black line in Figure 12, but its timescale is comparable to the cosmological time, i.e., 10 Gyr.
3.4. Effects of the initial value and disk mass
In order to see how the initial , and disk mass fraction affect the evolution and morphology of spiral arms, we performed three additional runs: an unstable disk (; model g), a massive disk (, model h), and a less massive disk (, model i). In all models, the number of particles is . Figure 13 shows the snapshots of models f–i. Model f is a model with a large initial , and shown in Section 3.2. We show it again as an example of a model with a large .
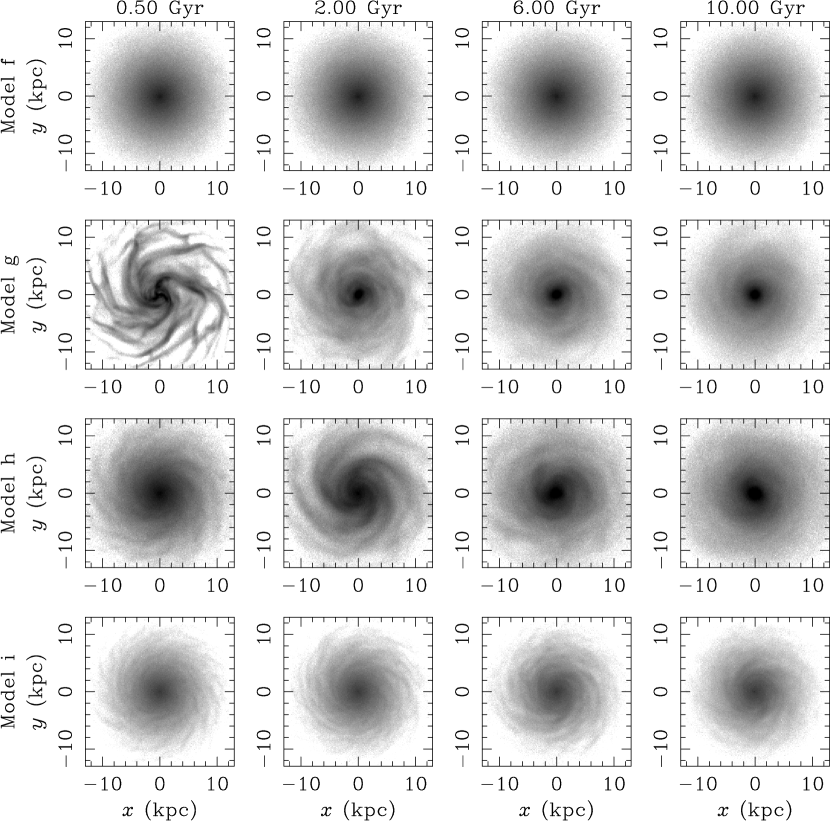
Model g is initially cold and unstable, therefore strong spiral arms develop in the first 0.5 Gyr. As shown in top panel of Figure 14, the disk is soon heated up to , and the keeps increasing. As expected from our theory in Section 3.3, the amplitude of spirals then decreases quickly, and they are very weak at Gyr. The final density and velocity profiles are quite different from original ones. In model f, whose disk is initially hot (), spiral arms do not develop, and therefore (or the velocity dispersion) stays nearly constant (see the left panels of Figure 9).
Models h and i have the same parameters as those of model b (standard model) except the disk mass ratio to halo, . Carlberg & Freedman (1985) showed that the number of spiral arms in numerical simulation is consistent with that predicted by the swing amplification theory (Toomre, 1981), and massive disks have a smaller number of spiral arms. Our results are consistent with this previous result. We can estimate the number of spiral arms as follows. The swing amplification is characterized by a parameter, , where is the critical wavenumber (Binney & Tremaine, 2008). Spiral arms develop most effectively when (Toomre, 1981). Therefore, we can estimate the dominating number of spiral arms, , as
| (20) |
where we adopted . In the case of model b, we obtain at 8 kpc, which roughly agrees with the result of the simulation. This estimate is applicable for other models with different disk mass fractions. Since the halo mass, , is fixed in our models, the surface density, , is proportional to the disk mass fraction, . The numbers of spiral arms of models h and i are estimated as and at 8 kpc, and they also agree with the results of the simulations.
Figure 14 shows the time evolution of averaged within 5–10 kpc (top) and the total power at kpc (bottom), respectively. As was the case with models a–f, the large total powers correspond to the rapid increase of . We investigated the time evolutions of from the simulations and evaluated them using Equation (9) in the same way as models a–f. Figure 15 shows the results. The analytic results again agree well with the simulations in these models.
In fact, the evolution of these models are qualitatively similar, but different in details. The evolution of model h, which has a more massive disk, is faster than that of model b (our standard model). In model h, the total power of the spiral arms grows to , at –4 Gyr, whereas it is in model b. This difference causes the faster decay of the amplitude in model h (see bottom panel of Figure 14). Furthermore, the number of spiral arms decreases in model h. Initially, the number is around four (see 2.0 Gyr in Figure 13), but three at 6.0 Gyr. In model h, the effective angular-momentum transport occurs due to asymmetric structures in the disk and the surface density of the inner region increases. This reduces the number of the spiral arms.


3.5. Effects of the number of particles
As we showed in Figures 2 – 6, while the spiral arms survive for more than 10 Gyr in M, 9M, and 30M models, this is not the case in k and 1M models. Although the disks in k models become featureless after Gyr (Figure 6), this is not mainly by the effect of the two-body relaxation. We can estimate the heating rate due to the two-body relaxation from the result of model f, where spiral arms do not develop, the relative heating rate for model f with k at is around 0.5%/Gyr. For a disk, the relative heating rate is proportional to . Thus, for and k, the heating rate due to the two-body relaxation is %/Gyr, which is much smaller than the actual increase obtained from simulations. Heating due to spiral arms is dominant even in k models.
The major differences between 3M–30M models and 300k and 1M models are (1) the time when the spiral arms reach their peak amplitudes and (2) the peak amplitude themselves. The spiral arms initially grow from small perturbations of the density originated in the Poisson noise of disk stars and grow up to their maximum amplitude determined by . For the same initial , k models reach the maximum amplitudes much faster, and the values are large. A smaller number of particles generates a larger Poisson noise. Therefore, spiral arms in k and 1M models can reach its maximum amplitude faster than those in M–30M models (Sellwood, 2010). This means that the peak amplitude in k models is larger than those in M–30M models, because they can develop before the becomes large. The larger peak amplitude results in larger heating rate. Thus, the of the k models increases faster than that of the M–30M models.
As shown in Figure 7, the evolution of the models with 9M and 3M is not significantly different after Gyr. In other words, once the amplitude of the spirals reaches a certain level (), the differences in the initial conditions are no longer important. In section 3.1, we estimate the timescale of the initial exponential growth as around 0.4 Gyr. If we start from the noise level of real galaxies, particles, it will take 1.6 Gyr longer than in the case of M. This is still shorter than the cosmological timescale.
The two-body relaxation has serious effects on the heating of the disk only when the number of particle is quite small. For example, the number of particles used in the simulation of Sellwood & Carlberg (1984) was only . Since the heating timescale of our k model is Gyr for , the relaxation time of their model would be Gyr. Thus, it seems that in Sellwood & Carlberg (1984) spiral arms are weakened by the heating due to the two-body relaxation.
4. Summary and Discussion
4.1. Summary
We performed three-dimensional -body simulations of pure stellar disks with spiral arms and investigated their dynamical evolution. We confirmed that the spiral arms are transient and recurrent. Contrary to previous results, we found that spiral arms in pure stellar disks can survive for more than 10 Gyrs, when we use a sufficiently large number of particles. We also found that spiral arms of a stellar disk are self-regulated. The spiral arms grow by the swing amplification up to their maximum amplitudes determined by Toomre’s value at the moment. The amplitude becomes smaller as increases. The spiral arms heat up the disk, or increase the velocity dispersion of stars, by scattering the disk stars. As a result, increases, and the amplitude of spirals is suppressed. We found that the heating rate, which is given by , is roughly proportional to the square of amplitudes. It means that the heating timescale becomes longer as increases. Thus, the spiral arms heat up the stellar disk and increases , but at the same time the increase of results in the decay of the spiral amplitudes and a smaller heating rate. This self-regulating relation among , spiral amplitudes, and the heating rate maintains the spiral arms for more than 10 Gyr.
In the case of the smaller number of particles (k), however, the spiral arms become faint much faster than in the model with M, 9M, and 30M. We found that the initial exponential growth of the density perturbation depends on the number of particles (see Figure 7). Spiral arms initially grow from density perturbations originated from the Poisson noise of the initial condition through the swing amplification. A smaller number of particles results in a larger seed noise. Therefore, spiral arms grow faster up to their maximum amplitude determined by . The rapid growth of the amplitude causes a rapid heating of the disk and also rapid decay of the spiral arms.
Our results show that the timescale of the initial exponential growth is Gyr. It means that even if we start with smooth disks stars, the total power of arms reach the level of in a few Gyr. In real galaxies, moreover, the disks may be initially perturbed by hierarchical mergers and/or GMCs. If the initial perturbation is comparable to or larger than this level, the spiral arms that look very similar to those in real spiral galaxies are formed within a Gyr or less. It is beyond the scope of the present paper to discuss the amplitude and shape of the initial perturbation in a realistic situation, which should be ultimately studied in a cosmological context with a sufficiently high numerical resolution, e.g., the generated disk should be represented by larger number of particles to avoid numerical artifacts.
4.2. Effects of Gas and Star Formation
In this paper, we showed that the presence of gas is not essential in maintaining spiral arms. However, real spiral galaxies have gas and its effect is not negligible. Gas in galactic disks can work as both cooling and heating sources. The velocity dispersion of gas is smaller than that of stars because gas clumps lose their kinetic energy due to dissipation when they collide each other. As suggested by Sellwood & Carlberg (1984), new stars formed from the gas have smaller velocity dispersions than that of old disk stars because of the smaller velocity dispersion of gas. The new stars can dynamically cool the disk. Moreover, the existence of gas reduces the effective of the disk (Jog & Solomon, 1984). On the other hand, the smaller makes the disk dynamically unstable (Bertin & Romeo, 1988) and it may cause faster heating of the disk. In addition, gas trapped into stellar spiral arms would cool due to the dissipation and its gravity may strengthen the amplitude of spiral arms. The larger amplitude of spiral arms will cause faster heating of the disk. However, even if the gas enhances the amplitude of spiral arms, the self-regulating mechanism that we suggested in this paper will determine the spiral amplitudes. Therefore, the disk would keep the spiral arms for a long time as in the case of pure stellar disks. In reality, the interaction between the gas and stellar spirals is complicated. We are now performing simulations with gas and will present the results elsewhere (Baba et al. in preparation).
Appendix A Effects of opening angle of treecode
We used a treecode for calculation of forces. Since a treecode does not conserve the linear momentum of systems, the disks might drift during the simulations. Since we used a fixed background potential as a halo model, the drift from the center of the halo might result in an artificial perturbation. This effect depends on the opening angle of treecodes, , which is a parameter in the tree approximation. Smaller can achieve more computational accuracy, but requires longer CPU time. If the drift is significant to induce the artificial perturbation, we expect larger amplitude of spirals developing in the later phase for larger . In order to confirm this, we performed simulations with , and for model b with k and investigated their convergence. Figure 16 shows the evolution of the total powers. They do not show any clear differences. We also confirmed that the amplitudes of the mode do not grow throughout the simulations (see Figure 17). In the results in Section 3, we adopted for all simulations.


Appendix B The time evolution of the Fourier amplitudes at kpc
In this section, we show the time evolution of the Fourier amplitudes at kpc of the disk, which corresponds to the deviation of the density center of the disk from the center of the halo potential, in order to confirm that the drift of the density center of the disk is not significant.
We investigated the deviation of the density center of the disk from the origin, which is the center of the halo potential, on the - plane. This directly shows the drift of the disk. The dotted curve in Figure 18 shows the distance of the density center from the origin at kpc for model b with k, . The density center is calculated from the highest local density using the method of Casertano & Hut (1985). Figure 18 shows that the deviation of the density center is as small as the softening length of 0.03 kpc and does not increase during the simulation. The full curve in Figure 18 shows the time evolution of the Fourier amplitudes of , . It shows that traces the deviation of the density center, . The amplitude is due to the Poisson noise of the particle distribution. Hereafter, therefore, we adopt at kpc as the index of the deviation of the disk center from the halo center.
Figure 19 shows the Fourier amplitudes of 1–6 at kpc for model b. These amplitudes are averaged over 0.5 Gyr. For comparison, we also plotted the result of model f with M, in which spiral arms do not develop, because the initial is large. Initially, all amplitudes show the fluctuations due to Poisson noise. In the case of small numbers of particles (M), the amplitudes do not increase during the simulations. In the case of larger numbers of particles (M), on the other hand, the amplitudes of –3 modes increase after the spiral arms developed (after Gyr). We consider that this increase of the amplitudes at kpc is caused by the spiral arms developed in the outer part of the disk (e.g., at 7.5 kpc), because the amplitudes does not increase in the case of the disk without spiral arms (see model f in figure 19). Moreover, it is unlikely that these small increases of the amplitude at kpc affect the evolution of the spiral arms in the outer part of the disk. In model b with M, for example, the amplitude grows to times as much as the initial fluctuation during the first 2 Gyr (see figure 7). After 2 Gyr, the amplitudes at kpc start to increase. If the increase of the amplitudes at kpc cause the evolution of the spiral arms of the outer part, the increase during 2–4 Gyr at kpc must be larger than those of the first 2 Gyr. In fact, however, the spiral amplitudes at kpc grow to only 2–3 times during 2–4 Gyr. Therefore, we can safely conclude that the increase of the amplitudes at kpc is caused by the asymmetry of the self-developed spiral arms in the disk.


References
- Athanassoula et al. (2005) Athanassoula, E., Lambert, J. C., & Dehnen, W. 2005, MNRAS, 363, 496
- Baba et al. (2009) Baba, J., Asaki, Y., Makino, J., Miyoshi, M., Saitoh, T. R., & Wada, K. 2009, ApJ, 706, 471
- Barnes & Hut (1986) Barnes, J., & Hut, P. 1986, Nature, 324, 446
- Bertin & Lin (1996) Bertin, G., & Lin, C. C. 1996, Spiral structure in galaxies a density wave theory, Publisher: Cambridge, MA MIT Press
- Bertin & Romeo (1988) Bertin, G., & Romeo, A. B. 1988, A&A, 195, 105
- Binney & Tremaine (2008) Binney, J., & Tremaine, S. 2008, Galactic Dynamics: Second Edition, by James Binney and Scott Tremaine. ISBN 978-0-691-13026-2 (HB). Published by Princeton University Press, Princeton, NJ USA, 2008.
- Bottema (2003) Bottema, R. 2003, MNRAS, 344, 358
- Carlberg & Freedman (1985) Carlberg, R. G., & Freedman, W. L. 1985, ApJ, 298, 486
- Carlberg & Sellwood (1985) Carlberg, R. G., & Sellwood, J. A. 1985, ApJ, 292, 79
- Casertano & Hut (1985) Casertano, S., & Hut, P. 1985, ApJ, 298, 80
- Donner & Thomasson (1994) Donner, K. J., & Thomasson, M. 1994, A&A, 290, 785
- Dubinski et al. (2009) Dubinski, J., Berentzen, I., & Shlosman, I. 2009, ApJ, 697, 293
- Elmegreen & Thomasson (1993) Elmegreen, B. G., & Thomasson, M. 1993, A&A, 272, 37
- Fuchs et al. (2005) Fuchs, B., Dettbarn, C., & Tsuchiya, T. 2005, A&A, 444, 1
- Goldreich & Lynden-Bell (1965) Goldreich, P., & Lynden-Bell, D. 1965, MNRAS, 130, 97
- Hernquist (1993) Hernquist, L. 1993, ApJS, 86, 389
- Jog & Solomon (1984) Jog, C. J., & Solomon, P. M. 1984, ApJ, 276, 114
- Julian & Toomre (1966) Julian, W. H., & Toomre, A. 1966, ApJ, 146, 810
- Lin & Shu (1964) Lin, C. C., & Shu, F. H. 1964, ApJ, 140, 646
- Kawai et al. (2006) Kawai, A., Fukushige, T., & Makino, J. 2006, proceedings of SC06
- Kokubo & Ida (1992) Kokubo, E., & Ida, S. 1992, PASJ, 44, 601
- Makino (1991) Makino, J. 1991, PASJ, 43, 621
- Makino (2004) Makino, J. 2004, PASJ, 56, 521
- Makino et al. (2007) Makino, J., Hiraki, K., & Inaba, M. Proceedings of the 2007 ACM/IEEE, 2007
- Mark (1976) Mark, J. W.-K. 1976, ApJ, 206, 418
- McMillan & Dehnen (2007) McMillan, P. J., & Dehnen, W. 2007, MNRAS, 378, 541
- Navarro et al. (1997) Navarro, J. F., Frenk, C. S., & White, S. D. M. 1997, ApJ, 490, 493
- Sellwood (2000) Sellwood, J. A. 2000, Ap&SS, 272, 31
- Sellwood (2010) Sellwood, J. A. 2010, arXiv:1001.5430
- Sellwood & Binney (2002) Sellwood, J. A., & Binney, J. J. 2002, MNRAS, 336, 785
- Sellwood & Carlberg (1984) Sellwood, J. A., & Carlberg, R. G. 1984, ApJ, 282, 61
- Sellwood & Debattista (2009) Sellwood, J. A., & Debattista, V. P. 2009, MNRAS, 398, 1279
- Toomre (1969) Toomre, A. 1969, ApJ, 158, 899
- Toomre (1981) Toomre, A. 1981, Structure and Evolution of Normal Galaxies, 111
- Toomre (1990) Toomre, A. 1990, Dynamics and Interactions of Galaxies, 292
- Toomre & Kalnajs (1991) Toomre, A., & Kalnajs, A. J. 1991, Dynamics of Disc Galaxies, 341