Have proto-planetary discs formed planets?
Abstract
It has recently been noted that many discs around T Tauri stars appear to comprise only a few Jupiter-masses of gas and dust. Using millimetre surveys of discs within six local star-formation regions, we confirm this result, and find that only a few percent of young stars have enough circumstellar material to build gas giant planets, in standard core accretion models. Since the frequency of observed exo-planets is greater than this, there is a ‘missing mass’ problem. As alternatives to simply adjusting the conversion of dust-flux to disc mass, we investigate three other classes of solution. Migration of planets could hypothetically sweep up the disc mass reservoir more efficiently, but trends in multi-planet systems do not support such a model, and theoretical models suggest that the gas accretion timescale is too short for migration to sweep the disc. Enhanced inner-disc mass reservoirs are possible, agreeing with predictions of disc evolution through self-gravity, but not adding to millimetre dust-flux as the inner disc is optically thick. Finally, the incidence of massive discs is shown to be higher at the protostellar stages, Classes 0 and I, where discs substantial enough to form planets via core accretion are abundant enough to match the frequency of exo-planets. Gravitational instability may also operate in the Class 0 epoch, where half the objects have potentially unstable discs of 30 % of the stellar mass. However, recent calculations indicate that forming gas giants inside 50 AU by instability is unlikely, even in such massive discs. Overall, the results presented suggest that the canonically ‘proto-planetary’ discs of Class II T Tauri stars have globally low masses in dust observable at millimetre wavelengths, and conversion to larger bodies (anywhere from small rocks up to planetary cores) must already have occurred.
keywords:
circumstellar matter – planetary systems: protoplanetary discs – planetary systems: formation1 Introduction
It is often assumed that the discs of classical T Tauri stars are those in which planets form. These ‘Class II’ objects have disc-dominated dust emission in the infrared to millimetre, in contrast to fainter remnant discs around Class III (weak-line) T Tauri stars, or the envelope-dominated emission of the earlier-stage Class 0 and I protostars. Provided that dust persists for a few Myr in Class II discs, along with the gas component that contains the bulk of the mass (Dent et al., 2005), then gas giants should be able to form by core accretion followed by accumulation of a thick atmosphere (Pollack et al., 1996; Hubickyj et al., 2005). However, it has been noted recently that the masses of T Tauri discs as derived from millimetre observations are typically small compared to the reservoirs needed for gas-giant formation. Andrews & Williams (2007a) inferred that the median Class II disc comprises only 5 Jupiter masses of dust and gas, from deep surveys of the Taurus and Ophiuchus regions. In contrast, at least 20 Jupiter masses was present in the Minimum Mass Solar Nebula (MMSN), on the basis of the rocky content now locked up in planetary cores (Davis, 2005). In models, a mass-reservoir a few times larger is actually needed for core-accretion to successfully build the the Sun’s giant planets. For example, Dodson-Robinson et al. (2009) find that a 120 Jupiter-mass111The convenient relation is adopted throughout, rather than the true inverse mass ratio of 1047. or 6-MMSN disc can make all four giants. There are also examples of more massive exo-planets than the Sun’s giants, probably requiring more substantial discs from which to form. Hence, if exo-discs only comprise a few Jupiter-masses, there is a ‘missing mass’ problem at these early stages.
Further, the surface densities that are the critical parameter in core accretion models are typically measured to be lower than expected, for example in relation to forming Jupiter at around 5 AU (Andrews & Williams, 2007b). Millimetre dust emission is a good choice for measuring total disc-masses, being of low optical depth and reasonably bright, but limited angular resolution means that material at a few AU is not resolved. Although the bulk of the disc mass should be at large scales (Wyatt et al., 2007), discontinuous profiles with a strong central mass peak can not be ruled out. However, if the profiles are smooth, the typical outer radii of AU (Andrews & Williams, 2007b) are much larger than the Solar System, exacerbating the missing-mass problem by further reducing the inferred inner-disc surface densities.
Several types of solution to the missing-mass problem have been proposed. The conversion of millimetre flux to dust mass is via the grain temperature and emissivity, and while the former can be estimated from the wavelength of peak emission, the latter is more uncertain and comes from modelling of grain properties (Draine, 2006). Decreasing the adopted emissivity would enhance the derived disc masses, and this could be reasonable for a different composition, or a size distribution where much of the mass is in large grains. Such ‘pebbles’ are not conspicuous in the millimetre measurements but can be detected by radio continuum emission (Rodmann et al., 2006). In addition, the total disc masses could be wrong if the assumed gas-to-dust mass ratio of 100, i.e. inherited from the interstellar medium, is in error. A higher conversion factor would be correct if some of the dust has evolved into non-observable forms (anywhere from small pebbles up to planetesimals) but the gas is still all in the disc. The true disc masses should then be higher if a more appropriate gas-to-dust ratio were used. Similarly, if some of the gas has also been accreted into planets, the disc mass estimates are even more uncertain but will underestimate the initial reservoir. Generally, Andrews & Williams (2007a) have shown that the disc masses estimated via the amount of accretion onto the star are substantially higher than the masses derived directly from the observed dust, confirming that there is indeed a discrepancy within the available data.
| cluster | age | Nstars | Nobserved | reference | ||||
| (Myr) | (mm) | () | (%) | (median, ) | () | |||
| ONC | 1 | 1471 | 0.88 | 55 (26) | 11 4 | 8 | Mann & Williams (2009) | |
| Oph | 1 | 337 | 0.35-1.3 | 147 (64) | 18 4 | 10 | Andrews & Williams (2007a) | |
| Tau/Aur | 1.5 | 289 | 0.35-1.3 | 153 (94) | 17 3 | 1 | 1 | Andrews & Williams (2005) |
| IC 348 | 1.5 | 345 | 3 | 95 (0) | 2 | 25 | Carpenter (2002) | |
| Lup | 2 | 159 | 1.3 | 32 (12) | 6 4 | 7 | Nürnberger et al. (1997) | |
| Cha | 2 | 180 | 1.3 | 36 (16) | 8 5 | 16 | Henning et al. (1993) |
There are however some difficulties with these kinds of solutions to the missing-mass problem. Firstly, a bulk increase in the adopted emissivity will affect all systems, and the few discs of (Andrews & Williams, 2005, 2007a, 2007b) would then be comparably massive to the host star. This situation is likely to be dynamically unstable, i.e. such a disc would tend to fragment to form a companion star or brown dwarf, and not remain to be observed in the Class II era. Secondly, where larger grains are detected in long-wavelength data, the derived disc masses do not always increase. Rodmann et al. (2006) found systems where the millimetre spectral index is small – a signature of grain growth (Draine, 2006) – with three discs having indices as low as 0.5-0.8 in the 1-7 mm regime. However, masses derived from their 7 mm fluxes range from 20 % lower to 70 % higher than the estimates based on 0.85 mm data, rather than being substantially increased. Thirdly, the bulk H2 gas component has in some cases been detected by infrared spectroscopy, although this is only sensitive to warm layers and so the total gas reservoir must again be estimated. In their models Bary et al. (2008) find that only a few Jupiter masses of hydrogen at AU is needed to reproduce line fluxes, but many systems a few Myr old are not detected, so predominantly high gas-to-dust mass ratios are not supported. The gas could already have been accreted into planetary atmsopheres in favourable cases (Hubickyj et al., 2005), but it may instead have been simply lost by mechanisms such as photo-evaporation (Ercolano et al., 2009).
Here we examine some alternative solutions to the missing-mass problem. We first compile a millimetre-based distribution of over several regions of young stars, and consider if there are globally enough high-mass discs to match the fraction of Sun-like stars observed to host gas giants. Finding that there is still a disc-mass deficit, we then examine three alternative classes of solution: that the mass reservoir could be used more efficiently if planets migrate while forming; that mass is hidden at small radii because it is optically thick; and that the mass has disappeared because it is accreted into planets very early on, even at the protostellar stage.
2 Disc material
Star formation near the Sun is well characterised by the molecular clouds of the Gould Belt, lying at distances of around 150 to 500 pc (Ward-Thompson et al., 2007). The belt includes at least a dozen regions of young stars, of which six have deep millimetre-wavelength surveys for dust discs. Other Gould Belt regions have few millimetre-detected discs, either because the stars are still mostly very deeply embedded so that intensive millimetre interfometry is needed to identify compact structures (e.g. Serpens, Corona Australis, IC 5146), or the large cloud areas have yet to be thoroughly mapped (e.g. Cepheus Flare, Pipe Nebula). The disc surveys included here are listed in Table 1, and cover the Taurus/Auriga, Ophiuchus, Chamaeleon and Lupus regions, the Orion Nebula Cluster and the IC 348 cluster in Perseus. The median stellar ages in these clouds (Palla & Stahler, 2000) are 1-2 Myr, although the disc surveys include Class O and I protostars that may be Myr old. The surveys have target selection biases, and in particular faint Class III systems may be under-represented. Also, not all the young stars were observed, with surveys sampling targets out of objects in each cluster. However, these data are the best snapshot presently available of the properties of potential planet-forming discs. The environments range from sparse star formation in Tau/Aur to the dense ONC, with the total star-count greatly dominated by this latter region; hence, its discs are of particular interest as they may represent archetypal planet-forming conditions.
Subsequent discussion implicitly assumes that these discs we observe today are equivalent to those that formed planets in the past – typically a few Gyr ago when considering the Sun-like hosts of observed exo-planets. We also assume that all the star-formation environments that existed in the past are also observed today; that the exo-planets observed are not from a peculiar subset of stars; and that the mode of planet formation that dominated in the past has not greatly altered as for example the Galaxy has become more enriched in heavy elements.
2.1 Millimetre-based disc masses
Table 1 summarises the results of the these millimetre disc surveys, and presents global properties for all the systems observed in each region. The results are adopted directly from the survey papers without attempting to align slightly different assumptions about dust temperatures and emissivities. All the surveys were complete down to an MMSN of 20 , apart from that of IC 348 where this represents a upper limit for each star.
With this very comprehensive dataset of 518 stars, it is clear that the fraction hosting an MMSN when observed is small. No cluster has an incidence % and the overall average is % (Poisson error). The median disc of each cluster comprises only a few Jupiter masses, down to as little as in the deepest data. There are no marked differences between sparse and dense clusters, and does not decline significantly with time. All of the clusters are within of the global , except for IC 348 where no MMSN are seen (but the survey is barely sensitive to this depth).
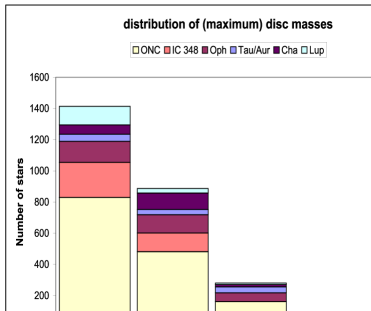
Figure 1 shows the estimated underlying distribution of disc masses. The discs have been divided among bins covering a factor of 3 in mass, with the highest three bins representing an MMSN or more. The raw counts were scaled up to infer the numbers of discs that would be expected for all the stars known in the cluster (Table 1), and these counts are then stacked to show the estimated contribution of each cluster. For uniformity the upper limits were treated as values, so the plotted distribution is the most optimistic one from the view of planet-forming potential. Two clusters were treated as special cases: the ONC, where completeness information (Mann & Williams, 2009) was used to infer limits, and IC 348, where the nominal measured fluxes (Carpenter, 2002) were treated as data points where positive, and the mean 2 disc was adopted for all other stars222This avoids the problem of logarithms of negative values but is not strictly flux-conserving, with the mean signal per disc being inflated to the bound.. For Tau/Aur and Oph only, some limits or detections below 2 were reached, but these are omitted from the plot for clarity.
Figure 1 also implies that the number of discs with MMSN-like planet forming potential is low. Including the scalings by total number of stars per cluster, is now 11 %, very similar to the uncorrected value above of 12 %. The proportion of discs in the top two bins, above the thresholds in many gas giant formation models, is only about 0.5 %, and such massive discs were only found in the Tau/Aur and Oph regions.
2.2 Disc population
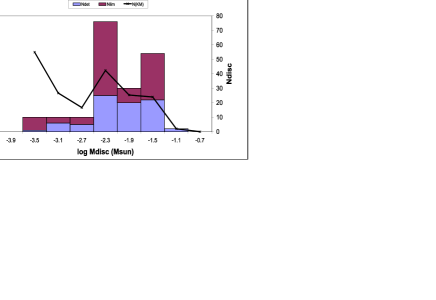
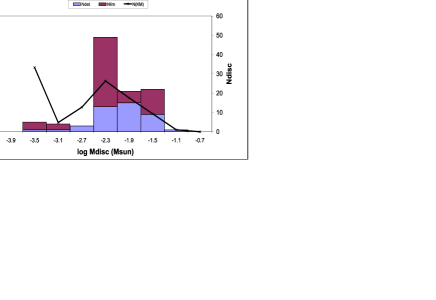
Survival analysis is used next to make a better estimate of the underlying distribution of disc masses, given the varying limits between and within surveys. The Kaplan-Meier estimator is appropriate when the limit obtained is independent of the mass of the disc being observed, a condition that is reasonably well met here. The K-M tests were performed on the log-disc-mass data using the ASURV package (Lavalley et al., 1992) and the results are shown in Figure 2. In the first panel, all of the 6 clusters of Table 1 were weighted equally, by taking 32 stars from each (i.e. all of those observed in Lupus and a random set of 32 from each of the other clusters). In the second panel, the clusters were weighted according to the total number of stars in each, i.e. taking all 55 observed discs from the ONC and a proportionally smaller random set from the other clusters (down to 6 stars in Lupus, i.e. ). These two approaches attempt to take into account a different mix of star-forming environments that could have occured at past times.
In both cases, Figure 2 shows a broad distribution of masses plus a large tail of very insubstantial discs. The main distribution peaks at 5 Jupiter masses, while about 30 % of stars have such negligible discs (left-most bin) that the dust mass is – these might not even be able to make a single terrestrial planet. At the high-mass end, weighting all the clusters equally yields an MMSN fraction of 13.5 %, while the -weighted calculation gives 10 % MMSN. These results are very similar to the previous results of %. Hence, even if the modes of star formation differed in the past, the fraction of discs capable of forming gas gaint planets appears to have been low, and many stars seem to have been incapable of any planet formation.
2.3 Disc mass evolution
It has already been suggested that higher disc masses at earlier stages might be more conducive to planet formation, and for example Andrews & Williams (2007a) have shown that this is the case for Taurus and Ophiuchus. There the median disc mass is 5 for Class II stars but 15 for the precursor Class I objects. Table 2 gives a similar summary of the data for all six star-forming regions of Table 1. No weighting of the clusters is made, as wide variations in detection-rates and proportions of different classes observed make this difficult to do systematically. Where objects are not explicitly classified, we treat as all-Class II both the ONC proplyds (following Mann & Williams (2009)) and the slightly older IC 348 stars (for consistency, although in fact the proportion of II:III objects here is about 30:70 (Muench et al., 2007)). Class III stars are not included in Table 2 because there are very few dust detections and so average properties are not meaningful.
| Class I | Flat Spectrum | Class II | |
|---|---|---|---|
| mean | 41 | 14 | 14 |
| () | (39) | (11) | (8) |
| median | 10 | 9 | |
| () | () | (10) | (2) |
| 47 11 | 26 12 | 22 3 | |
| (%) | (45 11) | (20 9) | (13 2) |
Table 2 confirms that the fraction of MMSN is higher for Class I objects than at either of the subsequent Flat-Spectrum or Class II stages. The median disc mass is below an MMSN at all stages, but at Class I only just so333Millimetre photometry may somewhat over-estimate Class I disc masses, if the remnant envelopes contribute some flux., and also 7/38 objects (18 7 %) have disc-masses of 2-25 MMSN as in many giant-planet formation models. The previous results on the low fraction of MMSN are clearly dominated by the preponderence of Class II discs, with Class I/FS objects representing briefer stages and thus fewer examples seen at snapshots in time. The mean disc-mass declines after Class I, but the median mass only drops after the FS stage, when a large tail of upper limits appears within Class II. Combined with the remnant discs of Class III, many systems have very low masses by the few-Myr epoch.
2.4 Comparison to planetary systems
We now consider the mass budget needed in early-time discs to form the observed extrasolar planets. Analysis of Doppler surveys (Cumming et al., 2008) shows that approximately 18 % of Sun-like stars should host a giant planet, of above about Saturn’s mass and orbiting within 20 AU. The results are based on extrapolations of detections made so far, but are consistent with different extrapolation methods. The typical planet mass is about that of Jupiter, and a little over half of these systems should host a body orbiting at about 3 AU outwards, comparable to the location of the Sun’s gas giants. Within this region, microlensing surveys indicate that Neptune-mass planets are at least three times more abundant than Jupiters (Sumi et al., 2010). Multiple planetary systems are expected to be common, with over a quarter of those found by Doppler wobble already known to have two or more gas giants (Wright et al., 2009).
If giant planets orbiting at a few AU are common, early-time disc-mass reservoirs of a few MMSN are expected. A high surface density of solids is needed to build massive planetary cores, with subsequent accretion of large masses of volatiles in the case of gas giants. Dodson-Robinson et al. (2009) find that with 120 of material (6 MMSN), all four of the Sun’s giant planets could be made, including non-water ices for speeding up the sticking of planet cores. Desch (2007) argues for a steeper-profiled initial nebula with later outwards migration of the ice giants, but still finds at least of order 60 (3 MMSN) within 30 AU is required444Some of these authors’ assumptions are slightly different to ours. Dodson-Robinson et al. (2009) adopt a gas-to-dust mass ratio of 70 not 100, and Desch (2007) adopts a smaller MMSN of 13 for a steep disc profile.. Alibert et al. (2005) have accounted for various properties of Jupiter and Saturn in model discs of 35-50 , or 1.75-2.5 MMSN.
According to thse models, giant-planet systems should be rare, if the discs seen in the time-snapshot from the millimetre surveys represent true budgets of planet-forming material. Only 4 % of stars host discs of MMSN, as required in the most optimistic models for gas giants (Alibert et al., 2005). However, the giant planet detection rate is already 7 % in the regime where surveys are close to complete, and extrapolated to 18 % out to 20 AU (Cumming et al., 2008), or even higher including lower-mass ‘ice giant’ planets (Sumi et al., 2010). Therefore, even if only the most massive discs go on to form planets, there is apparently a major discrepancy in the statistics, with more exo-planet systems than discs suitable to make them.
3 Solutions
As discussed above, the millimetre dust data may under-estimate the true total disc masses, if any of the several assumptions are incorrect. Corrections to dust emissivities, relative populations of large and small grains, and gas-to-dust proportions could globally shift the distributions towards higher masses. However, to reproduce % of giant-planet systems (Cumming et al., 2008) requires all discs in the millimetre surveys of nominally to be planet-forming, whereas the models need at least 35 of material (Alibert et al., 2005). Since an increase of a factor of to all millimetre-derived masses would be both substantial and ad hoc, we now consider if other assumptions may be wrong. In particular, we consider further solutions to the missing-mass problem, of three kinds:
-
1.
mass is used more efficiently than was the case in the Solar System, with migrating planets sweeping up much of the disc;
-
2.
more mass is ‘hidden’ at small scales in the centre of the disc, with no increase of millimetre emission as the dust is optically thick;
-
3.
the T Tauri discs observed are only remnants, with most of the dust grains growing into larger bodies during the protostellar stage – this could range from cm-sized rocks up to fully-formed planets under the disc instability hypothesis, discussed below.
3.1 Migration
The Solar System gas giants are thought to have migrated only slightly from their formation positions (Minton & Malhotra, 2009, e.g.), but exo-planets may have undergone larger orbit changes. ‘Hot Jupiters’ must have migrated significantly inwards, potentially sweeping large disc regions clean of material. Highly efficient usage of the disc mass-reservoir – in contrast to % of the MMSN that ended up in planets (Davis, 2005) – might hypothetically explain how the discs can be of low-mass and yet still form planets. However, long formation times in the outer disc will set limits, as cores here would accrete mass slowly and have migrated little by the time the disc disperses. Therefore it is implausible that the entire disc could be swept up into planets.
If disc-sweeping during migration is important, there should be observational signatures in the properties of exo-planets. For example, in systems with two planets, the outer one would tend to be of lower mass if it has passed through areas already swept clean by the migration of the inner body. If the two planets have both ended up close-in to the star, this trend should be particularly marked, whereas if the two planets are well separated, they could have swept the inner and outer disc independently and so not show such a trend. We searched for such signatures among multiple-planet systems, using only the parameter space and semi-major axis AU, where discoveries are thought to be almost complete (Cumming et al., 2008). This avoids a bias where lower-mass planets on large orbits are harder to detect (i.e. smaller Doppler-wobble) and so such systems would be missing from the multi-planet plot. Considering the well-studied volume of Sun-like (FGK) stars within 60 pc, 10 systems have two planets within our chosen parameter space and And has three (Figure 3).
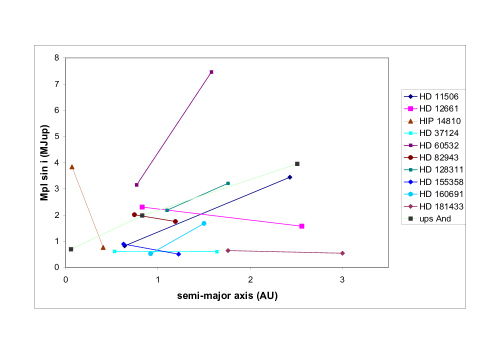
These data do not support the idea that accreting planets have swept up much of the disc. In particular, only one system in Figure 3 (HIP 14810) appears to have a ‘starved’ outer planet and both bodies ending up near the star. Also, 5/11 of the systems have outer planets that are more massive than the inner planet, contradictory to the idea of sweeping through already-depleted regions of the disc.
From a theoretical perspective, a further problem with the idea that migration can aid planet-building is that most of the gas accretion occurs in a runaway phase, with a timescale much shorter than typical migration timescales (Pollack et al., 1996; Ikoma et al., 2000; Bryden et al., 2000). Migration is thus implausible as a mechanism that allows a planet to sweep up its bulk in gas from a large region of the disc. However, migration could aid in the growth of the solid planetary core (Hourigan & Ward, 1984; Rice et al., 2003), and this could allow the core to reach a critical mass to attract an atmosphere, while there is still sufficient gas in the disc. While migration is thus still important to planetary evolution, neither theory or observational constraints suggest that it solves the ‘missing-mass’ problem of discs.
3.2 Centrally-concentrated discs
Small corrections for opacity are known to be needed when converting millimetre dust emission from T Tauri discs into masses. Andrews & Williams (2007b) estimate that the ratio of optically thick to optically thin submillimetre emission is typically around 0.3, as more opacity would result in flattening of the spectrum. However, if the discs have a massive central inner region, on unresolved scales of tens of AU or less, then this could be much more optically thick – contributing significant mass, but little extra millimetre signal. Zhu et al. (2009); Rice & Armitage (2009) have recently shown that if discs are massive with respect to the star, then transport of angular momentum through disc self-gravity does in fact lead to a pile-up of material at smaller radii. A quasi-steady-state is reached in which % of the disc mass ends up within 10-20 AU of the star, with a drop to lower surface densities in the model outer disc extending to 50 AU. There is thus a physical basis for the idea of a central mass concentration, at scales relevant to planet formation.
| protostar | wavelength | reference | ||||
|---|---|---|---|---|---|---|
| (mm) | () | () | (M⊙) | |||
| L 1448 IRS2 | 2.7 | 0 | 5 | 0.08 | 0 | Kwon et al. (2009) |
| NGC 1333 IRAS4A | 2.7 | 0 | 14-16 | 0.24 | 0 | Looney et al. (2003) |
| B 335 | 1.2 | ()4 | 3 | 0.05 | 0.1 | Harvey et al. (2003) |
| VLA 1623 | 0.8 | ()4-10 | 1 | 0.02 | 0.4 | Brown et al. (2000) |
| Ser SMM3 | 0.8 | ()4-16 | 8 | 0.13 | 0.1 | Brown et al. (2000) |
| L 1448 IRS3B | 2.7 | 30 | 7 | 0.11 | 0.3 | Looney et al. (2003) |
| L 1551 IRS5 S | 7 | 30 | 7 | 0.11 | 0.3 | Rodríguez et al. (1998) |
| L 483 mm | 2.6 | 40 | 9 | 0.14 | 0.3 | Jørgensen et al. (2004) |
| L 1448 C | 1.4 | ()40 | 5 | 0.08 | 0.5 | Schöier et al. (2004) |
| Ser SMM1 | 0.8 | ()50-80 | 46 | 0.7 | 0.1 | Brown et al. (2000) |
| L 1551 IRS5 N | 7 | 60 | 23 | 0.4 | 0.2 | Rodríguez et al. (1998) |
| NGC 1333 IRAS2A | 2.7 | 60 | 16-30 | 0.4 | 0.2 | Looney et al. (2003) |
| NGC 1333 SVS13B | 2.7 | 60 | 22 | 0.35 | 0.2 | Looney et al. (2003) |
| NGC 1333 SVS13A | 2.7 | 80 | 19 | 0.3 | 0.3 | Looney et al. (2003) |
| L 1157 | 2.7 | 110 | 11 | 0.18 | 0.6 | Kwon et al. (2009) |
| NGC 1333 IRAS4B | 2.7 | 120 | 5 | 0.08 | 1.5 | Looney et al. (2003) |
| IRAS 16293 A | 1.4 | ()240 | 11 | 0.18 | 1.4 | Schöier et al. (2004) |
| IRAS 16293 B | 7 | 300-400 | 16 | 0.26 | 1.4 | Rodríguez et al. (2005) |
| Ser FIRS1 | 1.1 | ()1000 | 46 | 0.75 | 1.3 | Enoch et al. (2009) |
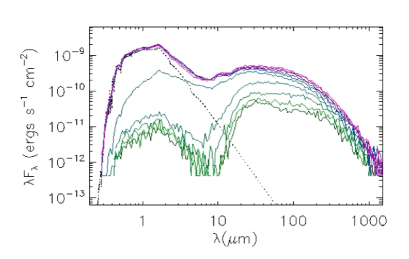
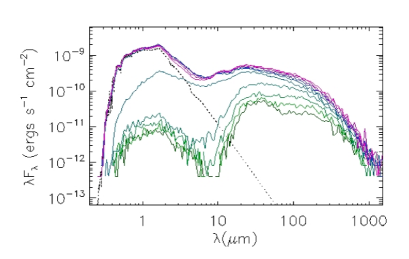
Figure 5 shows representative spectral energy distributions (SED) of the star plus disc system – generated using the HO-CHUNK: 3D radiation transfer code (Whitney et al., 2003) – for a standard power-law distribution of disc mass (top panel), and a case where more material has been artifically added inside 10 AU to double the total disc material (bottom panel). There is very little difference in the SED of the power-law and centrally-enhanced discs, especially in the millimetre regime that is canonically ‘mass tracing’. In fact, the centrally condensed disc has a submillimetre flux that is slightly lower than that from the lower-mass, power-law disc. Therefore, if real discs are in fact massive, a central pile-up would be both theoretically predicted (Rice & Armitage, 2009) and not detected in millimetre images where the inner disc is unresolved. This provides a potential solution to the missing mass, at least for discs with moderately high mass estimates already.
3.3 Disc masses at early times
As discussed above, discs have higher mass at earlier evolutionary stages. At Class I, the fraction of objects hosting 2-25 MMSN is around 18 %, in the regime of Jupiter-building models, and also matching the 18 % of gas-giant planet systems inferred around mature stars (Cumming et al., 2008). However, if planetary cores can grow this early on – which could indeed occur if migration were to accelerate the core growth as noted above – then in principle the process could even start in the Class 0 protostar phase, within the first 0.1 Myr. At this time the central object is only partly accreted, and much of the mass of the system is still in a circumstellar envelope. Millimetre photometry will be dominated by the envelope flux, but many of the Class 0 objects have now been studied with millimetre-wavelength interferometry. This resolves out the large-scale envelope emission, leaving in most cases a compact or point-like signal attributed to a very young disc.
Table 3 lists these interferometry-based results, in order of increasing disc mass. The mass estimates were made with different methods and assumed temperatures and emissivities, and may be lower limits at mm if the inner disc has non-negligible opacity, so only rough comparisons may be made. However, among these 19 Class 0 objects, half now host upwards of 2 MMSN, increased three-fold over the equivalent population within Class I. This continues the trend of finding more substantial discs at each earlier phase studied, and is very promising for forming many future planetary systems. If these larger dust masses at the Class 0 stage represent most closely a true ‘initial mass reservoir’ for planet formation, then the small quantities observed during Classes I, FS and II suggest that dust has been converted into larger pebbles and boulders, and perhaps planetesimals if core accretion has proceded successfully. In the grain growth models of Dullemond & Dominik (2005), metre-sized boulders are abundant by ages of a few years, i.e. in the Class I stage, and planetesimals can aggregate into planetary cores over a similar timescale (Hubickyj et al., 2005).
3.3.1 Planet formation by gravitational instability
In addition, as the protostar is largely assembled in the Class 0 phase, it must for part of this period have much less than its final mass. Therefore, as the discs are mostly substantial, can be high, raising the possibility of forming planets by the alternative mechanism where gravitational instability leads to disc fragmentation. To attempt to quantify this, we estimate masses for the protostars assuming that the bolometric luminosity is supplied by the energy released in infall. The accretion rate is taken to be M⊙ yr-1, i,e, building most of an star in about 0.1 Myr (Evans et al., 2009). The mass of the protostar is then derived from , taking to be after André & Montmerle (1994). The protostellar radii have not been measured but for pre-main-sequence phases should be moderately independent of mass (Whitney et al., 2004). values may be uncertain by factors up to a few, as disc opacities, stellar radii and accretion rates are not known for individual systems.
The estimates in Table 3 suggest that half of the discs should be unstable to fragmentation, with of roughly 0.3 or more. In four cases, the disc appears to actually out-weigh the star, as in some models of Hueso & Guillot (2005); Rice et al. (2009). The stellar masses are low, as expected if the stars are not yet fully built. The protostars estimated to be the most massive also tend to have higher-mass discs, as do the objects in binary systems (i.e. names ending in A, B, N or S). However, most of the short-wavelength data happens to be for the single systems, so these could simply have disc masses that are under-estimated due to dust opacity.
One problem with the idea of forming planets early on via disc fragmentation is that theoretical calculations, both semi-analytic (Matzner & Levin, 2005; Rafikov, 2005; Rice & Armitage, 2009; Clarke, 2009) and numerical (Boley et al., 2006; Stamatellos & Whitworth, 2008), suggest that planetary mass bodies will not form inside AU. It is likely that these extremely massive Class 0 discs would instead become globally unstable (Lodato & Rice, 2005), moving large amounts of mass to large radii, where fragmentation could produce substellar, or even stellar, mass companions (Stamatellos & Whitworth, 2009). However, the presence of spiral structures in the massive disc could help to collect together solid particles (Haghighipour & Boss, 2003; Rice et al., 2004) and thus accelerate planet formation via the mechanism of core accretion. Thus massive discs at very early times may still be a promising signpost to abundant planetary systems around mature main-sequence stars.
4 Conclusions
The compilation of millimetre data for circumstellar discs in 1-2 Myr-old star formation regions confirms that the observable mass reservoirs are small, at these snapshots in time. The fraction of discs apparently capable of forming gas giants by core accretion is generically less than the fraction of observed exo-planet systems. An early start to planetary growth is favoured, as the fractions of exo-planets and suitable proto-planetary discs do match in the Class I stage. We also considered other solutions to the ‘missing mass’ problem. Sweeping up the disc material efficiently into planets has both observational and theoretical difficulties. More promisingly, viscous evolution through disc self-gravity could produce a central concentration of mass that would be optically thick even in the millimetre, and so essentially invisible. At very early times (Class 0), the discs are both massive and at a high mass-fraction with respect to the star, so growth into larger bodies could even start at this very early phase when the star is only part-completed. In conclusion, most of the dust discs seen around Class II classical T Tauri stars are too insubstantial for commencing to grow planets, and so these should be relics, in the sense that the initial mass reservoir in dust grains has already been converted to larger forms with little millimetre emission. This growth process around a particular star could have reached anywhere from small rocks up to planetesimals or even completed gas giant planets, especially if the rapid disc instability mechanism operates.
Acknowledgments
We thank STFC and SUPA for support, and Kenny Wood for insightful remarks that inspired the early stages of this project.
References
- Alibert et al. (2005) Alibert Y., Mousis O., Mordasini C., Benz W., 2005, ApJ 626, L57
- André & Montmerle (1994) André P., Montmerle T., 1994, ApJ 420, 837
- Andrews & Williams (2007b) Andrews S.A., Williams J.P., 2007, ApJ 659, 705
- Andrews & Williams (2007a) Andrews S.A., Williams J.P., 2007, ApJ 671, 1800
- Andrews & Williams (2005) Andrews S.A., Williams J.P., 2005, ApJ 631, 1134
- Bary et al. (2008) Bary J.S., Weintraub D.A., Shukla S.J., Leisenring J.M., Kastner J.H., 2008, ApJ 678, 1088
- Boley et al. (2006) Boley A.C., Mejia A.C., Durisen R.H., Cai K., Pickett M.K., D’Alessio P., 2006, ApJ, 651, 517
- Brown et al. (2000) Brown D.W., Chandler C.J., Carlstrom J.E., Hills R.E., Lay O.P., Matthews B.C., Ricer J.S., Wilson C.D., 2000, MNRAS 319, 154
- Bryden et al. (2000) Bryden G., Lin D.N.C., Ida S., 2000, ApJ, 544, 481
- Carpenter (2002) Carpenter J.M., 2002, AJ 124, 1593
- Clarke (2009) Clarke C.J., 2009, MNRAS, 396, 1066
- Cumming et al. (2008) Cumming A., Butler R.P., Marcy G.W., Vogt S.S., Wright J.T., Fischer D.A., 2008, PASP 120, 531
- Davis (2005) Davis S. S., 2005, ApJ 627, L153
- Dent et al. (2005) Dent W.R.F., Greaves J.S., Coulson I M., 2005, MNRAS 359, 663
- Desch (2007) Desch S.J., 2007, ApJ 671, 878
- Dodson-Robinson et al. (2009) Dodson-Robinson S.E., Willacy K., Bodenheimer P., Turner N.J., Beichman C.A., 2009, Icarus 200, 672
- Draine (2006) Draine Draine B.T., 2006, ApJ 636, 1114
- Dullemond & Dominik (2005) Dullemond C.P., Dominik C., 2005, A&A 434, 971
- Enoch et al. (2009) Enoch M.L., Corder S., Dunham M.M., Duchêne G., 2009, ApJ 707, 103
- Ercolano et al. (2009) Ercolano B., Clarke C.J., Drake J.J., 2009, ApJ 699, 1639
- Evans et al. (2009) Evans N.J. et al., 2009, ApJS 181, 321
- Haghighipour & Boss (2003) Haghighipour N., Boss A.P., 2003, ApJ, 583, 996
- Harvey et al. (2003) Harvey D.W.A., Wilner D.J., Myers P.C., Tafalla M., Mardones D., 2003, ApJ 583, 809
- Henning et al. (1993) Henning T., Pfau W., Zinnecker H., Prusti T., 1993, A&A 276, 129
- Hourigan & Ward (1984) Hourigan K., Ward W.R. 1984, Icarus, 60, 29
- Hubickyj et al. (2005) Hubickyj O., Bodenheimer P., Lissauer J. J., 2005, Icarus 179, 415
- Hueso & Guillot (2005) Hueso R., Guillot T., 2005, A&A 442, 703
- Ikoma et al. (2000) Ikoma M., Nakazawa K., Emori H., 2000, ApJ, 537, 1013
- Jørgensen et al. (2004) Jørgensen J.K., 2004, A&A 424, 589
- Kenyon & Hartmann (1995) Kenyon S.J., Hartmann L., 1995, ApJS 101, 117
- Kwon et al. (2009) Kwon W., Looney L.W., Mundy L.G., Chiang H.-F., Kemball A.J., 2009, AJ 696, 841
- Lavalley et al. (1992) Lavalley M., Isobe T., Feigelson E., 1992, A.S.P. Conference Series, Vol. 25, p. 245
- Lodato & Rice (2005) Lodato G., Rice W.K.M., 2005, MNRAS, 358, 1459
- Looney et al. (2003) Looney L.W., Raab W., Poglitsch A., Geis N., 2003, ApJ 597, 628
- Mann & Williams (2009) Mann R.K., Williams J.P., 2009, ApJ 699, L55
- Matzner & Levin (2005) Matzner C.D., Levin Y., 2005, ApJ, 628, 817
- Merín et al. (2008) Merín B. et al., 2008, ApJS 177, 551
- Minton & Malhotra (2009) Minton D.A., Malhotra R., 2009, Nature 457, 1109
- Muench et al. (2007) Muench A.A., Lada C.J., Luhman K.L., Muzerolle J., Young E., 2007, AJ 134, 411
- Nürnberger et al. (1997) Nürnberger D., Chini R., Zinnecker H., 1997, A&A 324, 1036
- Palla & Stahler (2000) Palla F., Stahler S.W., 2000, ApJ 540, 255
- Pollack et al. (1996) Pollack J.B., Hubickyj O., Bodenheimer P., Lissauer J.J., Podolak M., Greenzweig Y., 1996, Icarus 124, 62
- Porras et al. (2003) Porras A., Christopher M., Allen L., Di Francesco J., Megeath S.T., Myers P.C., 2003, AJ 126, 1916
- Rafikov (2005) Rafikov R.R., ApJ, 621, L69
- Rice et al. (2009) Rice W.K.M., Mayo J.H., Armitage P.J., 2009, MNRAS (online early, Dec.)
- Rice & Armitage (2009) Rice W.K.M., Armitage P.J., 2009, MNRAS, 396, 2228
- Rice et al. (2004) Rice W.K.M., Lodato G., Pringle J., Armitage P.J., Bonnell I.A., 2004, MNRAS, 372, L9
- Rice et al. (2003) Rice W.K.M., Armitage P.J., Bate M.R., Bonnell I.A. 2003, MNRAS, 346, L36
- Rodmann et al. (2006) Rodmann J., Henning Th., Chandler C.J., Mundy L.G., Wilner D.J., 2006, A&A 446, 211
- Rodríguez et al. (2005) Rodríguez L.F., Loinard L., D’Alessio P., Wilner D.J., Ho P.T.P, 2005, ApJ 621, L133
- Rodríguez et al. (1998) Rodríguez L.F. et al., 1998, Nature 395, 355
- Schöier et al. (2004) Schöier F.L., Jørgensen J.K., van Dishoeck E.F., Blake G.A., 2004, A&A 418, 185
- Stamatellos & Whitworth (2009) Stamatellos D., Whitworth A.P., 2009, MNRAS 392, 413
- Stamatellos & Whitworth (2008) Stamatellos D., Whitworth A.P., 2008, A&A, 480, 879
- Sumi et al. (2010) Sumi T. et al., 2010, ApJ 710, 1641
- Ward-Thompson et al. (2007) Ward-Thompson D. et al., 2007, PASP 119, 855
- Whitney et al. (2004) Whitney B.A., Indebetouw R., Bjorkman J.E., Wood K., 2004, ApJ 617, 1177
- Whitney et al. (2003) Whitney B.A., Wood K., Bjorkman J.E., Wolff M.J., 2003, ApJ, 591, 1049
- Wright et al. (2009) Wright J.T., Upadhyay S., Marcy G.W., Fischer D.A., Ford E.B., Johnson J.A., 2009, ApJ 693, 1084
- Wyatt et al. (2007) Wyatt M.C., Clarke C.J., Greaves J.S., 2007, MNRAS 380, 1737
- Zhu et al. (2009) Zhu Z., Hartmann L., Gammie C.F., 2009, ApJ, 694, 1045