Dilemma game in a traffic model with the crossing111W. Zhang and W. Zhang contributed equally to this work.
Abstract
In this paper, we investigate the non-signalized intersection issue considering traffic flow and energy dissipation in terms of game theory based on the Nagel-Schreckenberg (NaSch) model. There are two types of driver agents at the intersection when vehicles on the two streets are approaching to it simultaneously: C agents (cooperative strategy) pulling up to avoid collision and D agents (defective strategy) crossing the intersection audaciously. Phase diagram of the system, which describes free-flow phase, segregation phase, jammed phase and maximum current curve representing the social maximum payoff, is presented. Dilemma game is observed at the phase-segregated state except for the case of
pacs:
05.65.+b, 45.70.Vn, 89.40.BbI INTRODUCTION
Recently, traffic problems have attracted much attention of a community of physicists because of the observed nonequilibrium phase transitions and various nonlinear dynamical phenomena. In order to investigate the dynamical behavior of the traffic flow, a number of traffic models such as fluid dynamical models, gas-kinetic models, car-following models and cellular automata (CA)models1 ; 2 ; 3 ; 4 have been proposed. These dynamical approaches represented complex physical phenomena of traffic flow among which are hysteresis, synchronization, wide moving jams, and phase transitions, etc. Among these models, the advantages of CA approaches, which have been extensively applied and investigated, show the flexibility to adapt complicated features observed in real vehicular traffic1 ; 4 ; 5 . The Nagel-Schreckenberg (NaSch) model is a basic CA models describing one-lane traffic flow6 . Based on the NaSch model, many CA models have been extended to investigate the properties of the system with realistic traffic factors such as highway junctions, crossing, tollbooths and speed limit zone1 ; 4 ; 7 ; 8 ; 9 ; 10 .
Previously, scholars pay more attention to traffic flow while investigating vehicular traffic issues. Most recently, the problems of energy dissipation in traffic system have been investigated widely11 ; 12 ; 13 ; 14 ; 15 ; 16 ; 17 for environmental pollution and energy dissipation caused by vehicular traffic have become more and more significant in modern society. Intersections are fundamental units of complex city traffic networks. Optimization of traffic flow and energy consumption at a isolated intersection is a substantial ingredient for the task of global optimization of city networks. During the past ten years, physicists have paid notable attention to controlling traffic flow at intersections8 ; 18 ; 19 ; 20 ; 21 ; 22 . However, to our knowledge, none of these previous studies about intersections issue present energy dissipation information, which should be further investigated.
Signal control works only for major intersections but in most cases, signal system is not installed due to cost. Drivers at the intersection without signal system can only communicate each other by eye contact and make a decision based on own judgment. Most of the previous studies focus only on the kinetics of the self-driven multi particle system and ignore the effect of drivers’ decisions on the entire system. In this paper, considering traffic flow and energy dissipation, we add a game theory framework23 ; 24 ; 25 as a rational decision process to the traffic model with a non-signalized intersection, and demonstrate that the intersection has a dilemma structure. In addition, the phase diagram which shows the social maximum payoff is presented.
The paper is organized as follows. Section II is devoted to the description of the problem. In section III, the results of the numerical experiment are given and discussed. Finally, the conclusions are given in section IV.
II DESCRIPTION OF THE PROBLEM
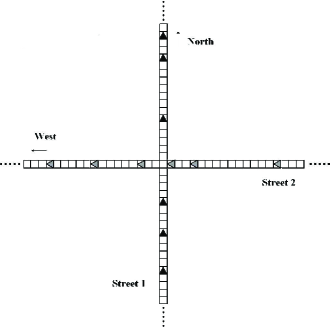
In this section, we present a CA model with two perpendicular one dimensional closed chains. The chains represent urban streets accommodating unidirectional vehicular traffic flow. The direction of traffic flow in the first chain is from south to north and from east to west in the second chain, as shown in figure 1. Each street consists of cells of equal size numbered by and the time is discrete. The two chains intersect each other at the sites on the first and second chains respectively. Each site can be either empty or occupied by a vehicle with the speed , , where is the speed limit. Let and denote the position and the velocity of the th car at time , respectively. The number of empty cells in front of the th vehicle is denoted by . The evolution dynamics is based on the Nagel-Schreckenberg (NaSch) model. The updating rules of the NaSch model are as follows:
(1) Acceleration:
(2) Slowing down:
(3) Stochastic braking:
with the probability
(4) Movement:
The above four steps for all vehicles update in parallel with periodic boundary.
Vehicles without interactions of vehicles on the perpendicular streets evolve under the NaSch dynamics. However, how does the vehicle approaching to the intersection evolve when vehicle on the other street approaches to the intersection simultaneously? The approaching driver to the intersection need considering not only the condition of it’s front vehicle but also the situation of the approaching vehicle on the perpendicular street. Different drivers perform differently even at the same condition. The decision-making process of the driver approaching to the intersection is described by game theory, i.e., we assume that drivers have a strategy that is either cooperative or defective. Cooperative drivers (C agents) pull up in the front of the intersection to avoid collision. Defective drivers (D agents) cross the intersection audaciously. At the same time, if the two drivers approaching to the intersection on the two streets are all D agents, i.e., the two drivers adopt defective strategy simultaneously, traffic accident would occur. Different from ”the prisoners’ dilemma”26 , one may find that ”non-tit-for-tat” (I’ll cooperate (defect) with you if you defect (cooperate) with me) is a comparatively effective strategy for playing the drivers’s dilemma. During the simulation, to avoid collision, we assume that at the same time if the driver approaching to the intersection on the first street is D agent (C agent), the driver approaching to the intersection on the second street adopts cooperative strategy (defective strategy). The probability of the situation that two approaching drivers to the intersection are D agents or C agents to occur is very small. In most cases of real traffic, only one approaching driver to the intersection is D agent and the other is C agent. Let denotes the probability that the driver approaching to the intersection on the first street adopt defective strategy when the other driver on the second street is also approaching to the intersection at the same time.
The payoff indicates traffic flow which is the product of the mean velocity and vehicle density. Except for traffic flow, energy problem is an important issue in traffic system. The kinetic energy of the vehicle with the velocity is , where is the mass of the vehicle. When braking the kinetic energy reduces. Let denotes energy dissipation rate per time step per vehicle. For simple, we neglect rolling and air drag dissipation and other dissipation such as the energy needed to keep the motor running while the vehicle is standing in our analysis, i.e., we only consider the energy lost caused by speed-down. The dissipated energy of th vehicle from time to is defined by
Thus, the energy dissipation rate
where is the number of vehicles in the system and is the relaxation time, taken as . In this model, the particles are ”self-driven” and the kinetic energy increases in the acceleration step. In the stationary state, the value of the increased energy while accelerating is equivalent to that of the dissipated energy caused by speed-down, and the kinetic energy is constant in the system.
In the simulation, the system size and are selected where () is the number of vehicles on the first street (second street) , and the stochastic braking is not considered, i.e., . The numerical results are obtained by averaging over 20 initial configurations and time steps after discarding initial transient states.
III NUMERICAL RESULTS
First of all, we investigate the influences of the drivers’ decision on the social average payoff based on the deterministic NaSch model with the speed limit . Figure 2 shows the average payoff as a function of the vehicle density with the probability 0 Because of the equivalence of the two streets, the condition inverts while 0.5 As shown in Fig. 2, there is a critical density below which has no influence on social average payoff and increases linearly with the vehicle density. Above the critical density undergoes a short rapid increase or decrease after which the plateau arises whose height and length are determined by the probability After the plateau, exhibits linear decrease with the increase of vehicle density. The intersection of the two streets makes the crossing point appear as a sidewise dynamical defective site. The localized defect has global effects whereby the traffic exhibits macroscopic phase segregation into low-density and high-density regions. For the first street, the smaller the probability is, the stronger is the dynamic defect. Considering the payoff of each street, the larger the probability that an approaching driver to the intersection adopts defective strategy, the larger the payoff of the driver and the street on which the agent drivers are. However, for different vehicle density, the maximum social mean payoff corresponds to different values of
Except for there are two critical density below which is largest in the case of and above which is largest in the case of . For the whole density region, the maximal social average payoff appears at the critical density
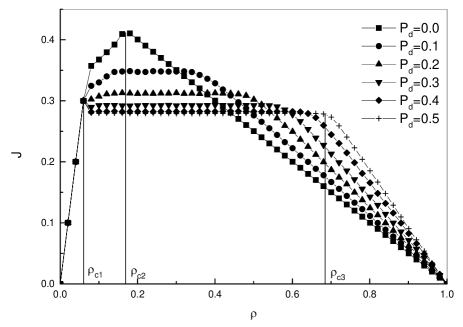
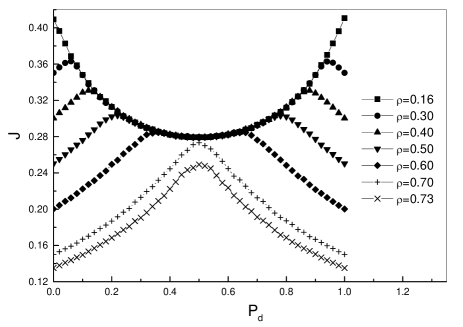
Figure 3 exhibits the relation of to the probability with various values of the vehicle density in the case of . As expected, the symmetry center of the curve is at for the two streets are equivalent in our model. While , with the increase of the probability first increases and then decreases after a maximum value is reached. In the density interval , increases with to the maximum, then it decreases with until After the point, exhibits an increase and decreases subsequently after the maximum is reached. In the density interval with the increases of the probability first decreases and increases after a minimum value is reached. It is noted that when at the probability interval that the two maximal appears, curves collapse into one curve which is the social payoff at .
Except for fundamental diagram ( versus ), it is worthwhile to investigate the energy dissipation diagram of the system with a intersection. Figure 4 shows the relation of energy dissipation rate to the vehicle density with various values of in the case of . As shown in Fig. 4, there are three critical density below which no energy dissipation occurs, at which there is no energy dissipation in the case of and above which is largest when While with the decrease of energy dissipation rate reduces. And while is minimal in the density interval , which is contrary to traffic flow The value of decreases as increases in the middle density region, but increases in the high density region.

From the viewpoint of individual benefit, adopting the higher payoff strategy is more rational than using the opposite strategy. For agents on the first street, the larger the is, the more payoff they obtain. For agents on the second street, the smaller the is, the more payoff they acquire. When the system reaches equilibrium state, the probability that drivers approaching to the intersection adopt defective strategy is However, when the average social payoff is not maximum, but minimum in the density interval , which is a social dilemma.
From Fig. 2 and 4, one should noted that in the density interval , if i.e., drivers on the first street (second street) are all C agents (D agents), the payoff of the whole system is maximal and energy dissipation is minimal. The best situation having high social efficiency is that drivers on one of the two streets always pull up and let drivers on the other street cross, while the interactions of vehicles on the two streets emerges. However, C agents pulling up for a long time has a robust incentive to adopt defective strategy for D agents can obtain higher payoff than C agents. Thus, the probability always increases, finally reaching absorbed equilibrium where the probability that D agents appear on the two streets is the same.
When , the internal equilibrium point is consistent with the social maximum payoff where no social dilemma occurs. This implies that in the jam state D agents appearing on the two streets with the same probability can improve flow efficiency of the system, rather than only drivers on the second street adopt defective strategy.

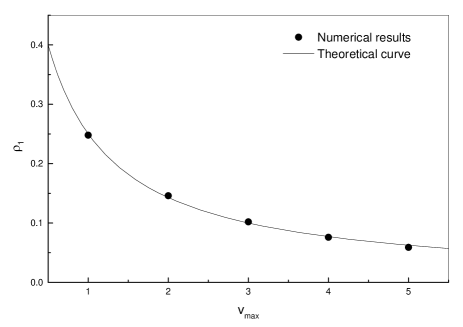
Figure 5 shows the - phase diagram with the speed limit . There are four traffic phases: free-flow, phase-segregated 1, phase-segregated 2 and jammed phase, which are separated by the critical density , and , as shown in Fig. 5. The solid circle symbols in Fig.5 represent the maximum social payoff. In the free-flow phase in which vehicles can move freely, there are no interactions of vehicles in the system and no energy dissipation to occur. In the phase-segregated region, the macroscopic traffic phase segregates into high-density and low-density region. In the phase-segregated 1 state, the maximal current consists with the minimal energy dissipation rate. The maximum social payoff appears at or In the phase-segregated 2 state, however, the maximal current consists with the maximal energy dissipation rate and increases with traffic flow The probability consistent with the maximal current increases exponentially with the increase of vehicle density while However, when consistent with the maximal current decreases with the increase of In the jammed phase, the probability consistent with the maximal current is independent of and equals 0.5.
Next, we quantitatively analyze the critical density , and for different speed limit . While the mean distance-headway is greater than 3, there are no interactions of vehicles in the system and vehicles on the perpendicular streets can move freely. Consequently, the critical density below which vehicles move freely and no energy dissipation occurs, can be written as
Figure 6 exhibits the relation of the critical density to the speed limit Formula (3) gives an agreement with numerical results in Fig.6. At the critical density vehicles on the second street (first street) can move freely in the case of (). Thus, the critical density is given as
Above the critical density high-density region expands into the whole system. The critical point is not determined by the speed limit and in the case of can be written as
However, for the case of , traffic flow and energy dissipation exhibit different features. As shown in Fig. 7, there is only one plateau whose height value is equal to 0.25 for different values of The length of the plateau increases with the increase of for 0.0 In the case of there is no plateau and the maximal whose value equals to 0.25, appears at the critical density point above which exhibits linear decrease with the increase of vehicle density. After the critical density the social average payoff is maximum in the case of and is minimum in the case of Consequently, there is no social dilemma in the case of .
In the plateau region, for the case of , the probability that a approaching vehicle on the first street crosses the intersection per time step is and is (1- on the second street. Thus, the social average payoff in the plateau region is 0.25 and does not depend on
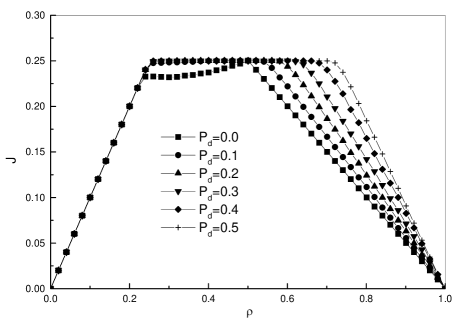
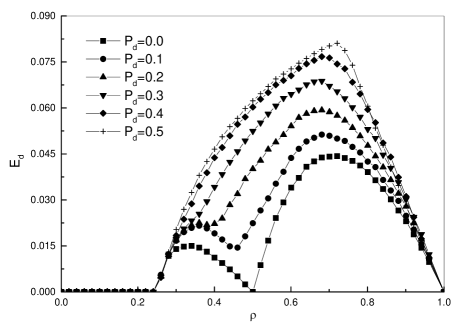
Figure 8 shows energy dissipation rate as a function of the vehicle density with various values of the probability in the case of . As shown in Fig.8, there are two critical density below which no energy dissipation occurs, and at which no go-and-stop vehicles appear when The energy dissipation rate increases with the increase of for 0.0 which is different from that for . Considering the - phase diagram, there is no differences between phase-segregated 1 and phase-segregated 2, and consistent with the maximal social payoff is always equal to 0.5 and independent of in phase-segregated and jammed states (not shown). Therefore these results indicate that different correlations of spacetime exist between the case of and
IV SUMMARY
In this paper, we investigated the social dilemma structure in a traffic model with a non-signalized intersection based on the NaSch model. The model contains a game theory framework to deal with drivers’ decision-making processes. We studied the effects of the drivers’ decision on traffic flow and energy dissipation at different traffic phases.
Numerical results indicate that in the case of the social dilemma appears at the phase-segregated states and no dilemma exists at other traffic phases. At the phase-segregated states, selfish drivers crossing the intersection can obtain a higher payoff than altruistic drivers pulling up in the front of the intersection, but they cause a remarkable decrease in social efficiency when they emerge alternately on the two streets. In contrast to the phase-segregated states, in the jammed phase, the social efficiency is maximal at the absorbed equilibrium Different from that in the case of in the case of there is no dilemma to occur no matter in the phase-segregated and jammed states.
In addition, the three critical density and were analyzed quantitatively and theoretical analyses give an excellent agreement with numerical results. However, explicit expressions about the maximum social payoff curve in the - phase diagram do not be obtained because of effects of long length of time space correlations, and deserve further investigate.
References
- (1) D. Chowdhury, L. Santen, and A. Schadschneider, Phys. Rep. 329, 199 (2000), and references therein.
- (2) D. Helbing, Rev. Mod. Phys. 73, 1067 (2001).
- (3) T. Nagatani, Rep. Prog. Phys. 65, 1331 (2002).
- (4) S. Maerivoet and B. De Moor, Phys. Rep. 419, 1 (2005).
- (5) A. Yamauchi, J. Tanimoto, A. Hagishima and H. Sagara, Phys. Rev. E 79, 036104 (2009).
- (6) K. Nagel and M. Schreckenberg, J. Phys. I 2, 2221 (1992).
- (7) K. Lee, P. M. Hui, B. H. Wang and N. F. Johnson, J Phys Soc Jpn, 70, 3507 (2001).
- (8) M. E. Foulaadvand and S. Belbasi, J. Phys. A: Math. Gen. 40, 8289 (2007).
- (9) D. W. Huang and W. N. Huang, Physica A 312, 597 (2002).
- (10) W. Zhang, X. Q. Yang, D. P Sun, K. Qiu and H. Xia, J. Phys. A: Math. Gen. 39, 9127 (2006).
- (11) A. Nakayama, Y. Sugiyama and K. Hasebe, Phys. Rev. E 65, 016112 (2001).
- (12) T. Wang, Z. Y. Gao and X. M. Zhao, Acta Phys. Sin. 55, 634 (2006).
- (13) W. Shi and Y. Xue, Physica A 381, 399 (2007).
- (14) B. A. Toledo, E. Cerda, J. Rogan, V. Munoz, C. Tenreiro, R. Zarama and J. A. Valdivia, Phys. Rev. E 75, 026108 (2007).
- (15) W. Zhang, W. Zhang, and X.-Q. Yang, Physica A 387, 4657 (2008).
- (16) H. H. Tian, Y. Xue, S. J. Kan and Y. J. Liang, Acta. Phys. Sin. 58, 4506 (2009).
- (17) W. Zhang and W. Zhang, arXiv:0904.3727v2 (2009).
- (18) M. E. Fouladvand and M. Nematollahi, Eur. Phys. J. B 22 395 (2001).
- (19) M. E. Fouladvand, Z. Sadjadi and M. R. Shaebani, J. Phys. A: Math. Gen. 37 561 (2004).
- (20) B. Ray and S. N. Bhattacharyya, Phys. Rev. E 73 036101 (2006).
- (21) M. Krbalek, J. Phys. A: Math. Theor. 41 205004 (2008).
- (22) D. F. Xie, Z. Y. Gao, X. M. Zhao and K. P. Li, Physica A 388 2041 (2009).
- (23) J. Maynard Smith, Evolution and the theory of games (Cambridge University Press, 1982).
- (24) J. Tanimoto and H. Satara, Biosystems 90 105 (2007).
- (25) A. Yamauchi, J. Tanimoto, A. Hagishima and H. Sagara, Phys. Rev. E 79, 036104 (2009).
- (26) R. Axelord, The evolution of cooperation (Basic Books, New York, 1984).