11email: meixner@stsci.edu 22institutetext: Visiting Scientist at Smithsonian Astrophysical Observatory, Harvard-CfA, 60 Garden St., Cambridge, MA, 02138, USA 33institutetext: CEA, Laboratoire AIM, Irfu/SAp, Orme des Merisiers, F-91191 Gif-sur-Yvette, France 44institutetext: Center for Astrophysics, 60 Garden St., MS 67, Harvard University, Cambridge, MA 02138, USA 55institutetext: Spitzer Fellow 66institutetext: Steward Observatory, University of Arizona, 933 North Cherry Ave., Tucson, AZ 85721, USA 77institutetext: Centre d’ Étude Spatiale des Rayonnements, CNRS, 9 av. du Colonel Roche, BP 4346, 31028 Toulouse, Fr 88institutetext: Department of Astronomy, Lab for Millimeter-wave Astronomy, University of Maryland, College Park, MD 20742-2421, USA 99institutetext: Observatoire Astronomique de Strasbourg, 11, rue de l’universite, 67000 STRASBOURG, France 1010institutetext: Department of Astronomy, 475 North Charter St., University of Wisconsin, Madison, WI 53706, USA 1111institutetext: Johns Hopkins University, Department of Physics and Astronomy, Homewood Campus, Baltimore, MD 21218, USA 1212institutetext: Louisiana State University, Department of Physics & Astronomy, 233-A Nicholson Hall, Tower Dr., Baton Rouge, LA 70803-4001, USA 1313institutetext: Department of Astronomy, University of Virginia, and National Radio Astronomy Observatory, PO Box 3818, Charlottesville, VA 22903, USA, 1414institutetext: Department of Astrophysics, Nagoya University, Chikusa-ku, Nagoya 464-8602 , Japan 1515institutetext: Centre for Supercomputing and Astrophysics, Swinburne University of Technology, Hawthorn VIC 3122, Australia 1616institutetext: Sterrewacht Leiden, Leiden University, P.O. Box 9513, NL-2300 RA Leiden, The Netherlands 1717institutetext: Jodrell Bank Centre for Astrophysics, Alan Turing Building, School of Physics & Astronomy, University of Manchester, Oxford Road, Manchester M13 9PL, United Kingdom 1818institutetext: Astronomy & Space Science, Sejong University, 143-747, Seoul, South Korea 1919institutetext: 314 Physics Building, Department of Physics and Astronomy, University of Missouri, Columbia, MO 65211, USA 2020institutetext: Department of Physics and Astronomy, Iowa State University, Ames, IA, 50011, USA 2121institutetext: Department of Physics and Astronomy, University College London, Gower Street, London WC1E 6BT, UK 2222institutetext: MSSL, University College London, Holmbury St. Mary, Dorking, Surrey RH5 6NT, UK 2323institutetext: School of Physical & Geographical Sciences, Lennard-Jones Laboratories, Keele University, Staffordshire ST5 5BG, UK 2424institutetext: Department of Physical Science, Osaka Prefecture University, Gakuen 1-1, Sakai, Osaka 599-8531, Japan 2525institutetext: Spitzer Science Center, California Institute of Technology, MS 220-6, Pasadena, CA 91125, USA 2626institutetext: Max-Planck-Institut für extraterrestrische Physik, Giessenbachstraße 85748 Garching, Germany 2727institutetext: Stratospheric Observatory for Infrared Astronomy, Universities Space Research Association, Mail Stop 211-3, Moffett Field, CA 94035 2828institutetext: Departamento de Astronomia, Universidad de Chile, Casilla 36-D, Santiago, Chile 2929institutetext: Observatories of the Carnegie Institution of Washington, 813 Santa Barbara St., Pasadena, CA, 91101 USA 3030institutetext: Astrophysique de Paris, Institute (IAP), CNRS UPR 341, 98bis, Boulevard Arago, Paris, F-75014, Fr 3131institutetext: Space Science Institute, 4750 Walnut St. Suite 205, Boulder, CO 80301, USA
HERschel Inventory of The Agents of Galaxy Evolution (HERITAGE): the Large Magellanic Cloud dust ††thanks: Herschel is an ESA space observatory with science instruments provided by European-led Principal Investigator consortia and with important participation from NASA.
The HERschel Inventory of The Agents of Galaxy Evolution (HERITAGE) of the Magellanic Clouds will use dust emission to investigate the life cycle of matter in both the Large and Small Magellanic Clouds (LMC and SMC). Using the Herschel Space Observatory’s PACS and SPIRE photometry cameras, we imaged a strip through the LMC, at a position angle of 22.5∘ as part of the science demonstration phase of the Herschel mission. We present the data in all 5 Herschel bands: PACS 100 and 160 m and SPIRE 250, 350 and 500 m. We present two dust models that both adequately fit the spectral energy distribution for the entire strip and both reveal that the SPIRE 500 m emission is in excess of the models by 6 to 17%. The SPIRE emission follows the distribution of the dust mass, which is derived from the model. The PAH-to-dust mass () image of the strip reveals a possible enhancement in the LMC bar in agreement with previous work. We compare the gas mass distribution derived from the HI 21 cm and CO J=1-0 line emission maps to the dust mass map from the models and derive gas-to-dust mass ratios (GDRs). The dust model, which uses the standard graphite and silicate optical properties for Galactic dust, has a very low making it an unrealistic dust model for the LMC. Our second dust model, which uses amorphous carbon instead of graphite, has a flatter emissivity index in the submillimeter and results in a that is more consistent with a GDR inferred from extinction.
Key Words.:
Galaxies: Magellanic Clouds, ISM: dust, Submillimeter: galaxies, ISM1 Introduction
The Large Magellanic Cloud (LMC) and the Small Magellanic Cloud (SMC) are the best astrophysical laboratories to study the lifecycle of the interstellar medium (ISM), because their proximity (50 kpc, e.g. Schaefer 2008; 61 kpc, Szewczyk et al. 2009) permits detailed studies of resolved ISM clouds and their relation to stellar populations on global scales, in an unambiguous manner, and as a controlled function of environment. Their sub-solar metallicities (, ; Dufour et al. 1982, Bernard et al. 2006) permit investigations on how processes governing galaxy evolution depend on metallicity. The Herschel Observatory (Pilbratt et al. 2010) open-time key program, entitled HERschel Inventory of The Agents of Galaxy Evolution (HERITAGE) in the Magellanic Clouds, will perform a uniform survey of the LMC (), SMC (), and the Magellanic Bridge () with the Spectral and Photometric Imaging Receiver (SPIRE) at 250, 350, and 500 m (Griffin et al. 2010) and with the Photodetector Array Camera and Spectrometer (PACS) at 100 and 160 m (Poglitsch et al. 2010). The HERITAGE science goals are to study the life cycle of matter in the Magellanic Clouds by probing the dust emission from the ISM and stars, which are the agents of galaxy evolution. Herschel SPIRE and PACS images provide key insights into the life cycle of galaxies because the far-infrared and submillimeter emission from dust grains is an effective tracer of the ISM dust, the most deeply embedded young stellar objects, and the dust ejected by evolved massive stars and supernovae.
During the science demonstration phase (SDP), we imaged a long strip across the LMC that covers the entire range of interesting objects we expect to study with HERITAGE: giant molecular and diffuse H I clouds (Roman-Duval et al. 2010; Kim et al. 2010), H II regions (Hony et al. 2010), young stellar objects (Sewiło et al. 2010), supernova remnants (Otsuka et al. 2010), and evolved stars (Boyer et al. 2010). In this paper, we present the observing strategy, processing and resulting data set (§ 2), the spectral energy distribution (SED) of the strip (§ 3) and the global spatial distribution of the dust and gas (§ 4).
2 Observations and data reduction
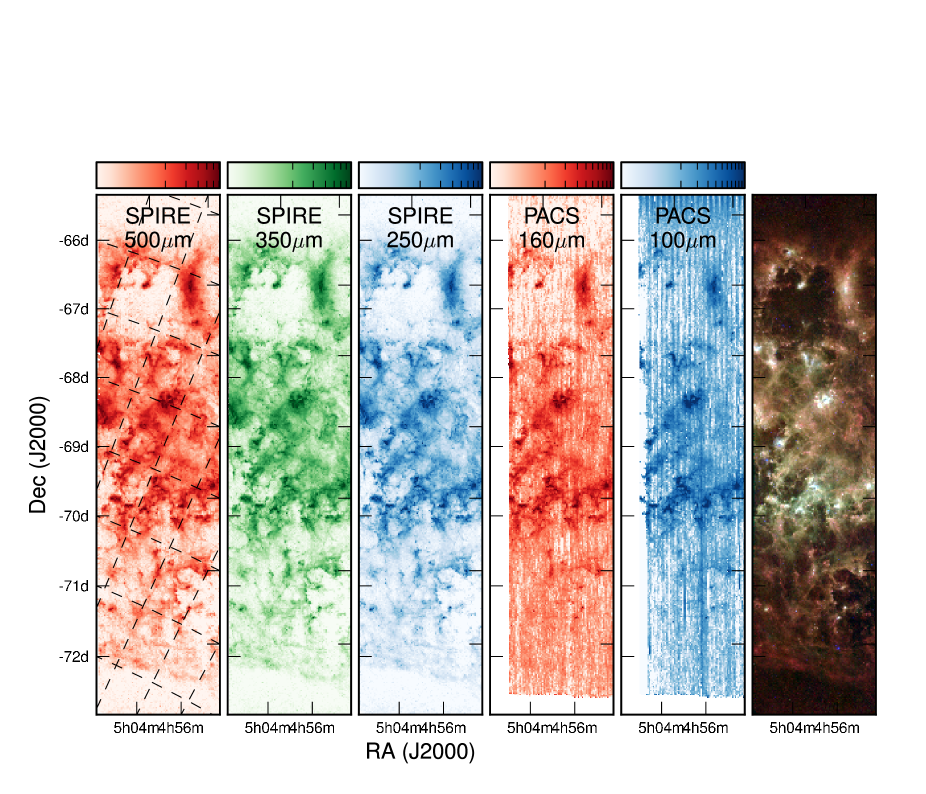
We observed a strip through the LMC, at a position angle of 22.5∘ using the Herschel Observatory instruments SPIRE and PACS in parallel observing mode. Observations began on November 22, 2009 at 23:00 h UT and lasted 18 hours. Two 9 hour astronomical observation requests (AORs) were constructed back-to-back in time to cover the region. The observed wavelength bands include PACS 100 and 160 m and SPIRE 250, 350 and 500 m (Fig. 1).
2.1 PACS data reduction
The PACS data were reduced starting from the level 0 product using the HIPE111HIPE is a joint development by the Herschel Science Ground Segment Consortium, consisting of ESA, the NASA Herschel Science Center, and the HIFI, PACS and SPIRE consortia. version 2.0 data reduction software (Ott 2010). In particular, bad and saturated pixels were masked, and a flat field correction and the photometric calibration were applied. The baseline signal level of each bolometer was estimated at the beginning and end points of each scan leg which lie outside of the LMC. For each pixel and each scan leg, a linear fit linking these two points was subtracted from the corresponding timeline. The multi-resolution median transforms (MMT) deglitching algorithm was then applied to correct sudden jumps in the timeline, or glitches, due to cosmic ray hits on the detector.
Initial two-dimensional maps were created for the 100 and 160 m bands. However, severe striping appeared along the scan direction of the PACS maps. To mitigate the stripes, we subtracted an image of the striping, produced by unambiguously identifying the power spectrum associated with the stripes, from the PACS images. The peak-to-peak variation was reduced from 0.021 to 0.011 in the PACS 100 and 160 m images (Fig. 1). We do not use the PACS data for analysis in this paper, but anticipate that with cross-scans the PACS data will be viable for an extended map of the diffuse ISM. Nevertheless, the de-striping was effective for small regions (Otsuka et al. 2010) and revealing point sources (Sewiło et al. 2010; Boyer et al. 2010).
The PACS 160 m brightness values are systematically 15% lower than the corresponding MIPS 160 m values from Meixner et al. (2006) using the adopted HIPE 1.2 calibration tree which is consistent with the 20% absolute flux calibration error for PACS (Poglitsch et al. 2010). The accuracy of the PACS astrometry was estimated by comparing the positions of point sources detected in Spitzer and PACS images of the LMC. We find offsets up to 6.5″, with no preferred direction, which have been traced to issues with the star trackers during very large scan maps.
2.2 SPIRE data reduction
The SPIRE data were processed with HIPE version 2 (Ott 2010) and updated calibration products provided by the SPIRE team. Using custom routines, we removed jumps in the timeline caused by co-occurring glitches that affect all detectors of a single array simultaneously and by jumps in the thermistor voltages. We include the data at the end of each raster leg, during which the telescope turns around, in order to increase the coverage. For each scan, for each detector, we derived the median, baseline value of the measured flux at each end of the scan and subtract a linear baseline fitted to the two end points from the scans. Images at 250, 350 and 500 m were constructed using the same reference point near the map center and are shown in Fig. 1. In order to remove any instrumental residuals in the SPIRE images, we use regions at the ends of the map, assume they should have zero emission and subtract a linear gradient from the images. This process was done in a consistent way for all ancillary data (MIPS, IRAC images and HI 21 cm emission images) so that comparisons between the data sets during the analysis are done in a consistent fashion.
As recommended by the SPIRE ICC we multiplied the maps by the flux calibration correction factors 1.02, 1.05, 0.94 for 250, 350 and 500 m, respectively. The uncertainty in the final absolute point source flux calibration is 15% (Swinyard et al. 2010). The final SPIRE maps were converted from Jy per beam to MJy/sr using the effective beam areas of 9.28, 1.74, and 3.57 sr for 250, 350 and 500 m. The positions of point sources in the 250 m map were compared with their positions at 24 m from MIPS revealing offsets up to 10″, similar to PACS. We corrected this problem with a small spherical rotation of the map, although some small residual astrometry errors remained, particularly far from the map centers.
3 Spectral energy distribution of the strip
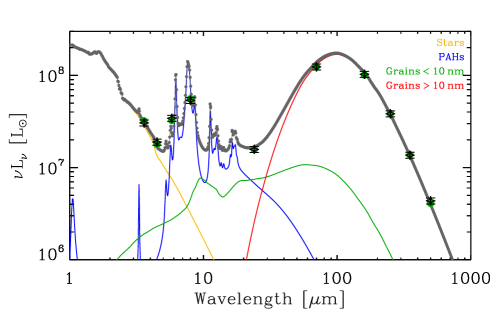
The SED of the whole strip (Fig. 2) is fit with a comprehensive dust radiation model described in detail by Galametz et al. (2009). We adopt the Dale & Helou (2002; Eq. 1) prescription, relating the dust mass to the integrated energy density to which it is exposed in units of the solar neighborhood intensity (; Mathis et al. 1983). The standard model (model 1) we apply on the strip uses the Galactic ISM dust size distribution and composition of graphite and silicate grains from Zubko et al. (2004; BARE-GR-S model) who successfully fit the Galactic ISM dust emission out to submillimeter wavelengths. The dust emissivity index at the longest wavelengths is , which is also the assumed emissivity value for the SAGE-LMC ISM study by Bernard et al. (2008). However, as will be shown in Sect. 4, the grains of this model do not have enough emissivity in the submillimeter regime to fit the SPIRE fluxes, with a gas-to-dust mass ratio (GDR) consistent with the elemental abundances of the LMC. As a consequence, we also created another model (model 2) replacing the graphites (of model 1) by amorphous carbons from Rouleau & Martin (1991; AC1). This modified model has more emissivity at long wavelengths and therefore gives a realistic GDR. For both models, the PAH-to-dust mass fraction, is reported in units of the Galactic PAH fraction of (Draine & Li 2007); i.e. means Galactic PAH abundance.
Both dust models provide an adequate fit to the SED of the strip. For model 1, the PAH-to-dust mass fraction is slightly lower than the Galactic mass fraction (), and its mass average stellar light intensity is twice the solar neighborhood intensity (). Although H ii regions can show much hotter dust (Hony et al. 2010), it does not dominate the emission. We had to decrease the mass fraction of small grains ( nm) by a factor of 2, in order to fit the m flux of the diffuse ISM. This has no significant effect on the total dust mass. Model 2 gives a lower PAH mass fraction () and higher starlight intensity (). Notably, the m flux is in excess compared to our SED model of the whole strip by 17% (model 1) and 6% (model 2). The origin of this excess is still unknown; however, such submillimeter excesses have been observed before in other magellanic irregular galaxies by e.g. Galliano et al. (2005). The spatial distribution and potential location of this m flux excess is discussed in further details by Gordon et al. (2010).
4 Distributions of dust and gas in the strip
The emission at these Herschel wavelengths (Fig. 1) is dominated by dust emission from the ISM and similar to the Spitzer MIPS 160 m emission (see e.g. Bernard et al. 2008). In fact, the SPIRE maps have an identical appearance in the overall strip which is expected because they trace the Rayleigh-Jeans tail of the ISM dust emission (Fig. 2). The three color image in Fig. 1 shows the variation in color temperature of this ISM dust emission. The SPIRE 350 m (red) samples all dust emission, including some of the coldest dust ( K), the MIPS 70 m (green) is near the SED peak, and the MIPS 24 m (blue) represents the hottest dust emission peaking in the H II regions.
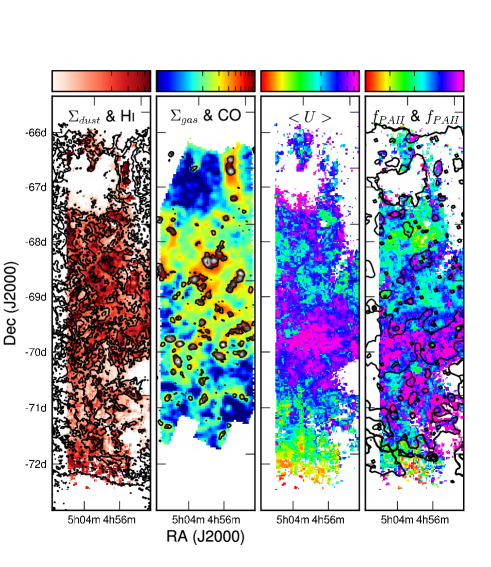
The modelling described in Sect. 3 has also been applied to each pixel of the strip (84″in angular size or 20 pc in linear size). The dust mass surface density, , average stellar light intensity, , and PAH-to-dust mass ratio, , derived from dust model 2 are shown in Fig. 3. The details of these models are described by Galliano et al. (in prep.). We also derive a gas mass surface density () image using the H I 21 cm emission from ATCA+Parkes by Kim et al. (2003), which traces the atomic neutral gas, and the CO J=1-0 emission from the NANTEN survey by Fukui et al. (2008), which traces the molecular gas. The HI (1′ resolution) and CO (2.6′ resolution) maps were convolved to the IRIS 100 m resolution (4.3′) using Gaussian kernels of widths 4.18′ and 3.42′ respectively. We used from Fukui et al. (2008) to derive the H2 mass from CO. We combine the H I and H2 column densities and adjust for the contribution of helium ( more) to create the total gas mass map in Fig. 3.
The dust mass distribution is spatially coincident with the SPIRE emission (Fig. 3) and is discussed in detail by Gordon et al. (2010). The H I 21 cm emission appears almost identical to the dust mass image (Fig. 3) and the similarity is quantified in more detail by Kim et al. (2010). The CO J= emission coincides with the peaks in the gas mass (Fig. 3) and two molecular clouds are discussed in more detail by Roman-Duval et al. (2010). The average starlight intensity heating the dust, , approximately follows the IRAC 3.6 m image (e.g. Meixner et al. 2006) being enhanced in the stellar bar, and in the giant HII region complexes, such as N44, which is just north of the stellar bar. The spatial distribution of derived by the model appears to be enhanced toward the stellar bar relative to the rest of the ISM (Fig. 3) in agreement with the findings of Paradis et al. (2009). We calculate that this enhancement is equivalent to (model 1) or (model 2) in PAH. However, it could be the result of the increased hardness of the starlight along the bar, mistaken for an increased abundance.
Over the area in common between the gas and dust mass images, we calculate the total gas mass and divide by the total dust mass to derive a GDR. For model 1, we calculate a . This value is less than the Galactic GDR value of 157 from Zubko et al. (2004) which would be unexpected given the LMC’s lower metallicity. In fact, the model 1 GDR is a factor of 3 lower than the SAGE-LMC ISM study by Bernard et al. (2008), who adopted similar Galactic dust properties. It is also too low by a factor of three compared to UV extinction measurements of Gordon et al. (2003). Thus, the addition of the SPIRE data demands too much dust, if we assume standard graphite and silicate optical properties which have been successfully used for Galactic dust models. For model 2, we calculate a , which is much more consistent with prior observations. Essentially the required dust mass for model 2 is smaller by a factor 3 because it requires a larger fraction of the dust to be illuminated by intenser radiation fields and therefore less dust mass to account for the observed SPIRE measurements. The fact that the pixel to pixel averaged intensity for model 2 is higher than for model 1 () makes model 2 more consistent with the expected intense radiation conditions within the LMC. The amorphous carbon emissivity is flatter in the submillimeter () which is in agreement with the independent approach taken by Gordon et al. (2010) for this data set and with the independent analysis of the TOPHAT and DIRBE measurements of the LMC by Aguirre et al. (2003).
Although our results indicate that the standard graphite and silicate optical properties for Galactic dust are not appropriate for the LMC dust, our suggested amorphous carbon and silicate dust model is not necessarily unique or the best model. The analysis of dust models begun in this paper will need to be revisited when the full HERITAGE data set is available. In particular a full exploration of parameter space for dust properties including composition and size distribution can be investigated in terms of ISM environment and metallicity.
Acknowledgements.
We acknowledge financial support from the NASA Herschel Science Center, JPL contracts # 1381522 & 1381650. M.R. is supported by FONDECYT No1080335 and FONDAP No15010003. We thank the contributions and support from the European Space Agency (ESA), the PACS and SPIRE teams, the Herschel Science Center and the NASA Herschel Science Center (esp. A. Barbar and K. Xu) and the PACS and SPIRE instrument control centers, without which none of this work would be possible.References
- Aguirre et al. (2003) Aguirre, J. E., et al. 2003, ApJ, 596, 273
- Bernard et al. (2008) Bernard, , J-P., Reach, W.T., Paradis, D. et al. 2008, AJ, 136, 919
- Boyer et al. (2010) Boyer, M., van Loon, J. Th., Sargent, B. et al. 2010, this volume.
- Dale & Helou (2002) Dale, D. A., & Helou, G. 2002, ApJ, 576, 159
- Draine & Li (2007) Draine, B. T., & Li, A. 2007, ApJ, 657, 810
- Dufour et al. (1982) Dufour, R. J., Shields, G. A., & Talbot, R. J., Jr. 1982, ApJ, 252, 461
- Fukui et al. (2008) Fukui, Y., Kawamura, A., Minamidani, T. et al. 2008, ApJS, 178, 56
- Galametz et al. (2009) Galametz, M., Madden, S., Galliano, F. et al. 2009, A&A, 508, 645
- Galliano et al. (2005) Galliano, F., Madden, S. C., Jones, A. P., Wilson, C. D., & Bernard, J.-P. 2005, A&A, 434, 867
- Gordon et al. (2003) Gordon, K. D., Clayton, G. C., Misselt, K. A., Landolt, A. U., & Wolff, M. J. 2003, ApJ, 594, 279
- Gordon et al. (2010) Gordon, K., Galliano, F., Hony, S. et al. 2010, this volume.
- Griffin et al. (2010) Griffin, M. et al. 2010, this volume
- Hony et al. (2010) Hony, S., Galliano, F., Madden, S.C. et al. 2010, this volume.
- Kim et al. (2003) Kim, S., Staveley-Smith, L., Dopita, M. A., et al. 2003, ApJS, 148, 473
- Kim et al. (2010) Kim, S., Kwon, E., Madden, S. et al. 2010, this volume.
- Lupton et al. (1999) Lupton, R. H., Gunn, J. E., & Szalay, A. S. 1999, AJ, 118, 1406
- Mathis et al. (1983) Mathis, J. S., Mezger, P. G., & Panagia, N. 1983, A&A, 128, 212
- Meixner et al. (2006) Meixner, M., Gordon, K., Indebetouw, R. et al. 2006, AJ, 132, 2268
- Paradis et al. (2009) Paradis, D., Reach, W.T., Bernard, J-P et al. 2009, AJ, 138, 196
- Pilbratt et al. (2010) Pilbratt, G. et al. 2010, this volume
- Poglitsch et al. (2010) Poglitsch, A. et al. 2010, this volume
- Otsuka et al. (2010) Otsuka, M., van Loon, J.Th., Long, K. et al. 2010, this volume
- Ott (2010) Ott, S. 2010, in ASP Conference Series, Astronomical Data Analysis Software and Systems XIX, Y. Mizumoto, K.-I. Morita, and M. Ohishi, eds., in press
- Roman-Duval et al. (2010) Roman-Duval, J., Israel, F., Bolatto, A. et al. 2010, this volume.
- Rouleau & Martin (1991) Rouleau, F. & Martin, P. G. 1991, ApJ, 377, 526
- Sewiło et al. (2010) Sewiło, M., Indebetouw, R., Carlson, L. et al. 2010, this volume
- Schaefer (2008) Schaefer, B. E. 2008, AJ, 135, 112
- Swinyard et al. (2010) Swinyard, B. M., Ade, P., Baluteau, J-P. et al. 2010, this volume
- Szewczyk et al. (2009) Szewczyk, O., Pietrzyński, G., Gieren, W., et al. 2009, AJ, 138, 1661
- Zubko et al. (2004) Zubko, V., Dwek, E., & Arendt, R. G. 2004, ApJS, 152, 211