Real space investigation of structural changes at the metal-insulator transition in VO2
Abstract
Synchrotron X-ray total scattering studies of structural changes in rutile VO2 at the metal-insulator transition temperature of 340 K reveal that monoclinic and tetragonal phases of VO2 coexist in equilibrium, as expected for a first-order phase transition. No evidence for any distinct intermediate phase is seen. Unbiased local structure studies of the changes in V–V distances through the phase transition, using reverse Monte Carlo methods, support the idea of phase coexistence and point to the high degree of correlation in the dimerized low-temperature structure. No evidence for short range V–V correlations that would be suggestive of local dimers is found in the metallic phase.
pacs:
71.30.+h 61.50.Ks 61.05.cfVO2 undergoes a transition from a metal to a non-magnetic insulator upon cooling below 340 K.Morin (1959) Accompanying this transition is a structural change from the high temperature tetragonal phase to a low temperature monoclinic phase, where pairing and tilting of vanadium ions result in chains with alternating long and short V–V distances along the -axis (Fig. 1).Goodenough (1960); Berglund and Guggenheim (1969); Zylbersztejn and Mott (1975) The mechanism underpinning the insulating behaviour of the low temperature phase continues to attract widespread interest, and recent work suggests the simultaneous role of the V–V pairing and electron correlation to drive the system from a correlated metal to a slightly less correlated insulator.Imada et al. (1998); Tomczak et al. (2008); Holman et al. (2009) Diverse methods have been used to understand this transition, including recent probes of dynamics and techniques sensitive to spatial inhomogeneities.Cavalleri et al. (2005); Qazilbash et al. (2007); Shin et al. (1990); Baum et al. (2007) The phenomenon as it occurs in nanostructures is also receiving increasing attention.Corr et al. (2008); Sohn et al. (2009); Zhang et al. (2009)
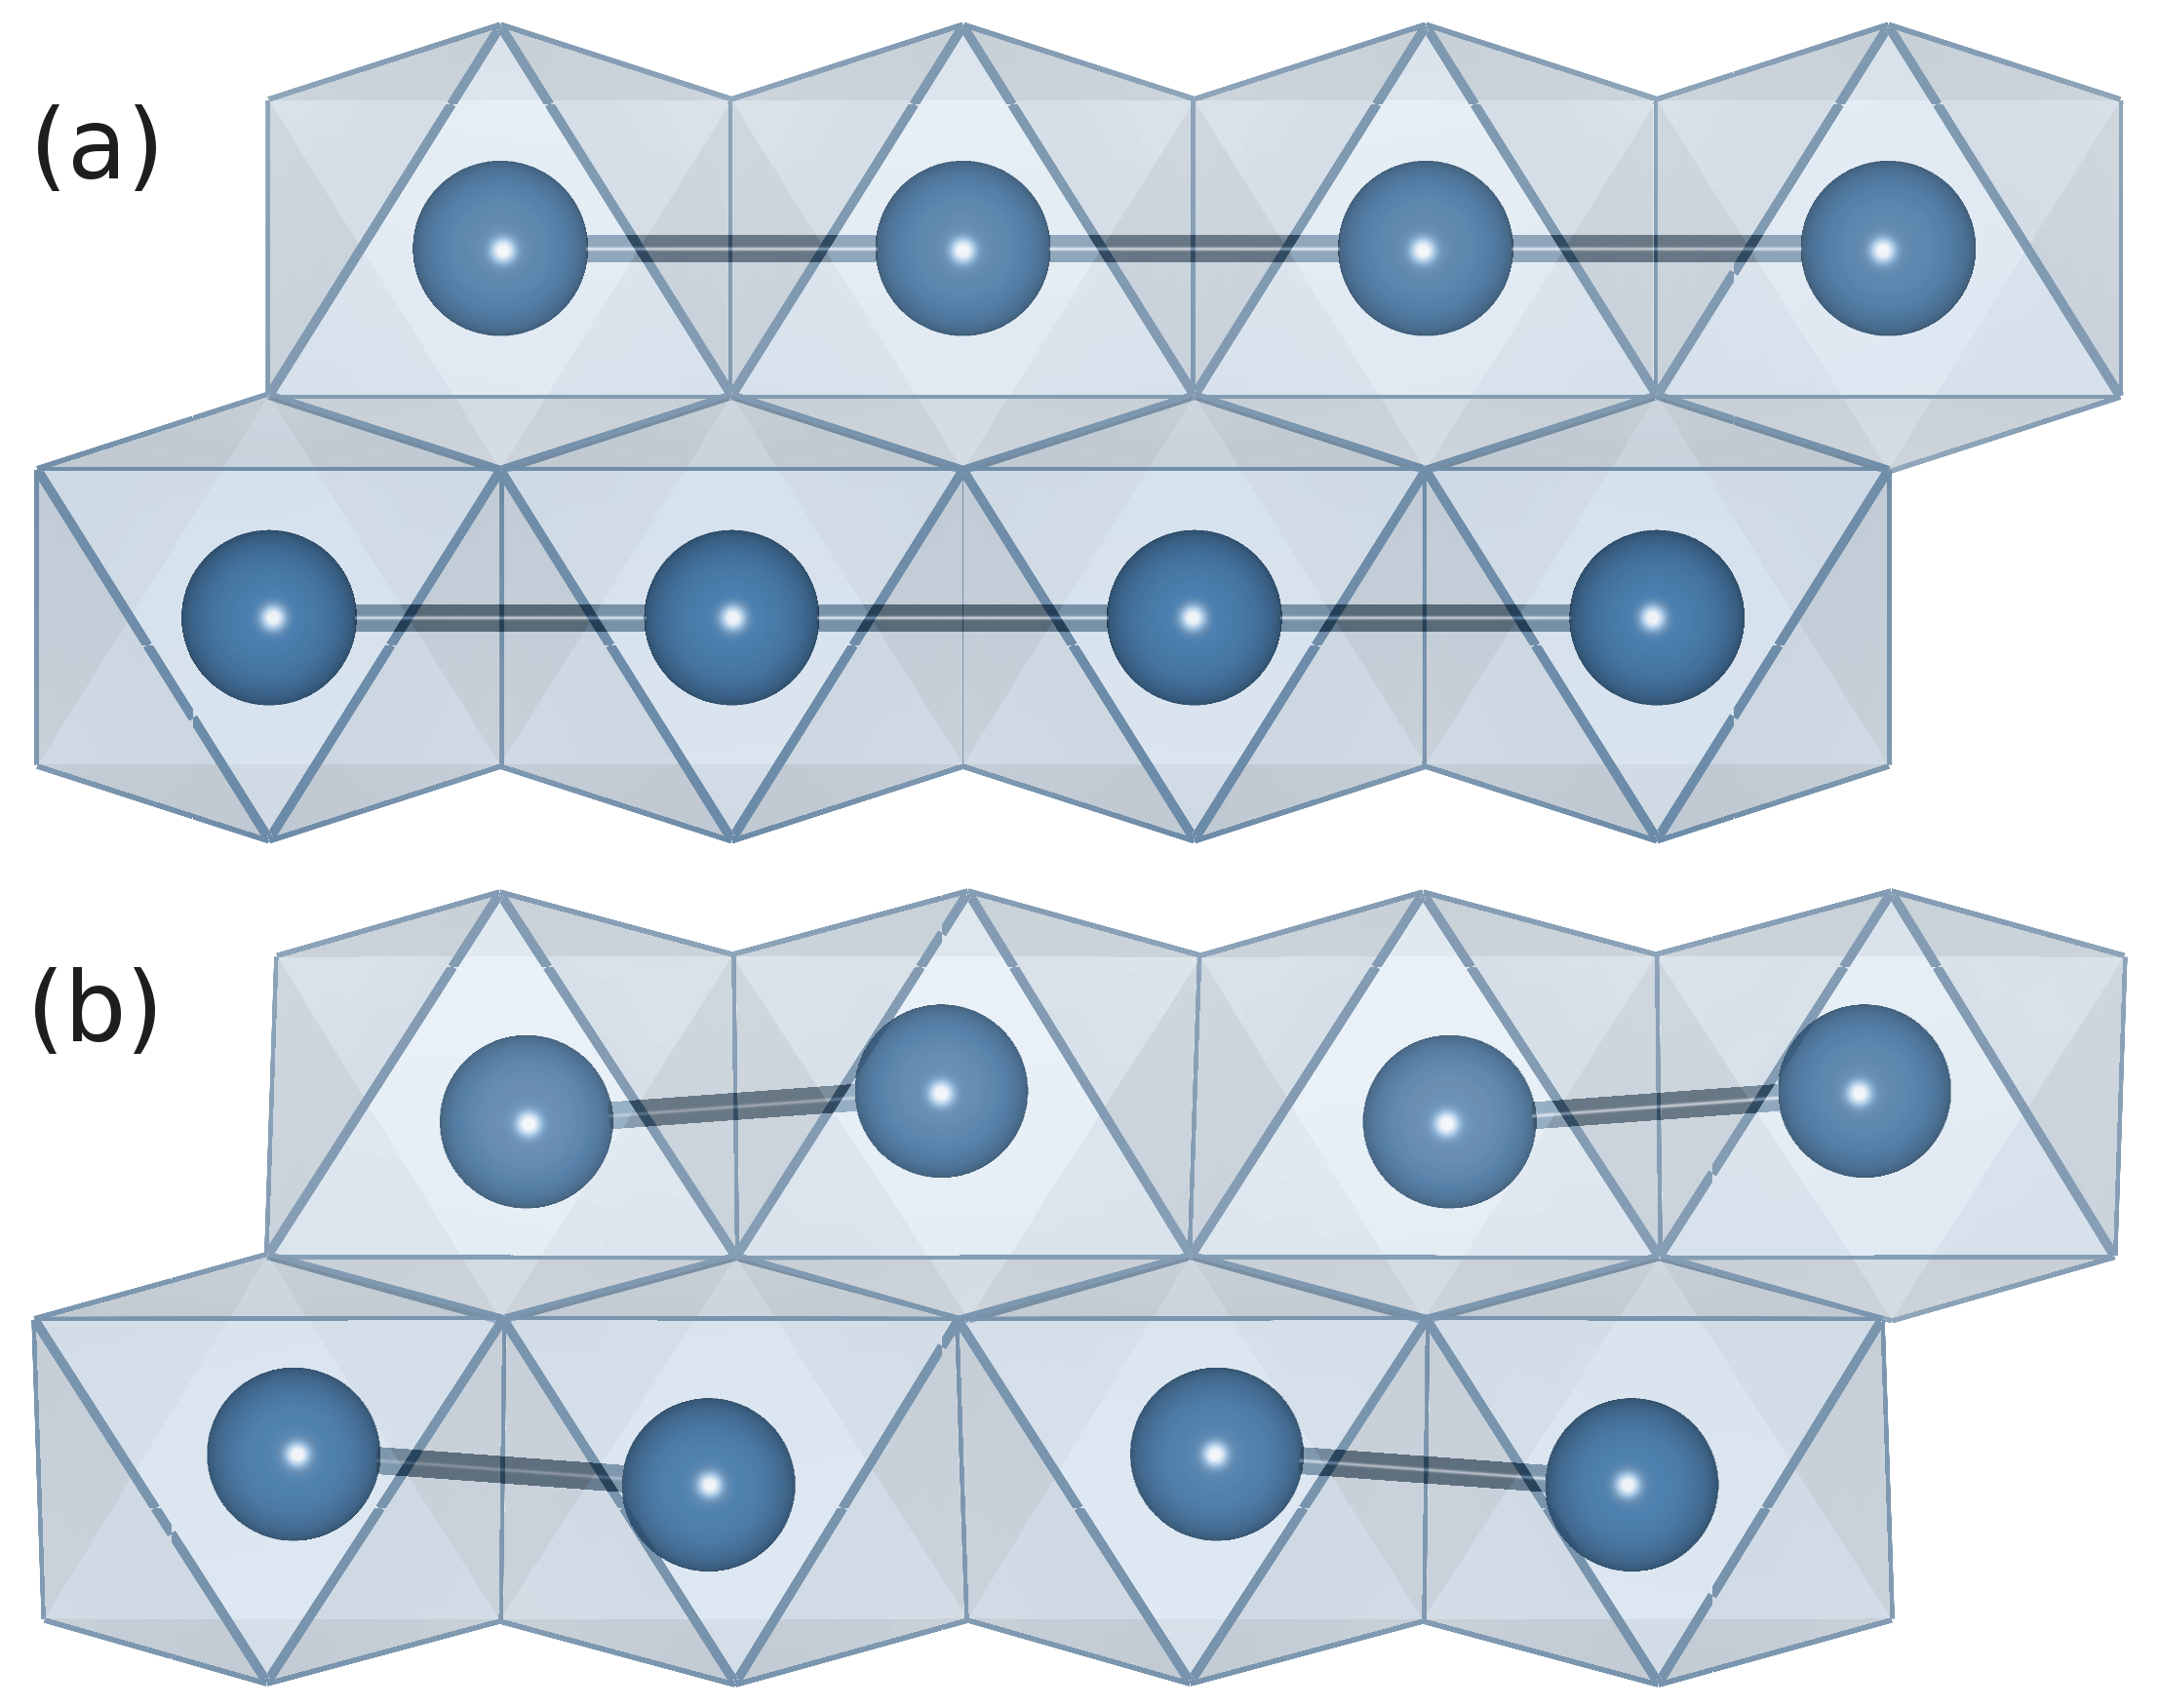
Above 340 K, the rutile VO2 structure in space group has a single near-neighbor V–V distance of 2.88 Å.McWhan et al. (1974); Poumellec et al. (1987) Below 340 K, the monoclinic structure in space group is characterized by V–V dimers along the -axis displaying two distinct V–V distances: 2.65 Å and 3.12 Å.Andersson (1956); Poumellec et al. (1987); Leroux et al. (1998) The structures are displayed in Fig. 1. Interestingly, several recent papers address the formation of domain-like regions in monoclinic VO2 on approaching the transition temperature from below.Choi et al. (1996); Kim et al. (2006); Qazilbash et al. (2007); Holman et al. (2009) An unresolved question regarding the nature of these domains is whether they are associated with an intermediate phase formed during the transition. A second question concerns the possible existence of dimers, albeit over short length scales, persisting in the metallic high temperature phase.
Here we employ synchrotron X-ray total scattering in conjunction with real-space analysis—using least-squares as well as reverse Monte Carlo methods—to show that the transition from the low-temperature monoclinic to the high temperature tetragonal phase in rutile VO2 occurs in a first-order manner, with coexistence of the low and high-temperature phases at the transition temperature. We employ pair distribution function (PDF) analysis, which has emerged in recent years as an indispensable tool for probing and understanding structural changes, and specifically, the range-dependence thereof.Qiu et al. (2005); Petkov (2008); Chupas et al. (2004); Page et al. (2008) The advantages of the PDF method lie in its ability to probe structural changes that lack long range correlations, which are not captured by Bragg peaks in X-ray or neutron scattering. By analyzing PDF data with large-box reverse Monte Carlo (RMC) simulations, we are able to produce a supercell where the local environment is free from symmetry constraints of the high or low temperature structures.Goodwin et al. (2007); Shoemaker et al. (2009, 2010) Atomic positions can therefore relax to best fit the experimental data, which includes both the Bragg and diffuse components. This approach provides an opportunity to observe any continuum of atomic positions which might exist across the metal-to-insulator transition in VO2.
Phase pure VO2 powders were prepared in evacuated and sealed silica ampoules from a stoichiometric mixture of V2O5 (99.9%, Alfa Aesar) and V2O3, the latter obtained by reduction of V2O5 in 5%-H2/N2 gas at 900∘C. Synchrotron total scattering data on powders in Kapton tubes were collected in transmission mode at beamline 11-ID-B of the Advanced Photon Source at Argonne National Laboratory by using X-rays with energies near 90 keV (wavelength = 0.13702 Å). Samples were heated and cooled continuously from 250 K to 400 K at a rate of 50 K h-1 using an Oxford Cryosystems Cryostream 700. Scattering data were collected on an image plate system with a sample-to-detector distance of 250 mm. Raw images were processed using fit2d.Hammersley (1997) PDFs were extracted as using pdfgetX2 with = 25 Å-1.Qiu et al. (2004) Least-squares profile refinements were carried out using pdfgui.Farrow et al. (2004) RMC simulations were performed using rmcprofileTucker et al. (2007) with a supercell, starting from atomic positions of the tetragonal structure. The simulations were constrained by the PDF (where above corresponds to as described by Keen Keen (2001)) up to = 25 Å. RMC results shown in this work are averages of many simulations to ensure an unbiased representation of the fit to data.
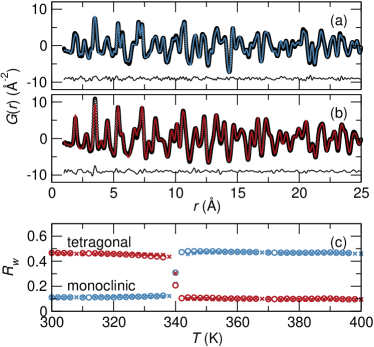
Least-squares refinements to all the PDFs at 2 K intervals were performed using both monoclinic and tetragonal structures [Fig. 2(a) and (b), respectively]. In the case of data fit to a monoclinic structure [Fig. 2(a)], we obtain a good fit from = 250 K to 338 K. The high temperature tetragonal structure [Fig. 2(b)], results in a good fit to the data from = 342 K to 400 K. The PDFs of the two structures are markedly different as seen in Fig. 2(a,b). There are no significant changes (other than lattice constants) in either end member until the transition is reached. The sudden structural transition at = 340 K is evident in plots of the goodness-of-fit parameters to the high and low temperature structures as seen in Fig. 2(c). In addition to locating the transition itself, the evolution in both temperature regimes suggest pure, single-phase polymorphs of the VO2 end members. There is no broad hysteresis in the transition because the measurement allows thermal equilibrium to be reached at each point. In addition, the sample is a bulk powder of large crystallites, which implies the possibility of many concurrent nucleation events.
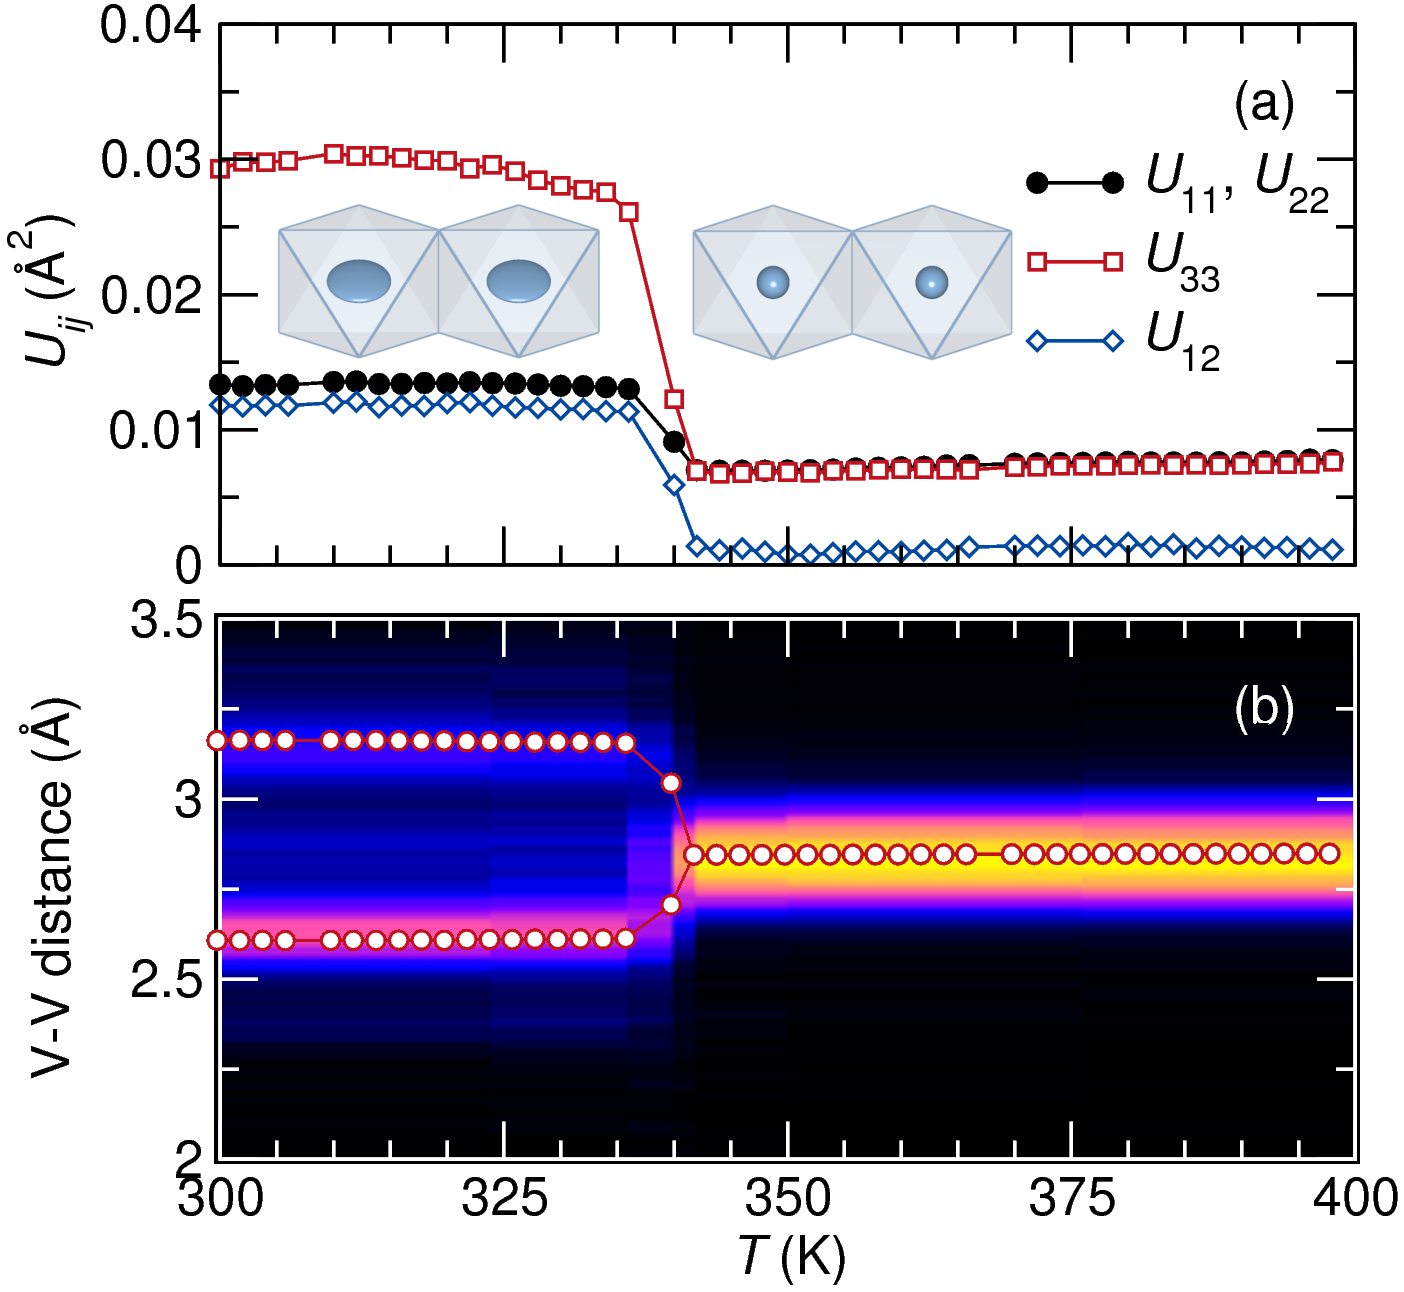
Dimerization of the V cations leads to splitting of the Wyckoff site in the tetragonal VO2 structure. If a dimerized structure is fit using the high-temperature model, the structural changes must be accommodated by an increase in the V atomic displacement parameters , which could convey information of the directionality of the displacement. Fig. 3(a) shows the least-squares refined values of the parameters of the tetragonal structure over the full temperature range. At all temperatures, by symmetry. Above the transition, is equal to , while (the only non-diagonal parameter allowed by symmetry) is negligible. The high-temperature V position is therefore spherical, and is shown on the right in Fig. 3(a). Below 340 K, dimerization along the direction leads to a large increase in . Tilting of V–V vectors off the axis (zero above the transition) produces an increase in . The corresponding growth and elongation of the V thermal ellipsoids are seen on the left in Fig. 3(a).
The split V positions and corresponding dimerized V–V distances are the hallmark of cooling through the transition, and we use the PDF to extract the distances directly. If there were a gradual shift in V–V distances over the extent of a wide transition region, which other probes such as the electrical resistivity suggest, the local structure information in the PDF would reproduce these distances regardless of whether or not they are correlated over long ranges. Least-squares refinements of the V–V distances (using the appropriate monoclinic or tetragonal model for each structure) are displayed as points in Fig. 3(b) and show an abrupt change upon cooling through the transition. The distances at 336 K and 342 K are effectively unchanged from the low- and high-temperature structures at 300 K and 400 K respectively, so the structural transition occurs within this range ( K). The least-squares refinements, however, are predicated on the choice of a monoclinic or tetragonal unit cell.
Histograms of V–V distances from RMC supercells (not constrained by symmetry) are displayed as an intensity map in Fig. 3(b). They display excellent agreement with the least-squares refined values for all points except = 340 K, implying that the single-phase least-squares refinements accurately reproduce the true distribution of V–V distances in the end members. However, at = 340 K the least-squares refined distances are of intermediate length, while the RMC V–V histogram is unclear. Is there an intermediate phase with V–V distances that are distinct from the monoclinic and tetragonal structures, or is there a mixture of two phases? Our subsequent analysis of the linear combination of experimental PDFs, along with V positions from RMC simulations, can resolve this issue.
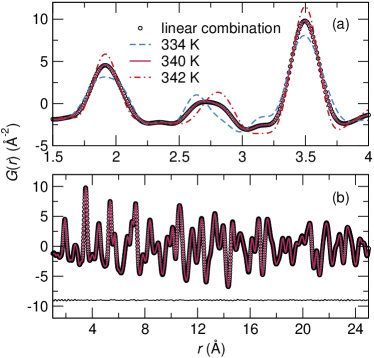
In Fig. 4(a), experimental PDFs are displayed for = 334 K, 340 K, and 342 K: below, during, and above the structural transition temperature. The = 334 K and 342 K PDFs can be refined to the end member structures, so a linear combination of these two PDFs produces a two-phase PDF containing three V–V distances: two monoclinic and one tetragonal. This linear combination PDF is displayed as the points behind the = 340 K data, and tracks the data up to 25 Å. The difference curve between the combination PDF and the = 340 K data is shown in Fig. 4(b), showing that the two PDFs are identical within the limits of experimental noise. The agreement implies that, even on a local scale, the VO2 sample at 340 K comprises two structurally distinct regions, corresponding directly to the tetragonal or the monoclinic structures. No additional contribution to the PDF is found.
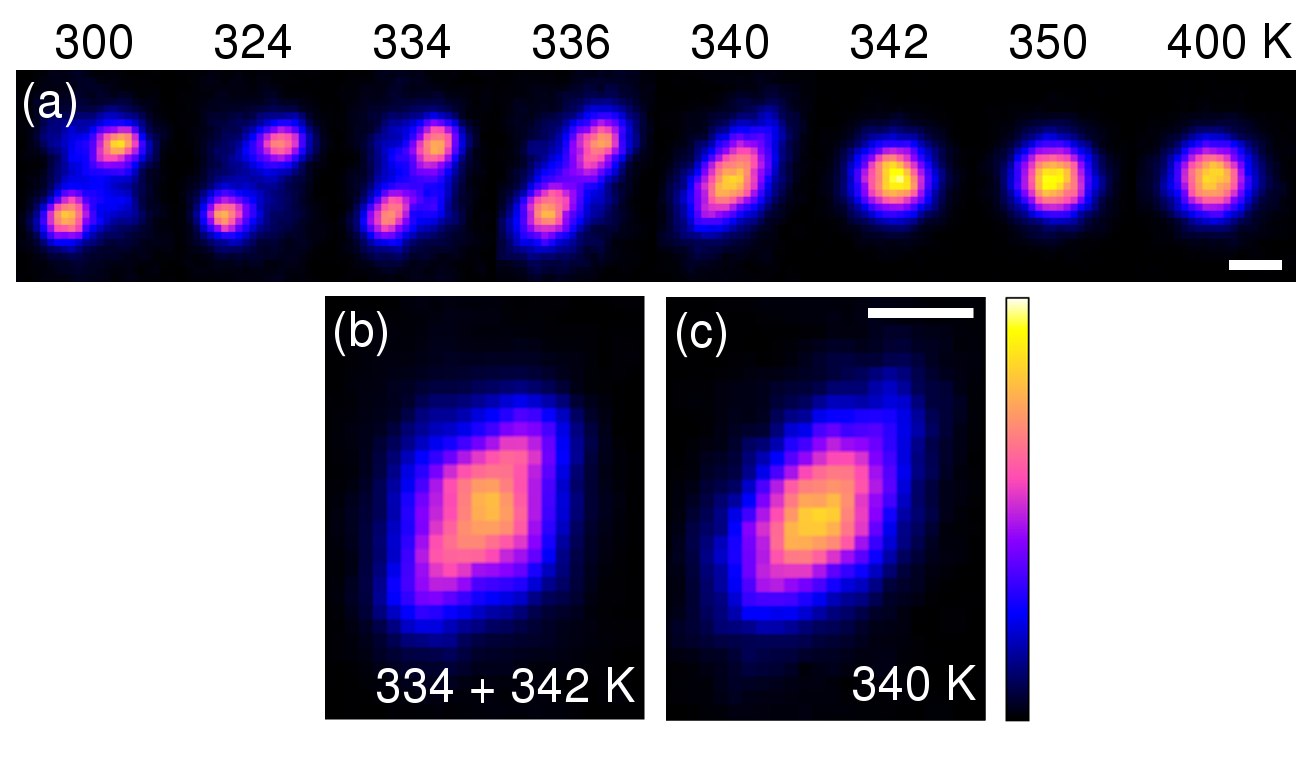
Corroborating evidence for the two-phase combination is seen in RMC simulations. We examine the distribution of V positions around the ideal crystallographic site in real space by folding the positions of all V in the RMC supercell back into a single unit cell, which produces a cloud of 1600 V positions (from a supercell) on each site. This cloud is viewed as a two-dimensional histogram showing the most probable positions of V cations in the plane in Fig. 5. For each cloud with 340 K, V distributions are spherical (as seen in the ellipsoids in Fig. 3(a)) and centered on the ideal tetragonal positions. For 340 K, dramatic splitting of the V position is seen. These two spots correspond to the end member monoclinic positions. We see no evolution of V clouds versus temperature far from the transition, but the 340 K cloud possesses an intermediate shape, distinct from the two regimes on either side. Just as was performed for the experimental PDFs themselves, we can linearly combine RMC results to produce models of a 1:1 mixture of the two phases. In Fig. 5(b), an average of the clouds from 334 K and 342 K is displayed, as a model of coexistence of the end members. The experimental cloud from = 340 K is reproduced in Fig. 5(c), and their similar appearance indicates that this is a two-phase mixture, in agreement with the linear combinations of the PDF in Fig. 4.
Qazilbash et al.Qazilbash et al. (2007) have recently suggested the formation of “metallic nanopuddles” at the transition temperature, and Cava and coworkersHolman et al. (2009) have suggested the importance of metal-metal dimers in a series of substituted VO2 ( = Nb, Mo) samples. What has not been clear up to now is whether these implied a third, intermediate phase of VO2. Here, we have shown that at the transition temperature there are only two distinct phase populations: low temperature monoclinic VO2 together with the high temperature tetragonal phase. Above the transition, there is no evidence for the presence of V–V dimers.
It is a pleasure to acknowledge R. J. Cava for suggestions and encouragement, and P. J. Chupas and K. W. Chapman for assistance with data collection at APS beamline 11-ID-B, supported by the DOE Office of Basic Energy Sciences under contract W-31-109-Eng.-38. SAC acknowledges research support from the University of Kent. We received support from the LANL-UCSB Institute for Multiscale Materials Studies and the NSF through a Career Award (DMR 0449354) to RS and MRSEC facilities (DMR 0520415). RMC simulations were performed using computational resources of the California NanoSystems Institute, supported in part by Hewlett-Packard.
References
- Morin (1959) F. J. Morin, Phys. Rev. Lett. 3, 34 (1959).
- Goodenough (1960) J. B. Goodenough, Phys. Rev. 117, 1442 (1960).
- Berglund and Guggenheim (1969) C. N. Berglund and H. J. Guggenheim, Phys. Rev. 185, 1022 (1969).
- Zylbersztejn and Mott (1975) A. Zylbersztejn and N. F. Mott, Phys. Rev. B 11, 4383 (1975).
- Imada et al. (1998) M. Imada, A. Fujimori, and Y. Tokura, Rev. Mod. Phys. 70, 1039 (1998).
- Tomczak et al. (2008) J. M. Tomczak, F. Aryasetiawan, and S. Biermann, Phys. Rev. B 78, 115103 (2008).
- Holman et al. (2009) K. L. Holman, T. M. McQueen, A. J. Williams, T. Klimczuk, P. W. Stephens, H. W. Zandbergen, Q. Xu, F. Ronning, and R. J. Cava, Phys. Rev. B 79, 245114 (2009).
- Cavalleri et al. (2005) A. Cavalleri, M. Rini, H. H. W. Chong, S. Fourmaux, T. E. Glover, P. A. Heimann, J. C. Kieffer, and R. W. Schoenlein, Phys. Rev. Lett. 95, 067405 (2005).
- Qazilbash et al. (2007) M. M. Qazilbash, M. Brehm, B.-G. Chae, P.-C. Ho, G. O. Andreev, B.-J. Kim, S. J. Yun, A. V. Balatsky, M. B. Maple, F. Keilmann, et al., Science 318, 1750 (2007).
- Shin et al. (1990) S. Shin, S. Suga, M. Taniguchi, M. Fujisawa, H. Kanzaki, A. Fujimori, H. Daimon, Y. Ueda, K. Kosuge, and S. Kachi, Phys. Rev. B 41, 4993 (1990).
- Baum et al. (2007) P. Baum, D.-S. Yang, and A. H. Zewail, Science 318, 788 (2007).
- Corr et al. (2008) S. A. Corr, M. Grossman, J. D. Furman, B. C. Melot, A. K. Cheetham, K. R. Heier, and R. Seshadri, Chem. Mater. 20, 6396 (2008).
- Sohn et al. (2009) J. I. Sohn, H. J. Joo, D. Ahn, H. H. Lee, A. E. Porter, K. Kim, D. J. Kang, and M. E. Welland, Nano. Lett. 9, 3392 (2009).
- Zhang et al. (2009) S. Zhang, J. Y. Chou, and L. J. Lauhon, Nano. Lett. 9, 4527 (2009).
- McWhan et al. (1974) D. B. McWhan, M. Marezio, J. P. Remeika, and P. D. Dernier, Phys. Rev. B 10, 490 (1974).
- Poumellec et al. (1987) B. Poumellec, J. F. Marucco, and B. Touzelin, Phys. Rev. B 35, 2284 (1987).
- Andersson (1956) G. Andersson, Acta. Chem. Scand. 10, 623 (1956).
- Leroux et al. (1998) C. Leroux, G. Nihoul, and G. Van Tendeloo, Phys. Rev. B 57, 5111 (1998).
- Choi et al. (1996) H. S. Choi, J. S. Ahn, J. H. Jung, T. W. Noh, and D. H. Kim, Phys. Rev. B 54, 4621 (1996).
- Kim et al. (2006) H.-T. Kim, Y. W. Lee, B.-J. Kim, B.-G. Chae, S. J. Yun, K.-Y. Kang, K.-J. Han, K.-J. Yee, and Y.-S. Lim, Phys. Rev. Lett. 97, 266401 (2006).
- Qiu et al. (2005) X. Qiu, T. Proffen, J. F. Mitchell, and S. J. L. Billinge, Phys. Rev. Lett. 94, 177203 (2005).
- Petkov (2008) V. Petkov, Materials Today 11, 28 (2008).
- Chupas et al. (2004) P. J. Chupas, S. Chaudhuri, J. C. Hanson, X. Qiu, P. L. Lee, S. D. Shastri, S. J. L. Billinge, and C. P. Grey, J. Am. Chem. Soc. 126, 4756 (2004).
- Page et al. (2008) K. Page, T. Kolodiazhnyi, T. Proffen, A. K. Cheetham, and R. Seshadri, Phys. Rev. Lett. 101, 205502 (2008).
- Goodwin et al. (2007) A. L. Goodwin, S. A. T. Redfern, M. T. Dove, D. A. Keen, and M. G. Tucker, Physical Review B 76, 174114 (2007).
- Shoemaker et al. (2009) D. P. Shoemaker, J. Li, and R. Seshadri, J. Am. Chem. Soc. 131, 11450 (2009).
- Shoemaker et al. (2010) D. P. Shoemaker, R. Seshadri, A. L. Hector, A. Llobet, T. Proffen, and C. J. Fennie, Phys. Rev. B 81, 144113 (2010).
- Hammersley (1997) A. P. Hammersley, Tech. Rep., European Synchrotron Radiation Facility (1997).
- Qiu et al. (2004) X. Qiu, J. W. Thompson, and S. J. L. Billinge, J. Appl. Cryst. 37, 678 (2004).
- Farrow et al. (2004) C. L. Farrow, P. Juhás, J. W. Liu, D. Bryndin, E. S. Boz̆in, J. Bloch, T. Proffen, and S. J. L. Billinge, J. Appl. Cryst. 37, 678 (2004).
- Tucker et al. (2007) M. G. Tucker, D. A. Keen, M. T. Dove, A. L. Goodwin, and Q. Hui, J. Phys. Cond. Mater 19, 335218 (2007).
- Keen (2001) D. A. Keen, J. Appl. Cryst. 34, 172 (2001).