Distribution of satellite galaxies in high redshift groups
Abstract
We use galaxy groups at redshifts between 0.4 and 1.0 selected from the Great Observatories Origins Deep Survey (GOODS) to study the color-morphological properties of satellite galaxies, and investigate possible alignment between the distribution of the satellites and the orientation of their central galaxy. We confirm the bimodal color and morphological type distribution for satellite galaxies at this redshift range: the red and blue classes corresponds to the early and late morphological types respectively, and the early-type satellites are on average brighter than the late-type ones. Furthermore, there is a morphological conformity between the central and satellite galaxies: the fraction of early-type satellites in groups with an early-type central is higher than those with a late-type central galaxy. This effect is stronger at smaller separations from the central galaxy. We find a marginally significant signal of alignment between the major axis of the early-type central galaxy and its satellite system, while for the late-type centrals no significant alignment signal is found. We discuss the alignment signal in the context of shape evolution of groups.
Subject headings:
dark matter – galaxies:halos – galaxies:structure – large-scale structure of universe – methods : statistical1. Introduction
In a cold dark-matter dominated universe, galaxies form within dark matter halos, and smaller halos form first, subsequently these may grow larger by accreting material and/or by merging with other halos. As a result, satellite galaxies are distributed within the dark matter halo of galaxy groups. Under the assumption that there is an unbiased distribution between the satellites and dark matter halo, the position of satellites can be used to determine the shape of the dark matter halo (Carter & Metcalfe, 1980; Plionis et al., 1991; Fasano et al., 1993; Basilakos et al., 2000; Orlov et al., 2001; Plionis et al., 2004, 2006; Wang et al., 2008), and their kinematics could be used to estimate the halo mass (Zaritsky et al., 1993, 1997; McKay et al., 2002; Brainerd & Specian, 2003; Katgert et al., 2004; van den Bosch et al., 2004; More et al., 2009). Or, if a spatial bias between the distribution of satellites and the underlying dark matter distribution is found, it would be a very important clue for us in the study of galaxy formation theory. The orientation of the satellites may also provide useful information on its formation and evolution process. High-resolution simulations have shown that subhalos tend to align with the major axis of their host halos (Knebe et al., 2004, 2008a, 2008b; Libeskind et al., 2005; Wang et al., 2005; Zentner et al., 2005; Agustsson & Brainerd, 2006; Kang et al., 2007; Faltenbacher et al., 2008; Knebe et al., 2010). Such effects could be examined with observations of satellites at different redshifts, to give a more comprehensive test of the theoretical model.
The morphology and color of the satellites are directly related to formation history of the host group. It has long been known that galaxies exhibit a bimodality in color and morphology: morphologically early-type galaxies which are typically red and have little or no ongoing star formation, and morphologically late-type galaxies, typically blue with active star formation. It is well known that galaxy morphology depends on local density environment. Hubble & Humason (1931) found a larger population of ellipticals and lenticulars in galaxy clusters, and subsequent studies revealed the connection between galaxy morphology and environment in low redshift clusters of galaxies (Oemler, 1974; Weinmann et al., 2006; Park & Hwang, 2009), nearby galaxy pairs (Park et al., 2007, 2008), isolated galaxy-scale satellite systems (Ann et al., 2008), and galaxy pairs at high redshifts (Hwang & Park, 2009). The color bimodality is noted by numerous studies at both low redshifts (Strateva et al., 2001; Blanton et al., 2003; Baldry et al., 2004; Kauffmann et al., 2004) and at high redshifts of (Bell et al., 2004; Tanaka et al., 2005; Weiner et al., 2005; Conselice et al., 2007). However, investigation on the bimodality and morphology-radius relation for satellite galaxies in high redshift groups have so far been lacking, one of the aims of the present paper is to investigate these issues.
The alignment between satellite distribution and the orientation of the central galaxy has been studied extensively since the work of Holmberg (1969), who first found that satellites are located preferentially close to the minor axes of the central galaxy. Many subsequent works confirmed the presence of this “Holmberg effect” (Lynden-Bell, 1976, 1982; Majewski, 1994; Hartwick, 1996; Zaritsky et al., 1997; Hartwick, 2000; Kroupa et al., 2005; Koch & Grebel, 2006; McConnachie & Irwin, 2006; Metz et al., 2007), though not all reached the same conclusion (Hawley & Peebles, 1975; Sharp et al., 1979; MacGillivray et al., 1982). One common limitation of the early studies is that the sample used are relatively small. With the advent of the 2dF Galaxy Redshift Survey (2dFGRS) (Colless et al., 2001) and the Sloan Digital Sky Survey (SDSS) (York et al., 2000), much larger samples became available. Sales & Lambas (2004, 2009) found a tendency for the satellites to be located along the host major axes at the large-scale of for a set of 1489 host galaxies with 3079 satellites from the 2dFGRS. This result is in a good agreement with similar studies carried out on the SDSS data (Brainerd, 2005; Azzaro et al., 2007; Bailin et al., 2008; Agustsson & Brainerd, 2010). Yang et al. (2006) and Wang et al. (2008) found a strong dependence of the alignment signal on the color of the central and satellite galaxies using groups in the SDSS Data Release 2 (DR2) and Data Release 4 (DR4) respectively. These studies found that the alignment signal is strongest between red central galaxies (hereafter ‘centrals’) and red satellites, while the satellites of blue centrals were consistent with being distributed isotropically. The alignment strength is also a function of the group mass, with stronger alignment signal in more massive groups. Other forms of alignment have also been studied, and some significant signals are detected. These include the alignment between neighboring clusters (Binggeli, 1982; West, 1989; Plionis, 1994; Wang et al., 2009), between brightest cluster galaxies (BCGs) and their parent clusters (Carter & Metcalfe, 1980; Binggeli, 1982; Struble, 1990; Niederste-Ostholt et al., 2010), between the orientation of satellite galaxies and the orientation of the cluster (Dekel, 1985; Plionis et al., 2003), and between the orientation of satellite galaxies and the orientation of the BCG (Struble, 1990; Faltenbacher et al., 2007).
For obvious reasons, most studies on satellite distribution have been limited to low redshifts, typically . Recently, Donoso et al. (2006) analysed a sample of relatively high redshift () Luminous Red Galaxies (LRGs) extracted from the SDSS DR4 and their surrounding structures to explore the presence of alignment effects. They confirmed that such alignment effect was also present at . Okumura et al. (2009) investigated the correlation between the orientation of giant ellipticals by measuring the intrinsic ellipticity correlation function of 83,773 SDSS LRGs at redshifts 0.16-0.47 and also found a positive alignment between pairs of the LRGs up to Mpc scales.
Deep galaxy redshift surveys such as the Great Observatories Origins Deep Survey (GOODS) (Giavalisco, 2004) now enable us to study the satellite distribution at even higher redshifts. Another aim of our paper is to detect the alignment between the distribution of satellite galaxies and the orientation of their central galaxy at redshifts beyond the local universe by using GOODS data. We construct a group catalog using a Friends-of-Friends (FoF) method, then we study the alignment signals with this sample. Compared with the previous studies, the redshift range in our sample is , which includes many high redshift groups ().
This paper is organized as follows. We describe the observational data used for this study in section 2, and the FoF group-finding method in section 3. In section 4, we present the properties of satellites in groups. The method to quantify the alignment signal is presented in section 5, and the results given in section 6. Section 7 summarize our results and discuss various related issues.
2. Observational data set
2.1. galaxy sample
The galaxy sample used here is selected by Hwang & Park (2009). Here we give a brief description of the data sample, and we refer the reader to Hwang & Park for more details.
We used a spectroscopic sample of galaxies in GOODS. GOODS is a deep multiwavelength survey covering two carefully selected regions including the Hubble Deep Field North (HDF-N, hereafter GOODS-North) and the Chandra Deep Field South (CDF-S,hereafter GOODS-South). Total observing area is approximately 300 and each region was observed by NASA’s Great Observatories (HST, Spitzer and Chandra), ESA’s XMM-Newton, and several ground-based facilities. HST observations with Advanced Camera for Surveys (ACS) were conducted in four bands: (F435W, 7200s), (F606W, 5000s), (F775W, 5000s), and (F850LP, 10,660s). Among the sources in the ACS photometric catalog, Hwang & Park (2009) selected 4443 (2197 in GOODS-South, 2246 in GOODS-North) galaxies whose reliable redshifts are available. In our analysis, a volume-limited sample of 1332 galaxies with and is used. The rest-frame -band absolute magnitude of galaxies is computed based on the ACS photometry with Galactic reddening correction (Schlegel et al., 1998) and K-corrections (Blanton & Roweis, 2007). The evolution correction (an increase of per unit redshift) was also applied to the rest-frame (Faber et al., 2007).
2.2. Morphology Classification
Hwang & Park (2009) visually inspected the individual band images and color images of the galaxies in a volume-limited sample. The galaxy is divided into two morphological types: early types (E/S0) and late types (S/Irr). Early-type galaxies are those with little fluctuation in the surface brightness and color and possess good symmetry in morphology, while late-type galaxies show internal structures and/or variations in the color images.
3. Groups of Galaxies
A very important step in our investigation is to identify the galaxy groups. There are many different techniques to identify groups in the local and distant Universe (Yang et al., 2005; Koester et al., 2007; Li & Yee, 2008; Wen et al., 2009). All of these methods have their own advantages and disadvantages, which we do not discuss here. We use the FoF method to find the groups. The FoF algorithm adopted here is that of Eke (2004) and Knobel et al. (2009). There are three adjustable parameters in the FoF algorithm: the linking length , the maximum perpendicular linking length in physical coordinates and the ratio between the linking length along and perpendicular to the line of sight . If two galaxies and with comoving distances and satisfy the following two conditions, then they are assigned to the same group. The two conditions, respectively, are
| (1) |
and
| (2) |
where is the angular separation between galaxy and , and the two parameters and are the comoving linking lengths perpendicular and parallel to the line of sight defined by
| (3) | |||||
| (4) |
where is the maximum perpendicular linking length in physical coordinates and is the mean density of galaxies. Since we have a volume-limited sample of galaxies, it is easy to obtain the value . For the typical value of three free parameters , and , we adopted them as listed in Table 1 of Knobel et al. (2009).
Figure 1 shows a few groups found by the FoF method. The three parameters , and are set as , , and , respectively. In each group, the filled and open circles represent the central and satellite galaxies, respectively. The brightest galaxy in each group is defined as the central galaxy, and the rest are called its satellites. As shown in the top right panel of Figure 1, in some cases the “central galaxy” defined by this way is not actually located in the central region of groups. We call them the Deviation-Center-Group (DCG), and the other groups Located-Center-Group (LCG). The criterion for LCG is , where is the angular distance between the brightest galaxy and the geometrical center of the group, and is the angular size of the group. The half angular size of the group is defined as the angular separation between the geometrical center of the group and farthest member galaxy. In the determination of the alignment signal, only the LCGs are used. A total of 206 groups are found in our volume-limited sample.

In Figure 2, we show the redshift distribution of the groups in our sample. The distribution has a broad peak near .

4. Properties of satellites in groups
In Figure 3, we present the early-type fraction of satellites as a function of projected distance from the central galaxy in groups. The filled circles and crosses are for the early- and late-type galaxy cases, respectively. The error bars represent confidence intervals, which are determined with the bootstrap resampling method. It is seen that the early-type fraction of satellites increases as satellites approach their early-type central galaxy. Also, the early-type fraction of satellites in groups with early-type centrals is higher than those with late-type centrals, which indicates that the satellite galaxies tend to have morphology similar to their centrals. Similar results have been obtained for galaxies in groups and clusters by Weinmann et al. (2006), for galaxy pairs in general environment by Park et al. (2007, 2008) in low redshift samples, and by Capak et al. (2007) and Hwang & Park (2009) in high redshift samples. In the group with a late-type central galaxy, the early-type fraction of satellites is nearly constant as the distance from the central galaxy changes.

In Figure 4, we show the rest frame -band absolute magnitude of the early- (filled circle) and late-type (cross) satellites as a function of the projected distance from the central galaxy. Two solid lines represent the median values. The early-type satellites are on the average brighter than the late-type satellites.

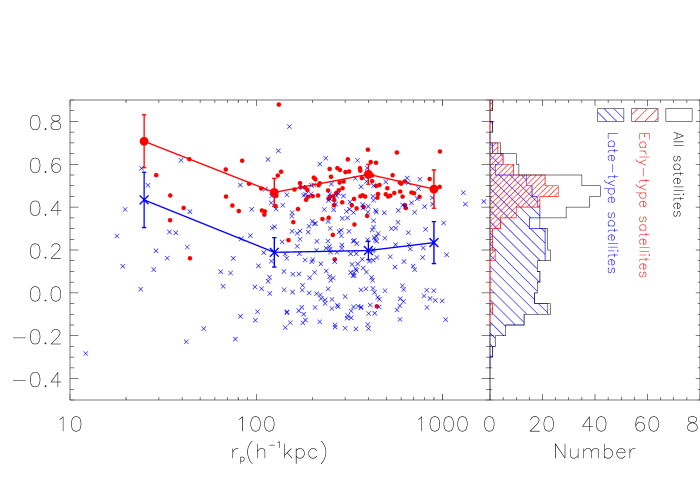
In the left panel of Figure 5, we present the color of the early- (filled circle) and late-type (cross) satellites as a function of the projected distance from the central galaxy. and of galaxies are K-corrected (to z=0) magnitudes (Blanton & Roweis, 2007). Two solid lines represent the median values. In the right panel of Figure 5, the distribution of color of satellites is shown. It can be clearly seen that the early- and late-type satellites occupy the red and blue bumps of the bimodal color distribution, respectively.
5. Quantifying the alignment
In order to quantify the alignments of objects, we follow the method in Brainerd (2005) and compute the distribution functions of the alignment angles, , where is the angle between the major axis of the central group galaxy and the direction of a satellite relative to the centrals. The angle is constrained in the range , where suggests that the satellite lies along the major (minor) axis of the central galaxy.
For a given set of the central and satellite galaxies, we first count the total number of central-satellite pairs, , for a number of bins in . Next, we construct 200 random samples in which we randomize the orientations of all centrals, and compute , the average number of central-satellite pairs as function of . The random samples constructed this way suffer exactly the same selection effects as the real sample, so any significant difference between and reflects a genuine alignment between the orientations of the centrals and the distributions of their corresponding satellite galaxies.
Following Yang et al. (2006) and Wang et al. (2008), we introduce the distribution of normalized pair counts:
| (5) |
In the absence of any alignment, , while at small implies a satellite is preferentially aligned along the major axis of their central galaxy.
We quantify the fluctuation using , where is the standard deviation of , and is estimated from the 200 random samples. In addition to this normalized pair count, we also compute the average angle . In the absence of any alignment . If one finds (), it means that the satellites are distributed along the major (minor) axis of the central galaxy.
6. Alignment Measurement
In order to study the alignment signal, the position angles of the central galaxies are required. We only use those groups with central galaxy axis ratio . For these galaxies, the isophotal position angle is well defined. Here and are the isophotal semi-major and minor axis lengths adopted from the -band measurements in the HST/ACS photometric catalog, respectively. Finally, we have 168 central-satellite pairs in the detection of the alignment signal.
Figure 6 shows for the selected central-satellite systems. There is a marginally significant signal of alignment between the orientation of the central galaxies and the distribution of the satellites. Satellite galaxies are distributed preferentially along the major axis of their central galaxy. This is also supported by the fact that , which deviates from the case of no alignment (i.e.) by . Moreover, a Kolmogorov-Smirnov (KS) test also suggests that an isotropic distribution of satellites in our sample is rejected with a confidence level higher than . If we remove groups with in our sample, then the alignment strength is changed from to .

In order to study how the alignment depends on the central galaxy properties, we divide our sample into early-type central and late-type central cases. Figure 7 shows the alignment signals for the sample with early- (left panel) and late-type (right panel) central galaxies. As can be seen, systems with an early-type central galaxy shows alignment signal. A KS test finds that the sample with early-type centrals is not isotropic with confidence level higher than . The distribution of has an interesting shape, being greater at both and than at . This could perhaps be explained by the effect of infall from perpendicular filaments on forming galaxies (Brook et al., 2008). Systems with a late-type central galaxy, however, show no significant alignment. Compared with the alignment signal detected by Yang et al. (2006)() and Wang et al. (2008)() in low redshift groups, there is no significant difference (the confidence level for this tiny difference is below ) between the alignment strength in high-z and local groups (for the total samples). In other words, no evolution of the alignment is seen within redshift [0,1].

7. Summary and Discussion
Using the FoF group finder, we create a high-redshift () group catalogue out of a spectroscopic sample of galaxies in the GOODS fields. We also identify the morphology of the satellite galaxies visually. The morphologically early- and late-type satellites occupy the red and blue bumps of the bimodal color distribution, respectively. We then study the early-type fraction, the magnitude-radius relation and the color-radius relations of the satellite galaxies in these groups. We find that the early-type fraction of satellites in early-host centrals is higher than those in late-type centrals. The early-type satellites are also on the average brighter than the late-type satellites.
We measured the alignment between the distribution of satellites and the orientation of their central galaxy. We find a marginally significant alignment signal for the whole sample and for the subsample with early-type centrals. However, we do not find any alignment signal for the subsample with late-type centrals.
It is known that the group catalog strongly depends on the three adjustable parameters , and in the FoF algorithm. In order to study how these parameters affect the measurement of the alignment signal, we have adopted five groups of parameter-sets as listed in Table 1 of Knobel et al. (2009) in identifying groups, and calculated alignment signals for each case. We find that the result of the alignment signal from the groups found by using the five different sets of group parameters are nearly the same. This indicates that our results on group central-satellites alignment is not sensitive to the choice of adjustable parameters in the FoF algorithm.
The measured alignment signal may be compared with numerical simulation results. Using N-body simulations, Jing & Suto (2002); Wang & Fan (2004) found that the non-sphericity of dark matter halos are greater at higher redshift, so we might expect a stronger alignment strength in the high-redshift groups. However, in our high redshift catalog we only find an alignment strength similar to the local groups.
There are several possibilities for this result. First, due to the limited number of pairs available, the sample variance is still large, and the detection is marginal. It is still difficult to draw conclusions from this observation. We have 168 central-satellite pairs in total and find a 1.6 alignment signal. To check how the strength of alignment signal depends on the sample size, we use the SDSS DR4 data adopted in Wang et al. (2008) to make a test. The total number of central-satellite pairs in Wang et al. (2008) is 62212, and the alignment signal is 21(). We randomly select 168, , central-satellite pairs from this large sample, the corresponding alignment signal is detected at , and , respectively. If the same scaling is applicable to the high redshif sample, we need to increase our sample size by at least fourfold to reach a significant detection of about .
Second, we have assumed that stronger non-sphericity produce stronger alignments. To certain extent this should be true, as there would be no alignment signal when the distribution is spherical. However, at different redshifts the relation between non-sphericity and alignment may be different. For the same non-sphericity, the alignment might be weaker at higher redshifts due to some reason (e.g., less time for dynamical adjustment), thus partly compensated for effects of the stronger non-sphericity.
Finally, the predictions by Jing & Suto (2002); Wang & Fan (2004) were based on N-body simulations. Inclusion of baryon cooling effect may affect the shape of the halo (Kazantzidis et al., 2004; Debattista et al., 2008), and change the conclusions on the shape evolution of dark matter halos.
We may also compare the observational results of alignment strength at different redshifts in the literature. For the group in the range (Wang et al., 2008), the misalignment angle between the major axis of the central galaxy and the projected major axis of the host halo follows a Gaussian distribution with zero mean and a dispersion of . Using a sample at , Okumura et al. (2009) discovered that the misalignment angle between the central LRGs and their host halo also follows a Gaussian distribution with a zero mean, but the dispersion angle is . If we extend this trend to samples at even higher redshifts, the misalignment angles should be larger. With such a trend, a weaker alignment signal is expected at higher redshifts.
In order to further improve our understanding of the spatial distribution of satellites in high redshift groups, we need a large sample. Some undergoing surveys, such as the Canada-France-Hawaii Telescope (CFHT) Legacy Survey, may extend the sample size significantly, and bring a definite answer to questions related to the distribution of satellites in the high redshift groups.
Acknowledgments
We sincerely thank the referee for the constructive and detailed comments and suggestions. This work has started during YGW’s visit to KIAS, and he would like to express his gratitude to KIAS. CBP acknowledges the support of the Korea Science and Engineering Foundation (KOSEF) through the Astrophysical Research Center for the Structure and Evolution of the Cosmos (ARCSEC). YGW acknowledge the support by the Young Researcher Grant of National Astronomical Observatories. XLC acknowledge the support by the NSFC Distinguished Young Scholar Grant No.10525314. YGW and XLC are also supported by the Ministry of Science and Technology under the 973 program (2007CB815401, 2010CB833004), and the CAS Knowledge Innovation Program (Grant No. KJCX3-SYW-N2).
References
- Agustsson & Brainerd (2006) Agustsson, I. & Brainerd, T. G. 2006, ApJ, 644, L25
- Agustsson & Brainerd (2010) Agustsson, I. & Brainerd, T. G. 2010, ApJ, 709, 1321
- Ann et al. (2008) Ann, H. B., Park, C., & Choi, Y. 2008, MNRAS, 389, 86
- Azzaro et al. (2007) Azzaro, M., Patiri, S. G., Prada, F., & Zentner, A. R. 2007, MNRAS, 376, L43
- Bailin et al. (2008) Bailin, J., Power, C., Norberg, P., Zaritsky, D., & Gibson, B. K. 2008, MNRAS, 390, 1133
- Baldry et al. (2004) Baldry, I. K., Glazebrook, K., Brinkmann, J., et al. 2004, ApJ, 600, 681
- Basilakos et al. (2000) Basilakos, S., Plionis, M., & Maddox, S. J. 2000, MNRAS, 316, 779
- Bell et al. (2004) Bell, E. F., Wolf, C., Meisenheimer, K., et al. 2004, ApJ, 608, 752
- Binggeli (1982) Binggeli, B. 1982, A&A, 107, 338
- Blanton et al. (2003) Blanton, M. R., Hogg, D. W., Bahcall, N. A., et al. 2003, ApJ, 594, 186
- Blanton & Roweis (2007) Blanton, M. R. & Roweis, S. 2007, AJ, 133, 734
- Brainerd (2005) Brainerd, T. G. 2005, ApJ, 628, L101
- Brainerd & Specian (2003) Brainerd, T. G. & Specian, M. A. 2003, ApJ, 593, L7
- Brook et al. (2008) Brook, C. B., Governato, F., Quinn, T., et al. 2008, ApJ, 689, 678
- Capak et al. (2007) Capak, P., Abraham, R. G., Ellis, R. S., et al. 2007, ApJS, 172, 284
- Carter & Metcalfe (1980) Carter, D. & Metcalfe, N. 1980, MNRAS, 191, 325
- Colless et al. (2001) Colless, M., Dalton, G., Maddox, S., et al. 2001, MNRAS, 328, 1039
- Conselice et al. (2007) Conselice, C. J., Bundy, K., Trujillo, I., et al. 2007, MNRAS, 381, 962
- Debattista et al. (2008) Debattista, V. P., Moore, B., Quinn, T., et al. 2008, ApJ, 681, 1076
- Dekel (1985) Dekel, A. 1985, ApJ, 298, 461
- Donoso et al. (2006) Donoso, E., O’Mill, A., & Lambas, D. G. 2006, MNRAS, 369, 479
- Eke (2004) Eke, V. R., e. a. 2004, MNRAS, 348, 866
- Faber et al. (2007) Faber, S. M., Willmer, C. N. A., Wolf, C., et al. 2007, ApJ, 665, 265
- Faltenbacher et al. (2008) Faltenbacher, A., Jing, Y. P., Li, C., et al. 2008, ApJ, 675, 146
- Faltenbacher et al. (2007) Faltenbacher, A., Li, C., Mao, S., et al. 2007, ApJ, 662, L71
- Fasano et al. (1993) Fasano, G., Pisani, A., Vio, R., & Girardi, M. 1993, ApJ, 416, 546
- Giavalisco (2004) Giavalisco, M., e. a. 2004, ApJ, 600, L93
- Hartwick (1996) Hartwick, F. D. A. 1996, in Astronomical Society of the Pacific Conference Series, Vol. 92, Formation of the Galactic Halo…Inside and Out, ed. H. L. Morrison & A. Sarajedini, 444–+
- Hartwick (2000) Hartwick, F. D. A. 2000, AJ, 119, 2248
- Hawley & Peebles (1975) Hawley, D. L. & Peebles, P. J. E. 1975, AJ, 80, 477
- Holmberg (1969) Holmberg, E. 1969, Ark.Astron, 5, 305
- Hubble & Humason (1931) Hubble, E. & Humason, M. L. 1931, ApJ, 74, 43
- Hwang & Park (2009) Hwang, H. S. & Park, C. 2009, ApJ, 700, 791
- Jing & Suto (2002) Jing, Y. P. & Suto, Y. 2002, ApJ, 574, 538
- Kang et al. (2007) Kang, X., van den Bosch, F. C., Yang, X., et al. 2007, MNRAS, 378, 1531
- Katgert et al. (2004) Katgert, P., Biviano, A., & Mazure, A. 2004, ApJ, 600, 657
- Kauffmann et al. (2004) Kauffmann, G., White, S. D. M., Heckman, T. M., et al. 2004, MNRAS, 353, 713
- Kazantzidis et al. (2004) Kazantzidis, S., Kravtsov, A. V., Zentner, A. R., et al. 2004, ApJ, 611, L73
- Knebe et al. (2008a) Knebe, A., Draganova, N., Power, C., et al. 2008a, MNRAS, 386, L52
- Knebe et al. (2004) Knebe, A., Gill, S. P. D., Gibson, B. K., et al. 2004, ApJ, 603, 7
- Knebe et al. (2010) Knebe, A., Libeskind, N. I., Knollmann, S. R., et al. 2010, ArXiv e-prints
- Knebe et al. (2008b) Knebe, A., Yahagi, H., Kase, H., Lewis, G., & Gibson, B. K. 2008b, MNRAS, 388, L34
- Knobel et al. (2009) Knobel, C., Lilly, S. J., Iovino, A., et al. 2009, ApJ, 697, 1842
- Koch & Grebel (2006) Koch, A. & Grebel, E. K. 2006, AJ, 131, 1405
- Koester et al. (2007) Koester, B. P., McKay, T. A., Annis, J., et al. 2007, ApJ, 660, 239
- Kroupa et al. (2005) Kroupa, P., Theis, C., & Boily, C. M. 2005, A&A, 431, 517
- Li & Yee (2008) Li, I. H. & Yee, H. K. C. 2008, AJ, 135, 809
- Libeskind et al. (2005) Libeskind, N. I., Frenk, C. S., Cole, S., et al. 2005, MNRAS, 363, 146
- Lynden-Bell (1976) Lynden-Bell, D. 1976, MNRAS, 174, 695
- Lynden-Bell (1982) Lynden-Bell, D. 1982, Observatory, 102, 202
- MacGillivray et al. (1982) MacGillivray, H. T., Dodd, R. J., McNally, B. V., & Corwin, Jr., H. G. 1982, MNRAS, 198, 605
- Majewski (1994) Majewski, S. R. 1994, ApJ, 431, L17
- McConnachie & Irwin (2006) McConnachie, A. W. & Irwin, M. J. 2006, MNRAS, 365, 902
- McKay et al. (2002) McKay, T. A., Sheldon, E. S., Johnston, D., et al. 2002, ApJ, 571, L85
- Metz et al. (2007) Metz, M., Kroupa, P., & Jerjen, H. 2007, MNRAS, 374, 1125
- More et al. (2009) More, S., van den Bosch, F. C., & Cacciato, M. 2009, MNRAS, 392, 917
- Niederste-Ostholt et al. (2010) Niederste-Ostholt, M., Strauss, M. A., Dong, F., Koester, B. P., & McKay, T. A. 2010, ArXiv e-prints
- Oemler (1974) Oemler, A. J. 1974, ApJ, 194, 1
- Okumura et al. (2009) Okumura, T., Jing, Y. P., & Li, C. 2009, ApJ, 694, 214
- Orlov et al. (2001) Orlov, V. V., Petrova, A. V., & Tarantaev, V. G. 2001, MNRAS, 325, 133
- Park et al. (2007) Park, C., Choi, Y., Vogeley, M. S., Gott, J. R. I., & Blanton, M. R. 2007, ApJ, 658, 898
- Park et al. (2008) Park, C., Gott, J. R. I., & Choi, Y. 2008, ApJ, 674, 784
- Park & Hwang (2009) Park, C. & Hwang, H. S. 2009, ApJ, 699, 1595
- Plionis (1994) Plionis, M. 1994, ApJS, 95, 401
- Plionis et al. (1991) Plionis, M., Barrow, J. D., & Frenk, C. S. 1991, MNRAS, 249, 662
- Plionis et al. (2006) Plionis, M., Basilakos, S., & Ragone-Figueroa, C. 2006, ApJ, 650, 770
- Plionis et al. (2004) Plionis, M., Basilakos, S., & Tovmassian, H. M. 2004, MNRAS, 352, 1323
- Plionis et al. (2003) Plionis, M., Benoist, C., Maurogordato, S., Ferrari, C., & Basilakos, S. 2003, ApJ, 594, 144
- Sales & Lambas (2004) Sales, L. & Lambas, D. G. 2004, MNRAS, 348, 1236
- Sales & Lambas (2009) Sales, L. & Lambas, D. G. 2009, MNRAS, 395, 1184
- Schlegel et al. (1998) Schlegel, D. J., Finkbeiner, D. P., & Davis, M. 1998, ApJ, 500, 525
- Sharp et al. (1979) Sharp, N. A., Lin, D. N. C., & White, S. D. M. 1979, MNRAS, 187, 287
- Strateva et al. (2001) Strateva, I., Ivezić, Ž., Knapp, G. R., et al. 2001, AJ, 122, 1861
- Struble (1990) Struble, M. F. 1990, AJ, 99, 743
- Tanaka et al. (2005) Tanaka, M., Kodama, T., Arimoto, N., et al. 2005, MNRAS, 362, 268
- van den Bosch et al. (2004) van den Bosch, F. C., Norberg, P., Mo, H. J., & Yang, X. 2004, MNRAS, 352, 1302
- Wang et al. (2005) Wang, H. Y., Jing, Y. P., Mao, S., & Kang, X. 2005, MNRAS, 364, 424
- Wang et al. (2009) Wang, Y., Park, C., Yang, X., Choi, Y.-Y., & Chen, X. 2009, ApJ, 703, 951
- Wang et al. (2008) Wang, Y., Yang, X., Mo, H. J., et al. 2008, MNRAS, 385, 1511
- Wang & Fan (2004) Wang, Y.-G. & Fan, Z.-H. 2004, ApJ, 617, 847
- Weiner et al. (2005) Weiner, B. J., Phillips, A. C., Faber, S. M., et al. 2005, ApJ, 620, 595
- Weinmann et al. (2006) Weinmann, S. M., van den Bosch, F. C., Yang, X., & Mo, H. J. 2006, MNRAS, 366, 2
- Wen et al. (2009) Wen, Z. L., Han, J. L., & Liu, F. S. 2009, ApJS, 183, 197
- West (1989) West, M. J. 1989, ApJ, 344, 535
- Yang et al. (2005) Yang, X., Mo, H. J., van den Bosch, F. C., & Jing, Y. P. 2005, MNRAS, 356, 1293
- Yang et al. (2006) Yang, X., van den Bosch, F. C., Mo, H. J., et al. 2006, MNRAS, 369, 1293
- York et al. (2000) York, D. G., Adelman, J., Anderson, Jr., J. E., et al. 2000, AJ, 120, 1579
- Zaritsky et al. (1993) Zaritsky, D., Smith, R., Frenk, C., & White, S. D. M. 1993, ApJ, 405, 464
- Zaritsky et al. (1997) Zaritsky, D., Smith, R., Frenk, C., & White, S. D. M. 1997, ApJ, 478, 39
- Zentner et al. (2005) Zentner, A. R., Kravtsov, A. V., Gnedin, O. Y., & Klypin, A. A. 2005, ApJ, 629, 219