Bose Glass-BEC Transition of Magnons in Tl1-xKxCuCl3
Abstract
We report the magnetic-field induced Bose glassBEC transition of magnons in Tl1-xKxCuCl3 and its critical behavior investigated through specific heat and ESR measurements. The field dependence of the BEC transition temperature can be described by the power law near the quantum critical point T. The critical exponent tends to reach a value smaller than 1/2 with decreasing fitting window in contrast with for the standard BEC in pure system. At sufficiently low temperatures, the ESR line shape for is intermediate between Gaussian and Lorentzian. This indicates the localization of magnons for at .
pacs:
72.15.Rn, 75.10.Jm, 75.40.Cx, 76.30.-vHeisenberg antiferromagnets composed of spin dimers often have gapped ground states at zero magnetic field and undergo quantum phase transitions to ordered states in magnetic fields Rice ; Giamarchi . The field-induced magnetic ordering is typical of the quantum phase transition and has been actively studied both theoretically and experimentally O_mag ; Nikuni ; Rueegg ; O_k ; Jaime ; Matsumoto2 ; Kawashima ; Misguich ; Stone ; Yamada ; Dell fAmore ; Dodds . These studies have established that the coupled antiferromagnetic spin-dimer system in a magnetic field can be mapped onto a system of interacting lattice bosons, where the bosons are spin triplets with called magnons or triplons, and that the field-induced magnetic ordering is best described as the Bose-Einstein condensation (BEC) of magnons. However, for the case with exchange disorder, the nature of the ground state in a magnetic field and the critical behavior of the field-induced magnetic ordering are not sufficiently understood, although there have been some studies on this problem O_T ; Shindo ; Nohadani_bg ; Roscilde2 ; T_Goto ; Suzuki ; Hong .
In a magnetic field comparable to the gap, the effective Hamiltonian of magnons is expressed as
| (1) | |||||
The first, second and third terms denote the local potential, hopping and interaction of magnons, respectively. The intradimer exchange interaction on dimer site corresponds to the local potential of magnons, . The ground state and the quantum phase transition for lattice bosons in a random potential were investigated theoretically by Fisher et al. Fisher . They argued that a new phase called Bose glass (BG) emerges as a ground state in addition to BEC and Mott insulating (MI) phases, which correspond to the ordered phase and gapped phase in the magnetic system, respectively. Bosons are localized in the BG phase because of randomness, but there is no gap; thus the compressibility is finite. Fisher et al. showed that the BEC transition occurs only from the BG phase, and that near , the relation between transition temperature and boson density is expressed as where is the critical density at which the BEC transition occurs and is the condensate density at . Exponents and are given by and for three dimensions. The critical behavior is different from that of the standard BEC case without randomness, for which these exponents are and .
Recent theory has demonstrated the emergence of the BG phase in a disordered quantum magnet Nohadani_bg ; Roscilde2 . The BG phase has also been studied in other disordered quantum systems, such as 4He adsorbed on porous Vycor glass Fisher ; Crooker , amorphous superconductors Okuma and trapped cold atoms Fallani . From the correspondence between the boson density and the magnetization in the coupled spin-dimer system, a relation is obtained, where is the critical magnetic field of the magnon BEC. Hence, for the coupled spin-dimer system with exchange disorder, the transition field near should be expressed by the power law
| (2) |
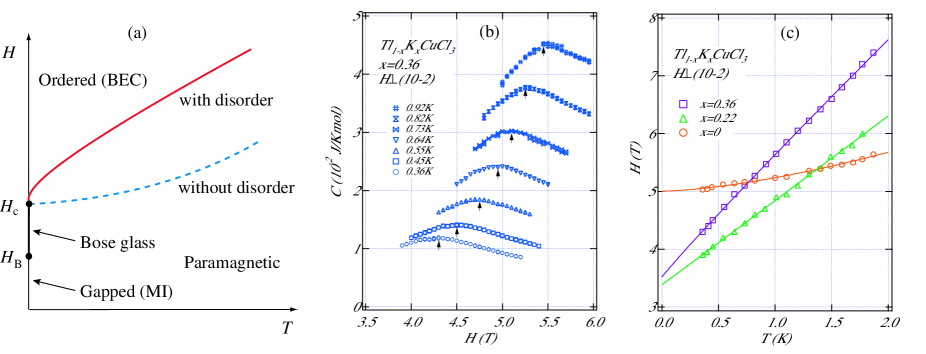
with the critical exponent . Consequently, the low-temperature phase boundary should be tangential to the field axis at , as shown in Fig. 1(a). This phase boundary behavior is qualitatively different from that of pure system, for which , and thus, the phase boundary is perpendicular to the field axis. in Fig. 1(a) is the critical field for the MI-BG transition. The BG phase exists between and .
To investigate the magnon BEC under the influence of the localization, we performed specific heat and ESR measurements on Tl1-xKxCuCl3. The parent compounds TlCuCl3 and KCuCl3 have the same crystal structure composed of the chemical dimer Cu2Cl6, in which Cu2+ ions have spin-1/2. Their magnetic ground states are spin singlets with excitation gaps of 7.5 K and 31 K, respectively Shiramura . The gaps originate from the strong antiferromagnetic exchange interaction between spins in the chemical dimer. The neighboring spin dimers couple antiferromagnetically in three dimensions. The intradimer exchange interaction was evaluated to be K and 50.4 K for TlCuCl3 and KCuCl3, respectively, Cavadini1 ; Cavadini2 ; O_inela . Because these two intradimer interactions are different, the partial K+ ion substitution for Tl+ ions produces the random local potential of the magnon note .
Single crystals of Tl1-xKxCuCl3 were synthesized from a melt comprising a mixture of TlCuCl3 and KCuCl3 in the ratio of to . The potassium concentration was determined by inductively coupled plasma optical emission spectrochemical analysis at the Center for Advanced Materials Analysis, Tokyo Institute of Technology. The specific heat was measured down to 0.36 K in magnetic fields up to 9 T using a physical property measurement system (Quantum Design PPMS) by the relaxation method. High-frequency, high-field ESR measurements were performed using the terahertz electron spin resonance apparatus (TESRA-IMR) Nojiri at the Institute for Material Research, Tohoku University. The temperature of the sample was lowered to 0.55 K using liquid 3He. A magnetic field was applied using a multilayer pulse magnet. In all the present experiments, the magnetic field was applied perpendicular to the cleavage (1, 0, ) plane, because the magnetic anisotropy in this plane is so small that the symmetry is approximately conserved Glazkov .
The specific heat obtained from the temperature scan exhibits a small cusplike anomaly due to magnetic ordering for T. The anomaly becomes smaller with decreasing magnetic field. Thus, we performed the field scan of the specific heat at various temperatures below 2 K. Some examples of the measurements for are shown in Fig. 1(b). The specific heat exhibits a cusplike anomaly, to which we assign the transition field . The transition field is well-defined within an error T. The phase transition points obtained below 2 K for , 0.22 and 0.36 are summarized in Fig. 1(c). It is clear that the critical behaviors of the phase boundaries for and near are qualitatively different. The phase boundary for is normal to the field axis for but is not for .
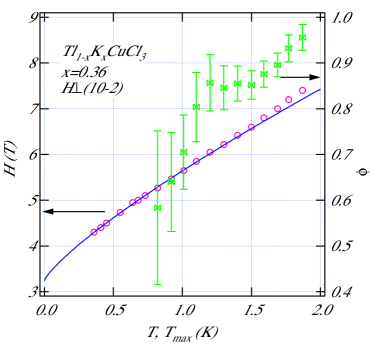
The phase boundaries shown in Fig. 1(c) can be described by the power law of eq. (2). For , we obtain using the data for K. The solid line for in Fig. 1(c) is the fit with . This critical exponent coincides with predicted by the BEC theory without disorder Nikuni ; Kawashima ; Misguich ; Fisher . On the other hand, for and 0.36, we obtain and , respectively, using all the data below 2 K. The solid lines for and 0.36 in Fig. 1(c) are the fits with these exponents. However, for , the critical exponent tends to decrease with decreasing fitting window. Thus, we analyze the critical behavior of the phase boundary for in detail. We fit eq. (2) in the temperature range of , setting the lowest temperature at K and varying the highest temperature from 1.87 K to 0.82 K. The critical exponent as a function of is shown in Fig. 2. The critical exponent decreases systematically with decreasing , and for K. The solid line in Fig. 2 is the fit with obtained for K. With decreasing used for fitting, the critical exponent shows a clear tendency to reach a value smaller than 1/2. This critical behavior is consistent with that for the BG-BEC transition discussed by Fisher et al. Fisher . The similar behavior for the critical exponent is also observed for .
As shown in Fig. 1(c), the critical field for and 0.36 is smaller than that for . For the following reason, this should be mainly attributed to the fact that the average intradimer interaction decreases with increasing . Within the framework of the dimer mean-field approximation O_k , the triplet gap is expressed as , where is expressed by a linear combination of interdimer interactions O_k . The gap shrinks either when the intradimer interaction is reduced or when the interdimer interaction is enhanced. The temperature giving the maximum magnetic susceptibility decreases with increasing , as shown in Fig. 1 in Ref. O_T . This indicates that the average intradimer interaction decreases with , because is given by in the mean-field approximation.
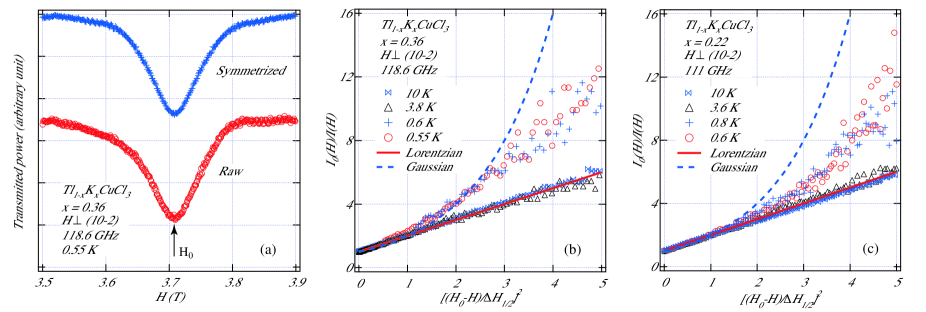
To investigate the localization of magnons, we performed ESR measurements on Tl1-xKxCuCl3 with and 0.36. The crystals used in the specific heat and ESR measurements were taken from the same batch. We used thick samples to gain intensities. The measurements were performed mainly at frequencies of 111 and 118.6 GHz for and 0.36, respectively. The paramagnetic resonance fields for these frequencies are estimated to be 3.55 and 3.80 T, using for . The resonance field is close to the critical field . A single ESR line was observed in the paramagnetic phase for K. Although the signal intensity decreases monotonically down to 0.55 K, the intensity is sufficient, even at the lowest temperature, to analyze the lineshape as shown in Fig. 3. The temperature dependence of the ESR intensity is similar to that of the magnetization O_T . We also measured ESR spectrum at 102 GHz, but we could not obtain well-defined signal to analyze the lineshape.
The lineshape of the ESR spectrum is a typical subject in the statistical mechanics of the irreversible process Anderson ; Kubo . In the paramagnetic phase, the linewidth is produced by the local field due to the perturbation that do not commute with the total spin such as the anisotropic exchange, dipolar interaction and the Zeeman interaction with nonuniform factors. From a statistical point of view, it is natural to assume that the local field has a Gaussian distribution. Thus, when the magnons created on the dimers localize, the lineshape should be Gaussian, because the distribution of the local field determines the lineshape of the ESR spectrum. On the other hand, if the magnons delocalize in the crystal, the local field acting on spins is rapidly averaged, so that the ESR spectrum is narrowed and becomes Lorentzian Anderson ; Kubo . This is called exchange narrowing.
Raw ESR spectrum is somewhat unsymmetrical with respect to the resonance field as shown in Fig. 3(a). This should be ascribed to the interference of the submillimeter wave inside the sample, because the wavelength of the submillimeter wave used and the sample thickness are the same order. Since the present system is insulator, this unsymmetrical lineshape is not intrinsic to sample. Thus, we symmetrized the spectrum, averaging both sides of , i.e., we put as the intensity at . The symmetrized spectrum has the flat baseline. To analyze the lineshape of these ESR spectra, we plot against , where is the line width at Dietz . When the lineshape is Gaussian, increases exponentially, while for the Lorentzian lineshape, is a linear function of with a slope of unity, as shown by dashed and solid lines, respectively, in Fig. 3(b) and (c). The vs plots at various temperatures for and 0.22 are shown in Fig. 3(b) and (c), respectively. We can see the similar temperature variation in these plots. at high temperatures is almost linear in with a slope of unity, which shows the Lorentzian lineshape. On the other hand, at sufficiently low temperatures, vs plot is between those of Lorentzian and Gaussian. Such an ESR lineshape is observed in one-dimensional Heisenberg antiferromagnet, in which the time correlation function of the local fields acting on the spins does not damp rapidly but has the long time tail Dietz .
In the present temperature range, the BEC phase is not reached even at the lowest temperature. At high temperatures, thermal hopping of magnons is activated. This causes the rapid averaging of the local fields, which leads to the narrowed Lorentzian lineshape. At sufficiently low temperatures, the thermal effect is suppressed. Thus, the intermediate lineshape observed for K can be attributed to the localization of magnons. Since the resonance fields for 111 and 118.6 GHz are close to the critical field , it is considered that the complete localization does not occur in the present temperature range, so that the lineshape is intermediate between Gaussian and Lorentian.
Oosawa and Tanaka O_T reported the results of magnetization measurements on Tl1-xKxCuCl3 with . The magnetization curve that they observed at K had a finite slope even for . This was not ascribed to the finite-temperature effect, because pure TlCuCl3 exhibits almost zero magnetization up to the critical field . This result indicates that the magnetic susceptibility for is finite in the ground state. Since the magnetic susceptibility corresponds to the compressibility of the lattice boson system , where is the chemical potential, the finite magnetic susceptibility for means that the compressibility of the ground state is finite. In the low-field phase below , long-range magnetic ordering is absent in spite of the finite susceptibility. These properties for are consistent with the characteristics of the BG phase Fisher . From these observations and the present ESR results, we can deduce that the ground state for in Tl1-xKxCuCl3 is the BG phase of magnons. The gapped MI phase for appears to be destroyed in the present system.
In conclusion, from the analysis of the phase transition data and the lineshape of ESR spectrum in Tl1-xKxCuCl3 combined with the previous result for magnetization measurement, we demonstrated that the quantum phase transition at is the BG-BEC transition of magnons and that the critical behavior for the temperature dependence of the transition field near is described by the small exponent characteristic of the BG-BEC transition Fisher .
We express our sincere thanks to M. Oshikawa, T. Suzuki, A. Oosawa, and T. Goto for discussions and comments. This work was supported by a Grant-in-Aid for Scientific Research (A) from the Japan Society for the Promotion of Science (JSPS), and a Global COE Program “Nanoscience and Quantum Physics” at TIT funded by the Ministry of Education, Culture, Sports, Science and Technology of Japan. T.O. was supported by a Grant-in-Aid for Young Scientists (B) from JSPS.
References
- (1) T. M. Rice, Science 298, 760 (2002).
- (2) T. Giamarchi, Ch. Rüegg, and O. Tchernyshyov, Nature Phys. 4, 198 (2008).
- (3) A. Oosawa, M. Ishii, and H. Tanaka, J. Phys.: Condens. Matter 11, 265 (1999).
- (4) T. Nikuni, M. Oshikawa, A. Oosawa, and H. Tanaka, Phys. Rev. Lett. 84, 5868 (2000).
- (5) Ch. Rüegg, N. Cavadini, A. Furrer, H.-U. Güdel, K. Krämer, H. Mutka, A. Wildes, K. Habicht, and P. Vorderwisch, Nature (London) 423, 62 (2003).
- (6) A. Oosawa, T. Takamasu, K. Tatani, H. Abe, N. Tsujii, O. Suzuki, H. Tanaka, G. Kido, and K. Kindo, Phys. Rev. B 66, 104405 (2002).
- (7) M. Jaime, V. F. Correa, N. Harrison, C. D. Batista, N. Kawashima, Y. Kazuma, G. A. Jorge, R. Stein, I. Heinmaa, S. A. Zvyagin, Y. Sasago, and K. Uchinokura, Phys. Rev. Lett. 93, 087203 (2004).
- (8) M. Matsumoto, B. Normand, T. M. Rice, and M. Sigrist: Phys. Rev. B. 69 (2004) 054423.
- (9) N. Kawashima, J. Phys. Soc. Jpn. 73, 3219 (2004).
- (10) G. Misguich and M. Oshikawa, J. Phys. Soc. Jpn. 73, 3429 (2004).
- (11) M. B. Stone, C. Broholm, D. H. Reich, P. Schiffer, O. Tchernyshyov, P. Vorderwisch, and N. Harrison, New J. Phys. 9, 31 (2007).
- (12) F. Yamada, T. Ono, H. Tanaka, G. Misguich, M. Oshikawa, and T. Sakakibara, J. Phys. Soc. Jpn. 77, 013701 (2008).
- (13) R. Dell fAmore, A. Schilling, and K. Krämer, Phys. Rev. B 78, 224403 (2008).
- (14) T. Dodds, B.-J. Yang, and Y. B. Kim, Phys. Rev. B 81, 054412 (2010).
- (15) A. Oosawa and H. Tanaka, Phys. Rev. B 65, 184437 (2002).
- (16) Y. Shindo and H. Tanaka, J. Phys. Soc. Jpn. 73, 2642 (2004).
- (17) O. Nohadani, S. Wessel, and S. Haas, Phys. Rev. Lett. 95, 227201 (2005).
- (18) T. Roscilde and S. Haas, J. Phys. B: At. Mol. Opt. Phys. 39, S153 (2006).
- (19) T. Goto, T Suzuki, K. Kanada, T. Saito, A. Oosawa, I Watanabe, and H. Manaka: Phys. Rev. B 78, 054422 (2008).
- (20) T. Suzuki, F. Yamada, T. Kawamata, I. Watanabe, T. Goto, and H. Tanaka, Phys. Rev. B 79, 104409 (2009).
- (21) T. Hong, A. Zheludev, H. Manaka, and L.-P. Regnault: Phys. Rev. B 81, 060410(R) (2010).
- (22) M. P. A. Fisher, P. B. Weichman, G. Grinstein, and D. S. Fisher, Phys. Rev. B 40, 546 (1989).
- (23) B. C. Crooker, B. Hebral, E. N. Smith, Y. Takano, and J. D. Reppy, Phys. Rev. Lett. 51, 666 (1983).
- (24) S. Okuma, S. Shinozaki, and M. Morita, Phys. Rev. B 63, 054523 (2001).
- (25) L. Fallani, J. E. Lye, V. Guarrera, C. Fort, and M. Inguscio, Phys. Rev. Lett. 98, 130404 (2007).
- (26) W. Shiramura, K. Takatsu, H. Tanaka, M. Takahashi, K. Kamishima, H. Mitamura, and T. Goto, J. Phys. Soc. Jpn. 66, 1900 (1997).
- (27) N. Cavadini, W. Henggler, A. Furrer, H.-U. Güdel, K. Krämer, and H. Mutka, Eur. Phys. J. B 7, 519 (1999).
- (28) N. Cavadini, G. Heigold, W. Henggeler, A. Furrer, H.-U. Güdel, K. Krämer, and H. Mutka, Phys. Rev. B 63, 172414 (2001).
- (29) A. Oosawa, T. Kato, H. Tanaka, K. Kakurai, M. Müller, and H.-J. Mikeska, Phys. Rev. B 65, 094426 (2002).
- (30) This partial ion substitution produces not the binomial distribution for but a continuous distribution, because the configuration of K+ and Tl+ ions around the chemical dimer Cu2Cl6 determines the intradimer interaction.
- (31) H. Nojiri, Y. Ajiro, T. Asano, and J. P. Boucher, New J. Phys. 8, 218 (2006).
- (32) V. N. Glazkov, A. I. Smirnov, H. Tanaka, and A. Oosawa, Phys. Rev. B 69, 184410 (2004).
- (33) P. W. Anderson and P. R. Weiss, Rev. Mod. Phys. 25, 269 (1953).
- (34) R. Kubo and K. Tomita, J. Phys. Soc. Jpn. 9, 45 (1954).
- (35) R. E. Dietz, F. R. Merritt, R. Dingle, D. Hone, B. G. Silbernagel, and P. M. Richards, Phys. Rev. Lett. 26, 1186 (1971).