11email: emmanuel.lellouch@obspm.fr 22institutetext: Max-Planck-Institut für Sonnensystemforschung, Katlenburg-Lindau, Germany 33institutetext: Max-Planck-Institut für extraterrestrische Physik, Giessenbachstraße, 85748 Garching, Germany 44institutetext: Instituut voor Sterrenkunde, Katholieke Universiteit Leuven, Belgium 55institutetext: SRON, Groningen, the Netherlands 66institutetext: Jet Propulsion Laboratory, California Institute of Technology, Pasadena, United States 77institutetext: Space Research Centre, Polish Academy of Science, Warszawa, Poland 88institutetext: Blue Sky Spectroscopy Inc., Lethbridge, Alberta, Canada 99institutetext: European Space Astronomy Center, Madrid, Spain 1010institutetext: Instituto de Astrofísica de Andalucía (CSIC), Granada, Spain 1111institutetext: California Institute of Technology, Pasadena, United States 1212institutetext: Rutherford Appleton Laboratory, Oxfordshire, United Kingdom 1313institutetext: Deutsches Zentrum für Luft- und Raumfahrt (DLR), Bonn, Germany 1414institutetext: University of Michigan, Ann Arbor, United States 1515institutetext: Université de Bordeaux, Observatoire Aquitain des Sciences de l’Univers, CNRS, UMR 5804, Laboratoire d’Astrophysique de Bordeaux, France 1616institutetext: Laboratorio de Astrofísica Molecular, CAB. INTA-CSIC, Spain 1717institutetext: Joint Astronomy Center, Hilo, United States 1818institutetext: LERMA, Observatoire de Paris, and Univ. Pierre et Marie Curie, Paris, France 1919institutetext: F.R.S.-FNRS, Institut d’Astrophysique et de Géophysique, Liège, Belgium 2020institutetext: Herschel Science Centre, European Space Astronomy Centre, Madrid, Spain 2121institutetext: University of Lethbridge, Canada 2222institutetext: University of Bern, Switzerland 2323institutetext: University of Cologne, Germany 2424institutetext: Max-Planck-Institut für Radioastronomie, Bonn, Germany 2525institutetext: Experimental Physics Dept., National University of Ireland Maynooth, Co. Kildare. Ireland
First results of Herschel / PACS observations of Neptune ††thanks: Herschel is an ESA space observatory with science instruments provided by European-led Principal Investigator consortia and with important participation from NASA.
We report on the initial analysis of a Herschel / PACS full range spectrum of Neptune, covering the 51-220 m range with a mean resolving power of 3000, and complemented by a dedicated observation of CH4 at 120 m. Numerous spectral features due to HD (R(0) and R(1)), H2O, CH4, and CO are present, but so far no new species have been found. Our results indicate that (i) Neptune’s mean thermal profile is warmer by 3 K than inferred from the Voyager radio-occultation; (ii) the D/H mixing ratio is (4.51)10-5, confirming the enrichment of Neptune in deuterium over the protosolar value (2.110-5); (iii) the CH4 mixing ratio in the mid stratosphere is (1.50.2)10-3, and CH4 appears to decrease in the lower stratosphere at a rate consistent with local saturation, in agreement with the scenario of CH4 stratospheric injection from Neptune’s warm south polar region; (iv) the H2O stratospheric column is (2.10.5)1014 cm-2 but its vertical distribution is still to be determined, so the H2O external flux remains uncertain by over an order of magnitude; and (v) the CO stratospheric abundance is about twice the tropospheric value, confirming the dual origin of CO suspected from ground-based millimeter/submillimeter observations.
Key Words.:
Planets and satellites: individual: Neptune; Techniques: spectroscopic; Infrared: solar system; Radio lines: solar system)1 Introduction
Neptune’s thermal emission has been initally explored from the ground in the 8-13 m window and in the millimeter range and by the Voyager spacecraft in 1989, but detailed views of its spectrum had to await sensitive instrumentation onboard ISO (see review in Bézard et al. 1999a), Spitzer (Meadows et al. 2008) and recently AKARI (Fletcher et al. 2010). Altogether, these observations have revealed a surprisingly rich composition of Neptune’s stratosphere, including numerous hydrocarbons (CH4, C2H2, C2H6, CH3, C2H4, CH3C2H, C4H2), oxygen-bearing species (CO, CO2, and H2O), HCN, as well as deuterium species CH3D and HD. Favorable factors for observing minor species in Neptune’s atmosphere are (i) its relatively warm stratosphere (140 K at 1 mbar) that enhances IR emission; and (ii) Neptune’s large internal heat source that results in rapid convection updrafting minor disequilibrium species, notably CO, up to observable levels. Neptune’s submillimeter spectrum longwards of 50 m has been observed by ISO/LWS (Burgdorf et al. 2003), but the signal–to–noise ratio in the data was not high enough to reveal spectral features. In this paper, we report the first results from observations of Neptune at 51-220 m (195–45 cm-1) with the PACS instrument onboard Herschel (Pilbratt et al. 2010), performed in the framework of the KP-GT “Water and Related Chemistry in the Solar System”, also known as “Herschel Solar System observations” (Hartogh et al. 2009).
2 Herschel / PACS observations
| Obs. ID | Start Time | Tobs | Range111grating order and filter: k = 2A, l = 3A, m = 2B, n = 1 red |
|---|---|---|---|
| [UTC] | [min.] | [m] | |
| 1342186536 | 30-Oct-2009 00:58:36 | 116 | 51-72k, 102-145n |
| 1342186537 | 30-Oct-2009 03:01:48 | 133 | 51-62l, 150-186n |
| 1342186538 | 30-Oct-2009 05:22:32 | 203 | 60-73l, 180-220n |
| 1342186539 | 30-Oct-2009 08:53:20 | 151 | 68-85m, 120-171n |
| 1342186540 | 30-Oct-2009 11:31:41 | 236 | 82-102m, 165-220n |
| 1342186571 | 31-Oct-2009 14:35:00 | 82 | 118.4-120.9n |
All observations (Table 1) were carried out in chopped-nodded PACS range spectroscopy modes (Poglitsch et al. (2010)) at high spectral sampling density. The entire spectral range of PACS has been measured at full instrumental resolution ranging from 950 to 5500 depending on wavelength and grating order (PACS Observers Manual (2010)). A summary of the observations is given in Table 1. Since blue and red spectrometer data are acquired in parallel, several spectral ranges have been observed in overlap. Given the instrumental spatial pixel size of 9.4”9.4”, Neptune (2.297” as seen from Herschel) can be considered as a point source, and the analyzed spectra therefore originate only in the central spatial pixel of the integral field spectrometer.
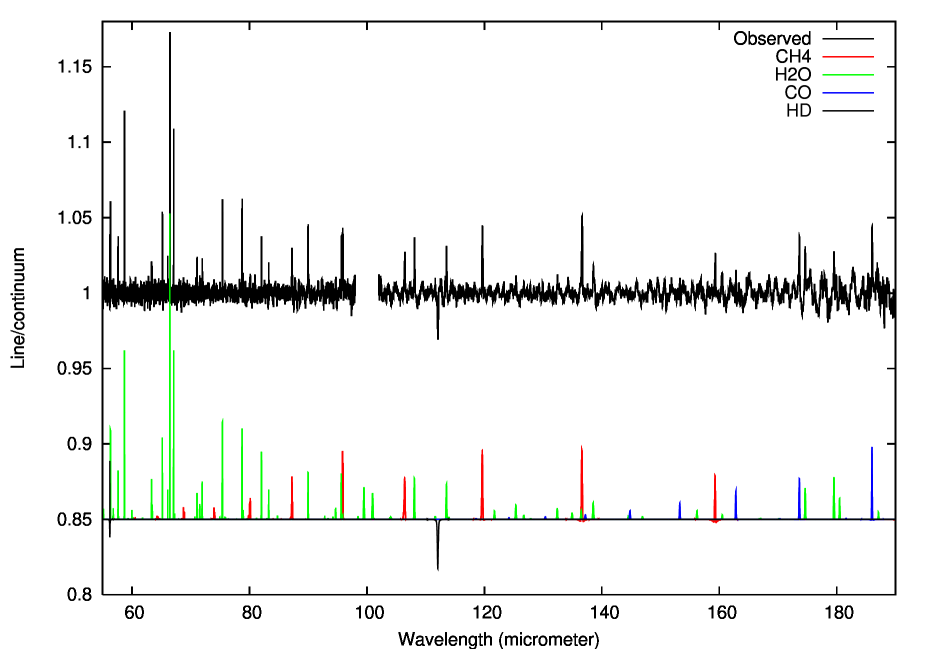
Starting from Level 0 products, the processing of all observations was carried by standard PACS pipeline modules (Poglitsch et al. (2010)) up to Level 1. Individual spectral pixels were then scaled onto their common mean in order to improve the removal of signal outliers caused by cosmic ray hits. After application of an iterative -clipping, adapted to the instrumental resolution, the remaining data were rebinned onto an oversampled wavelength grid to ensure conservation of spectral resolution. The absolute flux calibration of the instrument and improvements on the relative spectral response function are still in progress. Therefore the resulting spectrum was then divided by its continuum, to be robust against forthcoming calibration updates. The composite spectrum is shown in Fig.1. It shows emission signatures due to CH4, H2O, CO, as well as the R(0) and R(1) lines of HD at 112 and 56 m, seen respectively in absorption and emission. At this stage of the data reduction, features below 0.5-1 % contrast must be treated with caution. No new species are detected at this level.
A dedicated line–scan high S/N observation of the CH4 119.6 m rotational line was also acquired in order to get a high precision measure of the CH4 stratospheric abundance.
3 Analysis and discussion
3.1 Thermal profile and D/H abundance
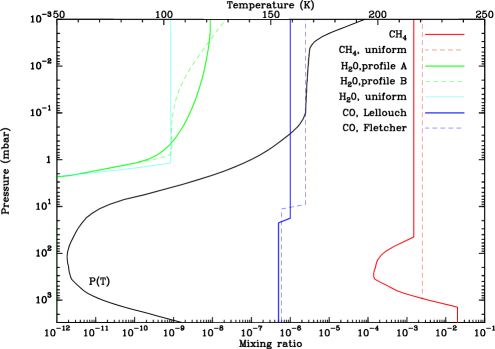
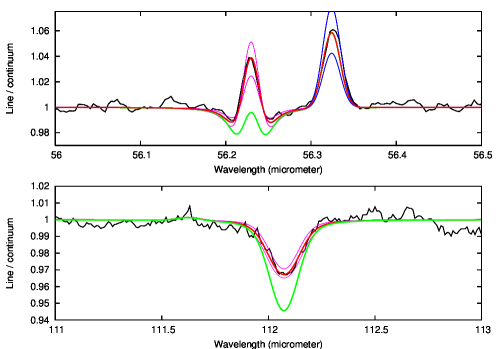
Observations were analyzed by means of a standard radiative transfer code, in which the outgoing radiance from Neptune was integrated over all emission angles. The effective spectral resolution as a function of wavelength was determined by fitting the widths of the H2O lines, whose profile is purely instrumental. We initially considered thermal profiles inferred in previous work (Marten et al. 2005, Bézard et al. 1998, Fletcher et al. 2010, respectively from ground-based, ISO, and AKARI observations). Below about 0.5 bar, all of them follow the Voyager radio-occultation profile (Lindal 1992, see also Moses et al. 2005). Above this level, these profiles diverge significantly, showing excursions of 5 K over 10-200 mbar, and even larger dispersion (10-20 K) at lower pressures. Over 50-200 m, Neptune’s continuum is formed near the 500 mbar level (TB 59 K). The HD lines typically probe the 10-500 mbar range (peak contribution near 2 mbar at line center). Because they show a contrasted absorption/emission appearance and because HD is vertically well mixed, they provide a sensitive thermometer in this region. For HD, we used the same linestrengths as in Feuchtgruber et al. (1999). We found that the Fletcher et al. (2010) nominal profile (their Fig. 5) allowed a much better fit of the HD lines than the other two profiles, and achieved optimum fit for temperatures equal to 0.9Fletcher + 0.1Marten (Fig. 2). This gives 54.5 K at the tropopause, 3 K higher than in Lindal (1992). Given Neptune’s temperature field as inferred from Voyager measurements (Conrath et al. 1998), this is probably related to the high latitude (42∘S) of the Voyager occultations. Based on mid–infrared measurements of ethane, Hammel et al. (2006) also found enhanced temperatures (but at sub-mbar levels) compared to Voyager, a likely consequence of seasonal variability. Although the HD lines do not constrain temperatures above the 1 mbar level (needed in particular for analyzing the H2O lines), we retained the 0.9Fletcher + 0.1Marten combination for all levels. We determined HD/H2 = (92)10-5, i.e. a D/H ratio of (4.51)10-5 (Fig. 3). This is nominally less than but consistent with the (6.510-5 value inferred by Feuchtgruber et al. (1999) from observations of the R(2) line of HD by ISO/SWS, and confirms that Neptune is enriched in deuterium compared to the protosolar value (2.110-5) represented by Jupiter and Saturn (Lellouch et al. 2001). We defer a joint analysis of ISO and Herschel data to future work.
3.2 Methane, water, and carbon monoxide abundances and profiles
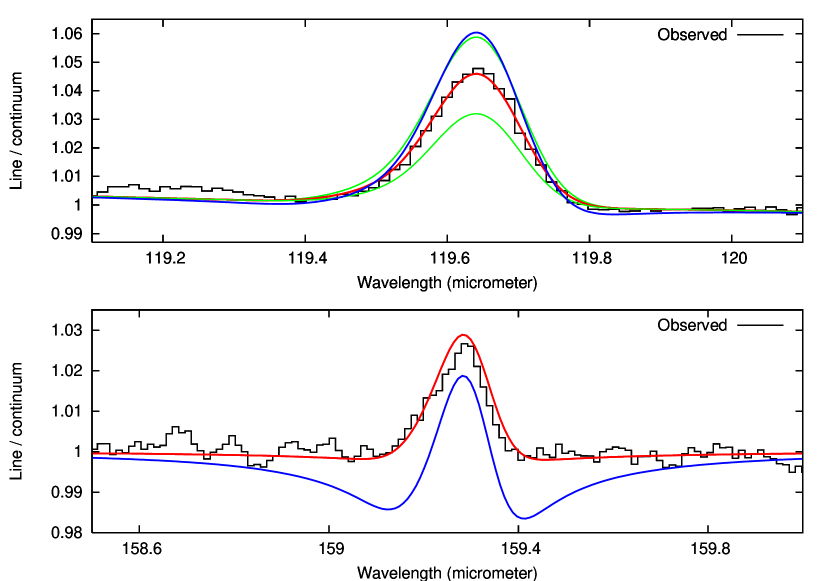
Methane has been observed in Neptune’s stratosphere with a range of abundances exceeding the saturation value at the tropopause cold trap (e.g. Baines and Hammel, 1994). The PACS spectrum shows several rotational lines of CH4 in emission over 80–160 m. Thanks to the mild temperature dependence of the Planck function in this spectral range, these lines are well suited to determination of the CH4 stratospheric abundance. We assumed a CH4 abundance of 2 % in the deep troposphere, then following the saturation law. In the stratosphere, the CH4 profile was characterized by its high–altitude mixing ratio () and assumed to follow local saturation below the condensation point near 40 mbar. Utilizing the Boudon et al. (2010) results on the absolute CH4 line strengths and in particular using the high S/N dedicated CH4 120 m line scan (Fig. 4), we determined = (1.50.2)10-3, consistent with Bézard et al. (1999b) ((0.5–2)10-3) but only marginally with Fletcher et al. (2010) ((0.90.3)10-3). Because of the progressive increase of the continuum level longwards of 100 m, the CH4 features at 137 m and particularly 159 m are sensitive to the CH4 amount in the lower stratosphere. An alternate assumption would be that the CH4 is supersaturated there, as could perhaps result from strong convective overshoot. This situation leads, however, to unobserved absorption wings at 159 m and to inconsistent mixing ratios for the different lines (Fig. 4). A 1.510-3 mixing ratio is 10 times greater than allowed by the 56 K cold trap, and consistent with saturation at 60 K. The most probable origin of this elevated stratospheric abundance is that CH4 leaks from the hot (62–66 K at the tropopause) Southern region (Orton et al. 2007) and is redistributed planetwide by global circulation. A combined analysis of the PACS, ISO, Spitzer, and AKARI data in terms of stratospheric methane and temperature profile will be performed in the future.
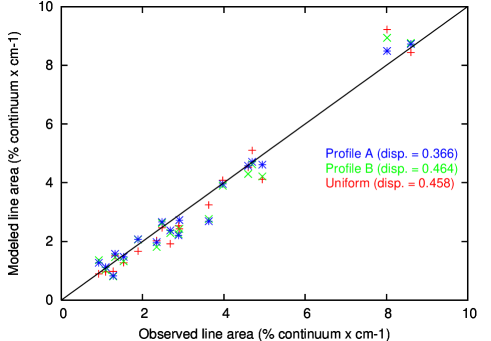
The presence of H2O in giant planet stratospheres, including Neptune’s, was established from ISO/SWS 30–45 m spectra (Feuchtgruber et al. 1997), demonstrating the existence of an external oxygen supply. In Neptune’s case, ISO observations determined a (2–4)1014 cm-2 column density, but did not establish the water vertical profile, a parameter needed to derive the rate at which water is removed by vertical mixing and condensation and to infer the input flux of water. More than 20 H2O lines, encompassing over a range in opacity of more than an order of magnitude (0.2 to 2.5), are detected in the PACS spectrum. If uniformly mixed above the condensation level near 1.2 mbar, the water mixing ratio is q = (0.850.2) ppb, and its column density is (2.10.5)1014 cm-2. Following Feuchtgruber et al. (1997), we also considered H2O vertical profiles resulting from transport models, characterized by the eddy diffusion coefficient profile (profiles ”A” and ”B”, see Fig. 2). For a given vertical profile, the water amounts we determined from the data were identical, to within 10 %, to the values inferred from ISO. However, the associated external fluxes vary strongly (1.4105 cm-2s-1 for model A and 9106 cm-2s-1 for model B). We leave the detailed retrieval of Neptune’s water profile (including PACS targeted observations of several weak lines and a deep 557 GHz HIFI observation) for the future. For the time being, an elementary analysis based on the integrated linewidths favors profile A over the other two water profiles (Fig.5), suggesting that the water mixing ratio increases with altitude over 0.1–1 mbar.
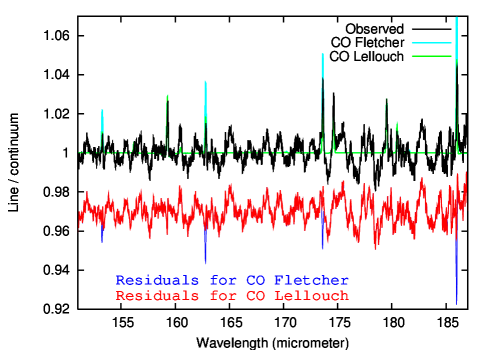
Recent CO observations at millimeter/submillimeter wavelengths (Lellouch et al. 2005, Hesman et al. 2007) point to a higher abundance of CO in Neptune’s stratosphere than in the troposphere. Both studies thus indicate a dual external/internal source, with the external source possibly provided by an ancient cometary impact. They also provide consistent values of the CO tropospheric mixing ratio (0.5-0.6 ppm). However, they differ by more than a factor of 2 (110-6 and 2.210-6, respectively) on the stratospheric CO abundance (Fig. 2). Support for the Hesman et al. value was reported from the detection of CO fluorescence at 4.7 m by AKARI (Fletcher et al. 2010), from which a 2.5 ppm abundance of CO above the 10-mbar pressure level was inferred. We find here that the CO lines longward of 150 m (Fig. 6) instead imply a CO stratospheric abundance of 1 ppm, in agreement with Lellouch et al. (2005). The detailed determination of the CO profile will be possible from combined analysis of PACS, SPIRE, and new broadband ground-based millimeter data.
Acknowledgements.
PACS has been developed by a consortium of institutes led by MPE (Germany) and including UVIE (Austria); KUL, CSL, IMEC (Belgium); CEA, OAMP (France); MPIA (Germany); IFSI, OAP/AOT, OAA/CAISMI, LENS, SISSA (Italy); IAC (Spain). This development has been supported by the funding agencies BMVIT (Austria), ESA-PRODEX (Belgium), CEA/CNES (France), DLR (Germany), ASI (Italy), and CICT/MCT (Spain). Additional funding support for some instrument activities has been provided by ESA. Data presented in this paper were analysed using “HIPE”, a joint development by the Herschel Science Ground Segment Consortium, consisting of ESA, the NASA Herschel Science Center, and the HIFI, PACS and SPIRE consortia. We are indebted to Bruno Bézard for important discussions on the HD and CH4 line parameters.References
- Baines et al. (1994) Baines, K. & Hammel, H. 1994, Icarus, 109, 20
- (2) Bézard, B., Romani, P., Feuchtgruber, H. & Encrenaz, T, 1998, Ap. J., 515, 868
- (3) Bézard, B., Encrenaz, T., Lellouch, E., Feuchtgruber, H., 1999a, Science, 283, 800
- (4) Bézard, B., Encrenaz, T, & Feuchtgruber, H., 1999b, ESA-SP 427, 153
- Boudon et al. (2010) Boudon, V., et al., 2010, J. Quant. Spectro. Rad. Transf., 111, 1117
- Burgdorf et al. (2003) Burgdorf, M., et al., 2003, Icarus, 164, 244
- Conrath et al. (1998) Conrath, B.J., Gierasch, P.J, & Ustinov, E.A., 1998, Icarus, 135, 501
- Feuchtgruber et al. (1997) Feuchtgruber, H., et al., 1997, Nature, 389, 159
- Feuchtgruber et al. (1999) Feuchtgruber, H., et al., 1999, A&A, 341, L17
- Hammel et al. (2006) Hammel, H.B., et al., ApJ, 644, 1326
- Hartogh et al. (2010) Hartogh, P., et al. 2009, Planet. and Space Sci., 57, 1596
- Hesman et al. (2007) Hesman, B.E., Davis, G.R., Matthews, H.E., & Orton, G.S., 2007, Icarus, 186, 342
- Lellouch et al. (2001) Lellouch, E., et al., 2001, A& A, 370, 610
- Lellouch et al. (2005) Lellouch, E., Moreno, & G. Paubert, 2005, A& A, 430, L37
- Lindal (1992) Lindal, G.F., 1992, AJ, 103, 967
- Fletcher et al. (2010) Fletcher, L., et al. 2010, A&A, in press
- Marten et al. (2005) Marten, A., et al., 2005, A&A, 1097
- Meadows et al. (2008) Meadows, V.S., et al., 1999, Icarus, 197, 585
- Moses et al. (2005) Moses, J.I. et al., 2005, JGR, 110, E08001, doi:10.1029/2005JE002411
- Orton et al. (2007) Orton, G.S., et al., 2007, A&A, 473, L5
- Pilbratt et al. (2010) Pilbratt, G., & many others 2010, A&A this issue
- Poglitsch et al. (2010) Poglitsch, A., Waelkens, C., Geis, N., Feuchtgruber, H., et al., 2010, A&A this issue
- PACS Observers Manual (2010) PACS Observers Manual, 2010, http://Herschel.esac.esa.int/ Docs/PACS/pdf/pacs_om.pdf
- (24)