In-medium mass from the reaction
Abstract
Data on the photoproduction of mesons on nuclei have been re-analyzed in a search for in-medium modifications. The data were taken with the Crystal Barrel(CB)/TAPS detector system at the ELSA accelerator facility in Bonn. First results from the analysis of the data set were published by D. Trnka et al. in Phys. Rev. Lett 94 (2005) 192303 david , claiming a lowering of the mass in the nuclear medium by 14 at normal nuclear matter density. The extracted line shape was found to be sensitive to the background subtraction. For this reason a re-analysis of the same data set has been initiated and a new method has been developed to reduce the background and to determine the shape and absolute magnitude of the background directly from the data. Details of the re-analysis and of the background determination are described. The signal on the target, extracted in the re-analysis, does not show a deviation from the corresponding line shape on a target, measured as reference. The earlier claim of an in-medium mass shift is thus not confirmed. The sensitivity of the line shape to different in-medium modification scenarios is discussed.
pacs:
14.40.Be, 21.65.-f, 25.20.-xI Introduction
Quantum Chromodynamics (QCD) has been remarkably successful in describing
strong interactions at high energies ( GeV ) and short distances
( fm) where quarks and gluons are the relevant degrees of
freedom. At these scales the strong coupling is so small () that perturbative treatments provide a first order description of the
phenomena Gross ; Politzer ; Wilczek . Applying QCD at lower energies is a
major challenge. In the GeV energy range the coupling strength among quarks
and gluons becomes very large and hadrons - composite objects made of quarks
and gluons - emerge as the relevant degrees of freedom. A rigorous way to
solve QCD in this energy regime is lattice QCD. With the advent of high speed
supercomputers remarkable progress has been achieved in lattice QCD
simulations with dynamical and quarks. Dürr et al Duerr
have recently succeeded in reproducing masses of mesons and baryons within
3 of the experimental values.
While the properties of free hadrons are in
most cases experimentally known with resasonable accuracy a possible
modification of these properties in a strongly interacting medium is a much
debated issue. In fact, in-medium changes of hadron properties have been
identified as one of the key problems in understanding the non-perturbative
sector of QCD. Fundamental symmetries in QCD provide guidance in dealing with
strong interaction phenomena in the non-perturbative domain. Furthermore, QCD
sum rules have been applied to connect the quark-gluon sector to hadronic
descriptions. Along these lines, QCD inspired hadronic models have been
developed to calculate the in-medium self-energies of hadrons and their
spectral functions. Mass shifts and/or in-medium broadening as well as more
complex structures in the spectral function due to the coupling of vector
mesons to nucleon resonances have been predicted. A recent overview is given
in RWH . These studies have motivated widespread experimental attempts
to confirm or refute these theoretical predictions.
Heavy-ion collisions and reactions with photons and protons have been used to
extract experimental information on in-medium properties of hadrons. The
experiments have focused on the light vector mesons and since their decay lengths are comparable to nuclear dimensions after being produced in some nuclear reaction. To ensure a reasonable decay probability in the strongly interacting medium cuts on the recoil momentum are, however, required for the longer lived and mesons.
A full consensus has not yet been reached among the different
experiments. A detailed account of the current status of the field is given in
comprehensive reviews Hayano_Hatsuda ; LMM . An in-medium broadening of
the vector mesons is reported by almost all experiments and the majority of
experiments does not find evidence for a mass shift. Apart from david
only one other experiment at KEK Naruki reports a drop of the
and mass by 9 at normal nuclear matter density. Studying
meson production in ultra-relativistic heavy-ion collisions, the NA60
collaboration observes a suppression of the meson yield for momenta
below 1 GeV/c which is even more pronounced for more central collisions
Arnaldi . This is interpreted as evidence for in-medium modifications of
slow mesons but it cannot be concluded whether this is due to a mass
shift, a broadening, or both.
It should be noted that a search for mass shifts has turned out to be much
more complicated than initially thought for those cases where a strong
broadening of the meson is observed as for the Kotulla and
meson Ishikawa . In the decay mode the increase in the total width of drastically lowers the branching ratio for in-medium decays into this channel and thereby reduces the sensitivity of the observed signal to in-medium modifications.
In this paper data on the photoproduction of mesons on and
are re-analyzed which were taken with the CB/TAPS detector system
at the ELSA accelerator facility in Bonn. First results from an analysis of
these data were published by D. Trnka et al. david , claiming a mass
shift of the meson by -14 at normal nuclear matter density. This
information was extracted from a comparison of the signals on and
, reconstructed in the channel. As pointed out in the
literature Kaskulov the deduced line shapes are very sensitive to the
background subtraction. While in the initial work the background was
determined by fitting the invariant mass spectrum a much more
refined background determination is used in the current analysis. The paper
gives a full account of the experiment and details of the analysis steps.
II Experimental Setup
II.1 CB/TAPS detector system at ELSA
Data on and have been taken with the detector system Crystal
Barrel (CB) aker92 and TAPS Novotny1 ; Gabler1 at the electron
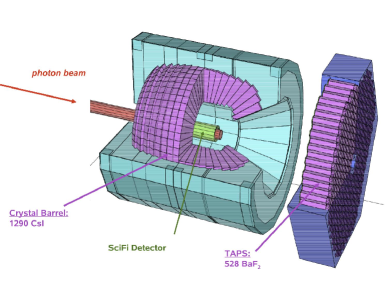
stretcher facility ELSA Husmann ; Hillert . The detector setup is shown
schematically in Fig. 1 left. Electrons extracted from ELSA with energy
hit a primary radiation target, a thin copper or diamond crystal, and
produce bremsstrahlung Elsner . The energy of the bremsstrahlung
photons is determined eventwise from the deflection of the scattered electrons
in a magnetic field. The detector system in the focal plane of the magnet
consists of 480 scintillating fibers and 14 partly overlapping scintillator
bars. From the energy of the scattered electron the energy of the
photon impinging on the nuclear target is given by . Photons were tagged in the energy range from 0.5 GeV up to 2.6 GeV
for an incoming electron energy of 2.8 GeV. The total tagged photon intensity
was about in this energy range. The energy resolution varied
between 2 MeV for the high photon energies and 25 MeV for the low photon
energies, respectively. The part of the beam that did not produce any
bremsstrahlung photons was deflected by the magnet as well. Since these
electrons retained their full energy the curvature of their track is smaller
and they passed over the tagger into a beam dump.
The Crystal Barrel (CB) detector, a photon calorimeter consisting of 1290
CsI(Tl) crystals (16 radiation lengths), covered the complete
azimuthal angle and the polar angle from to . The
and targets (30 mm in diameter, 53 mm, 20 mm and 1 mm thick,
respectively) were mounted in the center of the CB, surrounded by a
scintillating fibre-detector to register charged particles suft . The
CB was combined with a forward detector - the TAPS calorimeter - consisting of
528 hexagonal BaF2 crystals (12 ), covering polar angles
between and and the complete azimuthal angle. In front of each
BaF2 module a 5 mm thick plastic scintillator was mounted for the
identification of charged particles. The combined CB/TAPS detector covered
99% of the full 4 solid angle. The high granularity of this system makes
it very well suited for the detection of multi-photon final states.
II.2 The trigger
mesons produced by photons on a nuclear target were identified via their decay. Events with candidates (3 photons in the final state) were selected with suitable trigger conditions: the first level trigger was derived from TAPS, requiring either 2 hits above a low threshold (A) or, alternatively, 1 hit above a high threshold (B). The second level trigger (C) was based on a fast cluster recognition (FACE) logic, providing the number n of clusters in the Crystal Barrel as well as their energy and angle within 10 s . For the data on the solid target the total trigger condition required , with n = 2 clusters identified on the second level (C). Events with two photon candidates were taken for calibration purposes and for checking the analysis with known cross sections.
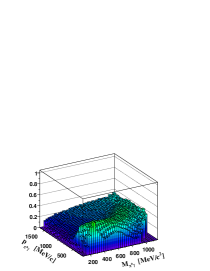
II.3 Detector acceptance
Although the CB/TAPS detector system covers almost the full solid angle it is nevertheless very important to study the acceptance for reconstructing the reaction of interest. Monte Carlo (MC) simulations of the reaction have been performed for solid targets using the GEANT3 package, assuming a phase space distribution of the final state particles and taking the Fermi motion of nucleons in the target nucleus into account. The reconstruction of simulated data is done for the same trigger conditions as in the experiment and for the incident photon energy range from 900 to 2200 MeV. The acceptance as a function of the invariant mass and the momentum of the final state is shown in Fig. 1 right. In the mass range the acceptance is rather flat as a function of momentum and amounts to 35.
III Analysis
III.1 Calibration
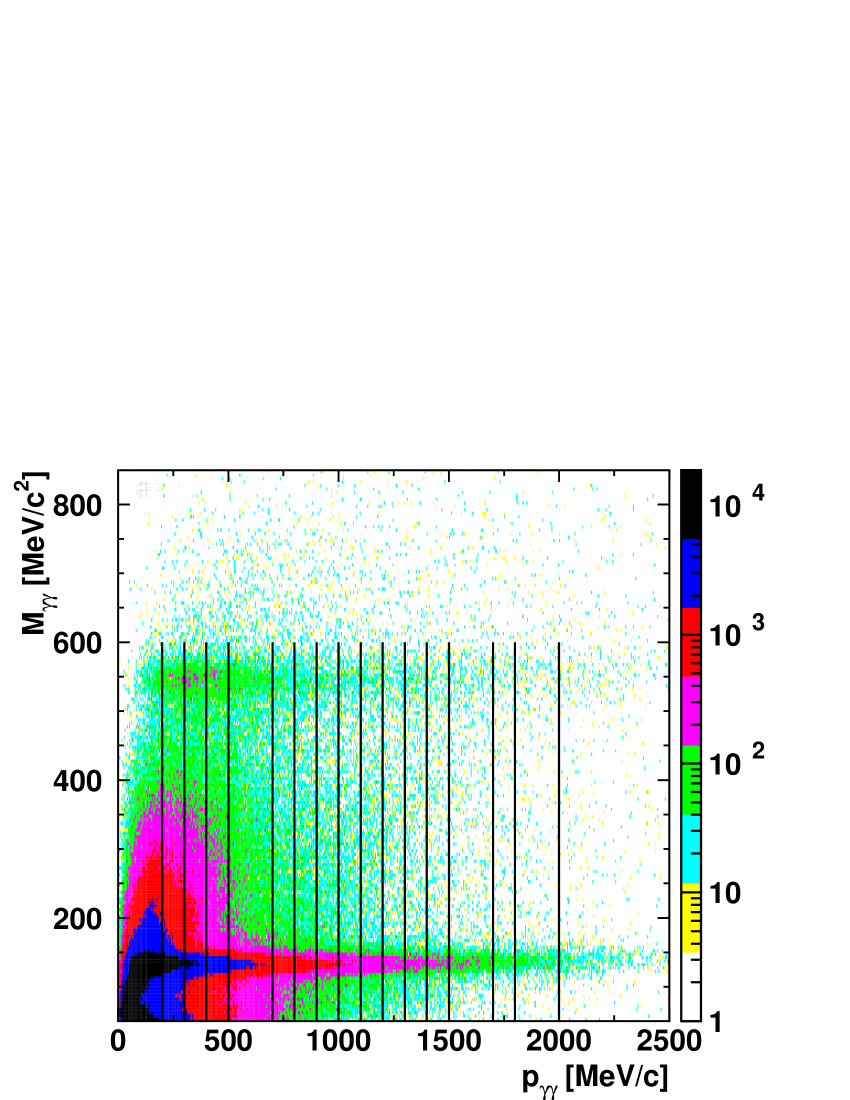
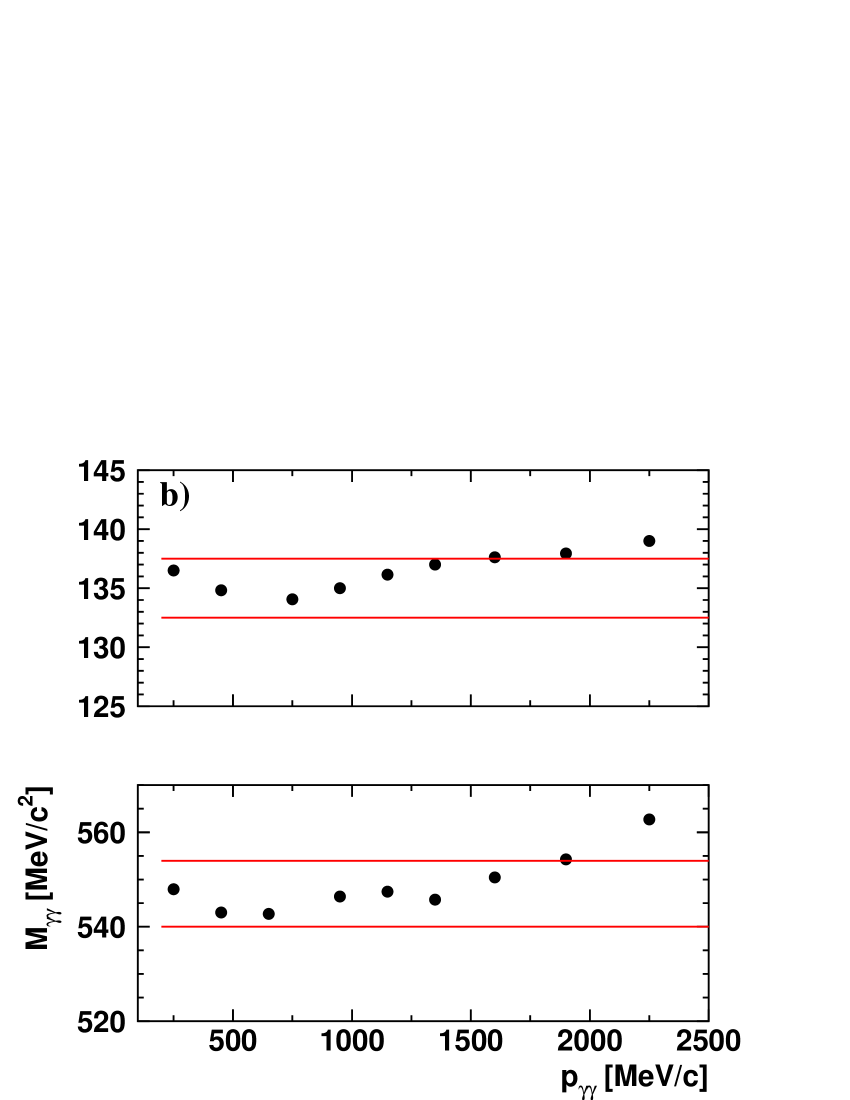
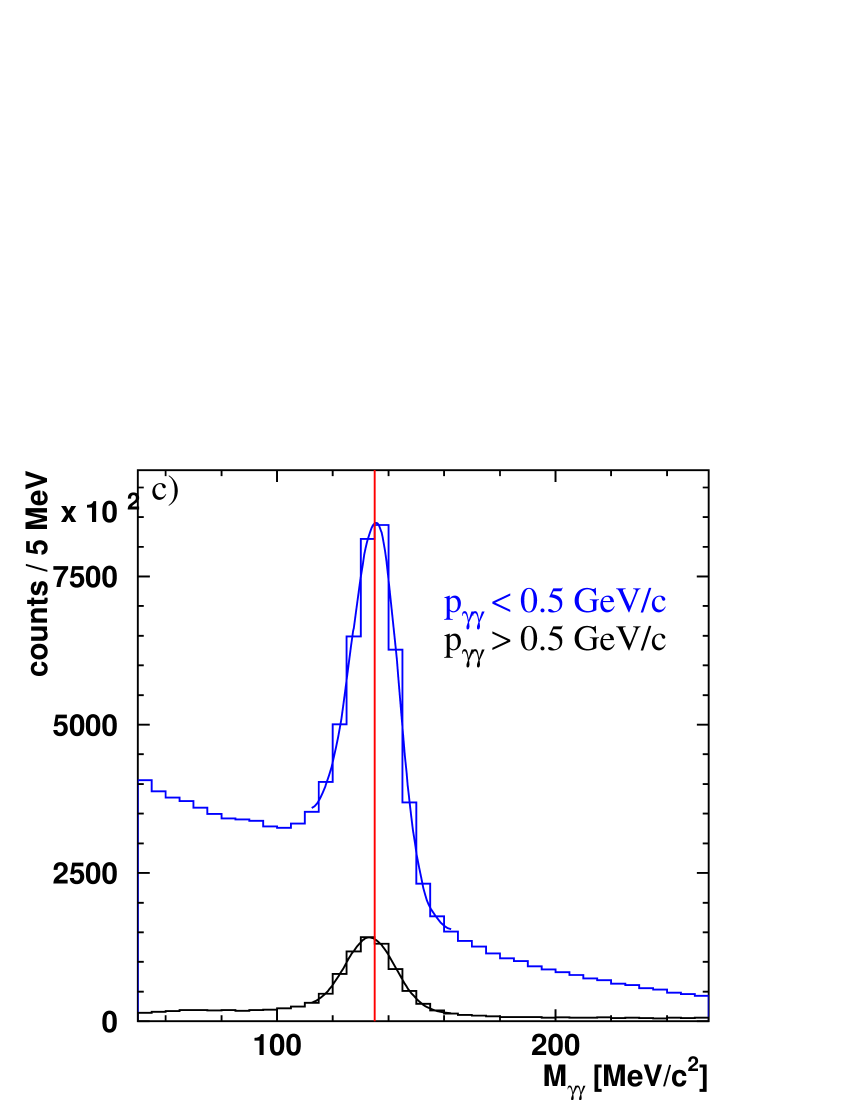
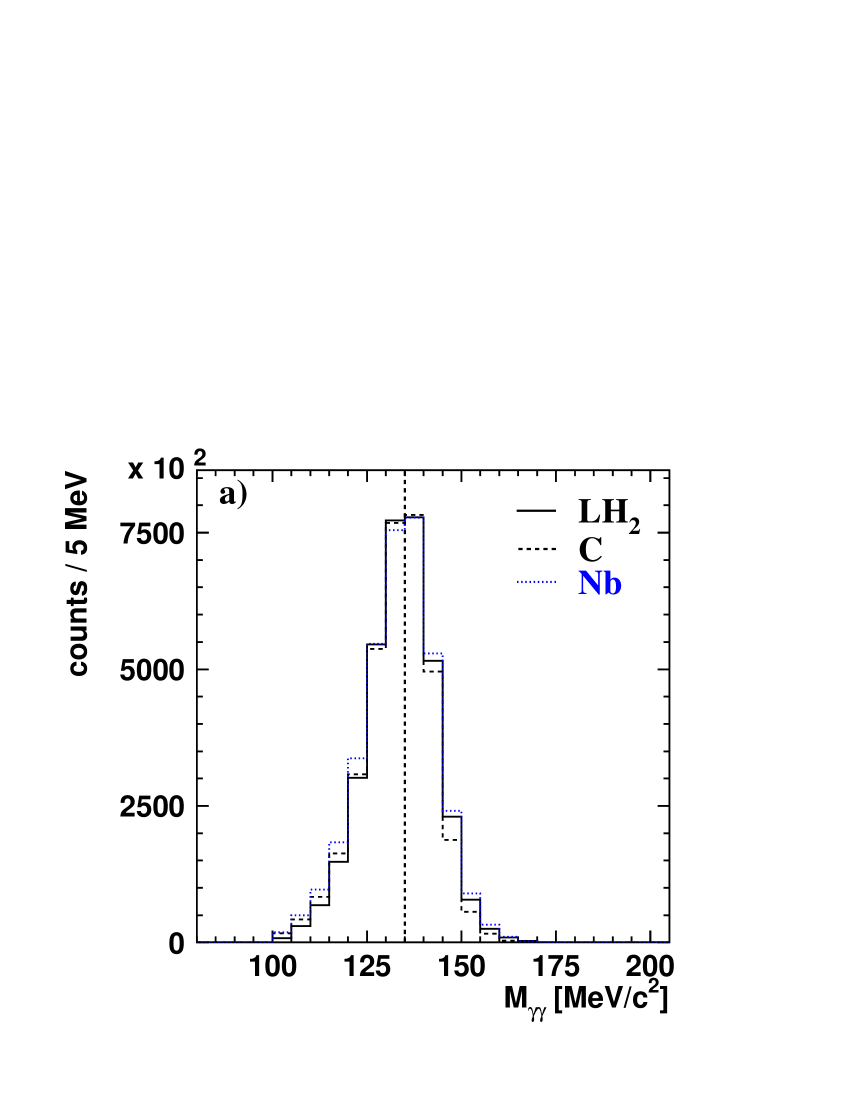
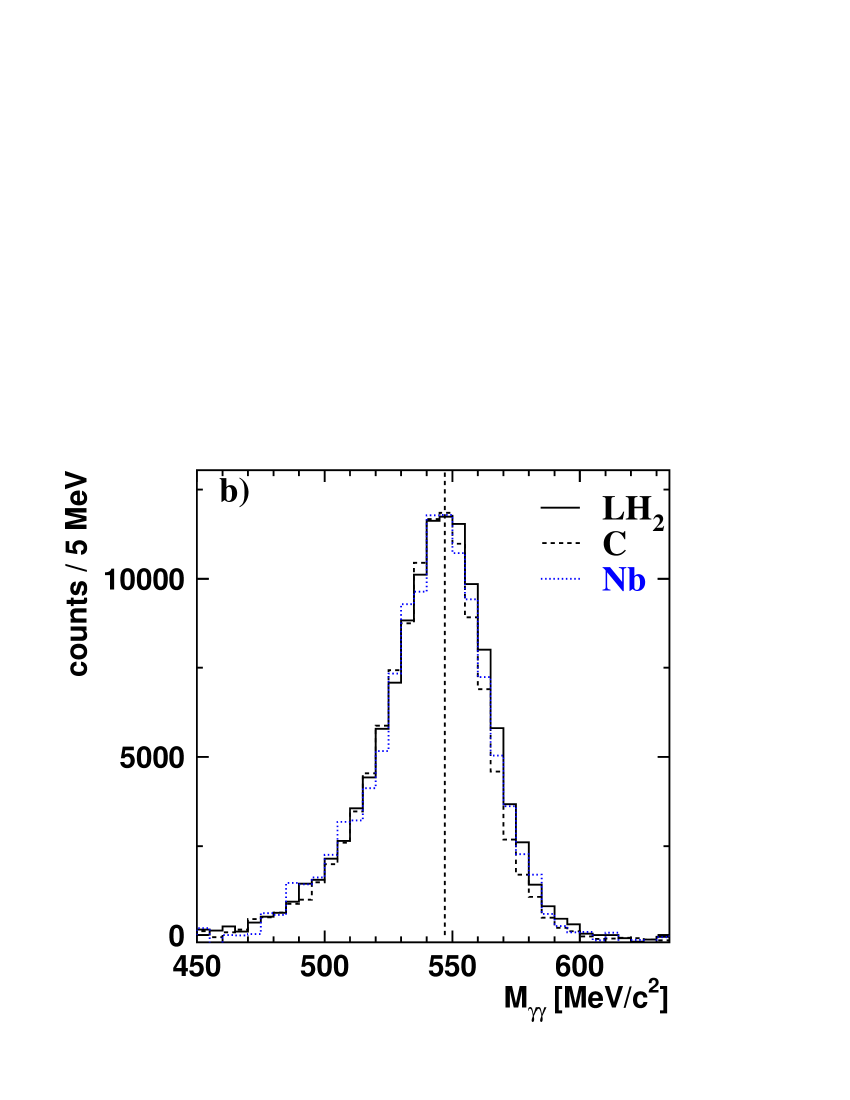
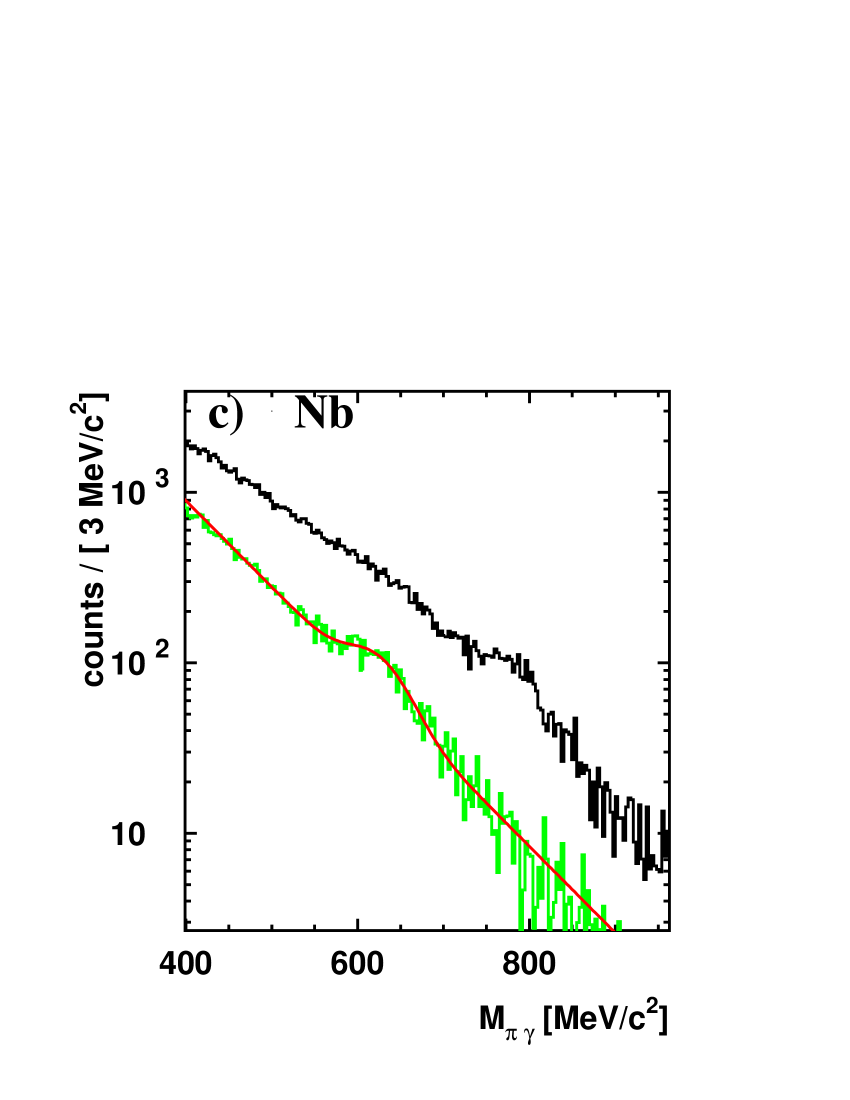
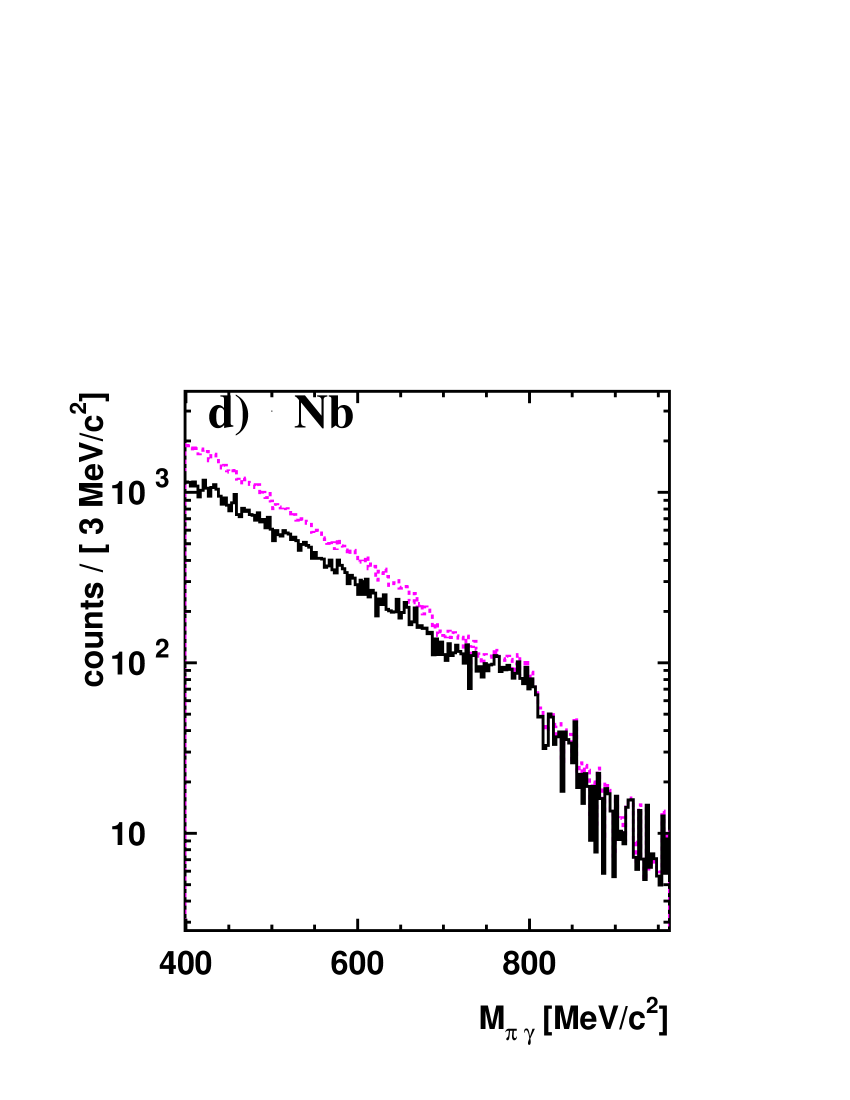
Since the experiment searches for possibly small mass shifts it is absolutely mandatory to verify the linearity, accuracy and stability of the photon energy calibration. The accurately known masses of the and meson are used as calibration fix points since the decay photons of and mesons cover the full range in energy of the decay photons. The invariant masses of the mesons were calculated from the measured 4 momenta of the decay photons. To ensure the stability of the photon energy calibration the invariant mass of - and -mesons is checked for different momentum bins. For this check a 2-dimensional plot of the () invariant mass against the momentum of the is filled (Fig. 2a) and projected onto the () invariant mass axis for different slices in the momentum of the pair. Changes in the and meson invariant mass with momentum are found to be less than 1.9 % and 1.3%, respectively (Fig. 2b). The peak position of at 135 MeV and of at 547 MeV is stable for different cuts on the momentum like 500 MeV or 500 MeV (Fig. 2c,d). In addition, it has been verified that the energy calibrations for the runs with different targets are in agreement. This is demonstrated in Fig. 3 which shows the signal line shapes for the and meson measured via their two photon decays for the and targets.
III.2 Event Selection
mesons were reconstructed in the reaction from events with 3 photons and one proton in the final
state in contrast to the analysis by D. Trnka et al. david where the
fourth particle was not further identified. In a first step only those events
were selected which had 4 hits, so called PED (particle energy deposit), in
the detector system. In order to reconstruct the reaction for
photoproduction 1 charged particle was required in coincidence with 3 neutral
hits (from the 4 PED data set) in the CB/TAPS detector system. The selection of
the charged particles was done by using either the information from the fiber
detector in the CB or the information from the plastic scintillators in front
of the TAPS detector. Requesting a charged particle in addition to 3 neutral
hits leads to a loss in statistics, but is essential for the background
determination described in section III.4.
The possible background contributions were investigated via Monte Carlo
simulations. The reactions and ,
where one of the photons in the final state escaped detection, were found to
be the dominant background sources. Furthermore the reaction where the neutron and the are
misidentified as a photon and a proton, respectively, also contribute to the
background. For the analysis which is presented here the background was
reconstructed from 5 PED events with 4 neutral and 1 charged particle (see
section III.4).
III.3 Reconstruction of the meson
III.3.1 Incident photon energy range
The analysis was performed for incident photon energies from 900 to 2200 MeV, i.e. starting about 200 MeV below the production threshold off the free nucleon =1109 MeV. The threshold for production on nuclei is given by the threshold for coherent production
| (1) |
where the recoil momentum of the produced meson is taken up by the whole nucleus. For a target Eq. 1 yields a coherent threshold energy of = 786 MeV, i.e. the threshold is even lower than 900 MeV. The choice of the incident energy interval represents a compromise between sufficiently low energies for production off a nuclear target and sufficient discrimination of background sources, which strongly increase with decreasing photon energies; e.g., the 2 channel, which is the strongest background channel, exhibits maxima in the cross section for incident photon energies near 1080 and 750 MeV.
III.3.2 Time coincidence
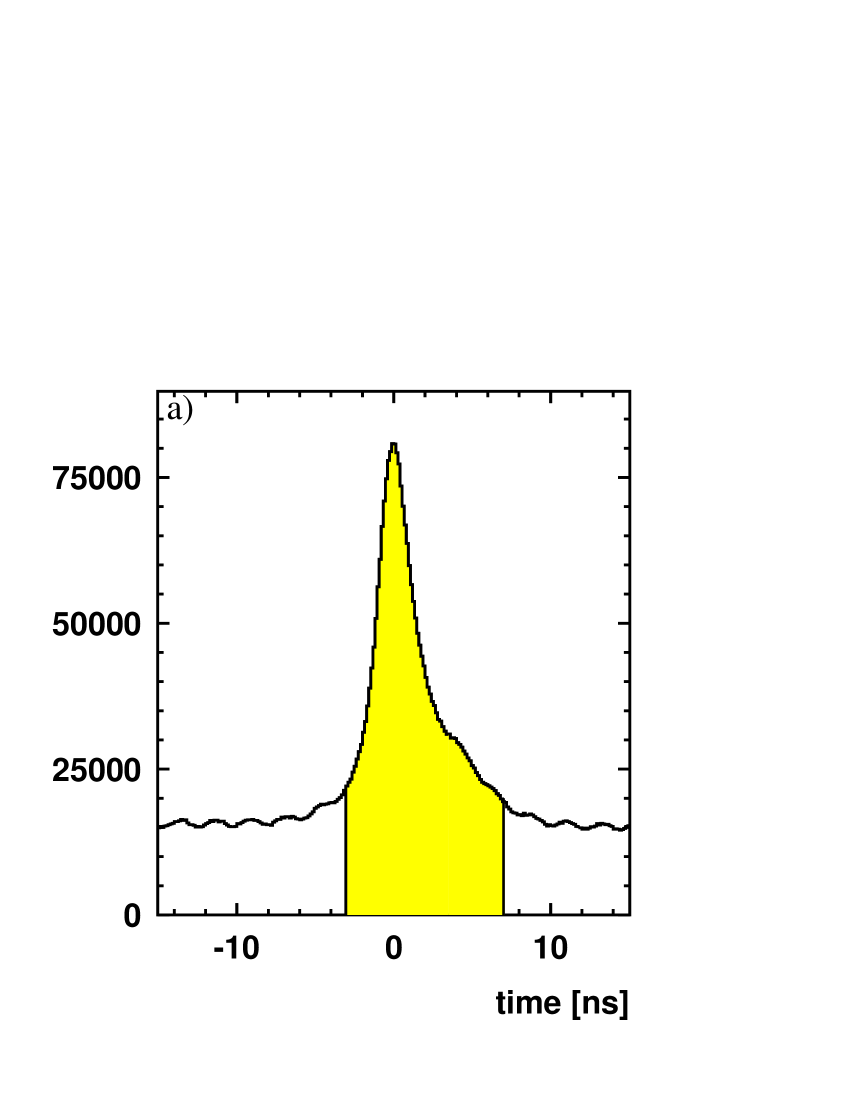
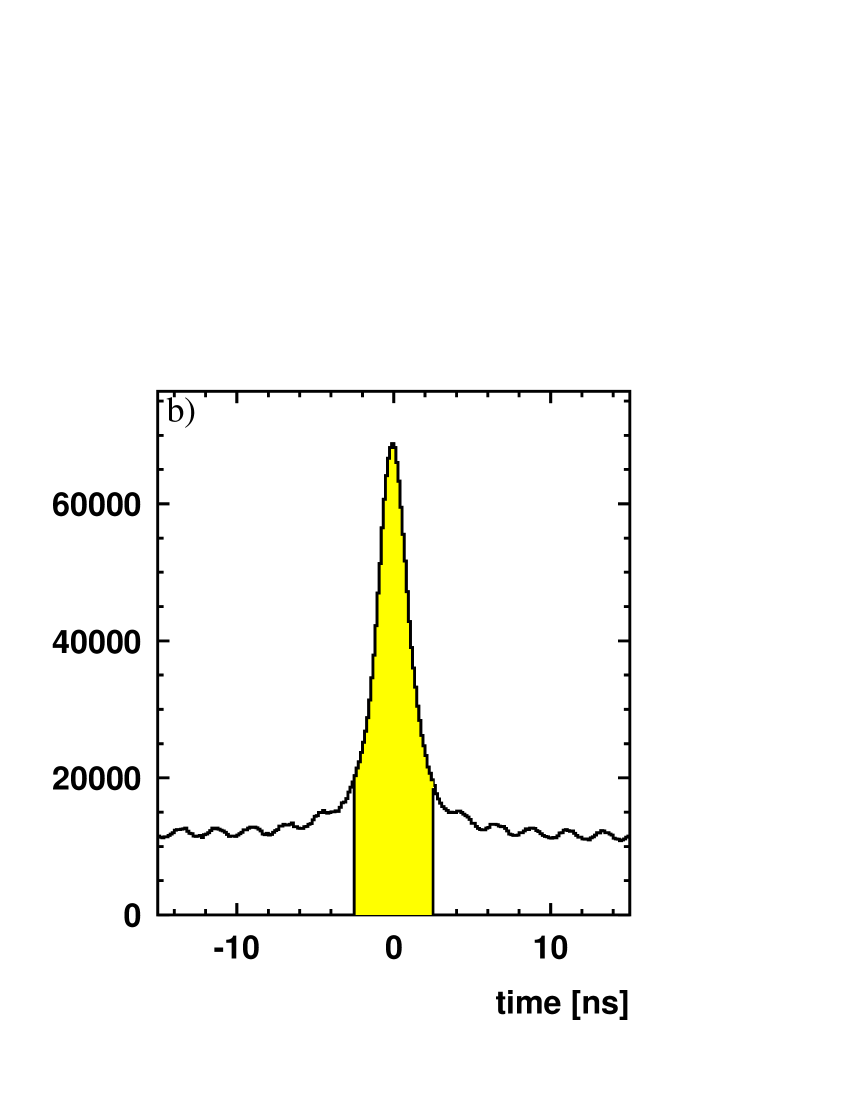
For reconstructing the reaction a prompt coincidence between a particle in TAPS and an electron in the tagger was required to eliminate time accidental background. Random time coincidences were subtracted using events outside the prompt time coincidence window. For this analysis the prompt peak was between -3 and 7 ns (Fig. 4a) and only events within the prompt peak were accepted as candidates for the reactions of interest. The asymmetric time cut allowed photons as well as nucleons to trigger the event. Photons registered in TAPS were required to be prompt within -2.5 to 2.5 ns (Fig 4b).
III.3.3 Split-off
Monte Carlo simulations have shown that there is a strong contribution to the
3 invariant mass spectrum from single photoproduction , which has a huge cross section
at energies 900-1100 MeV. Shower fluctuations may result in an additional isolated energy deposit which is then reconstructed as an additional photon. Due to this split-off of one photon cluster, 3 PED’s are registered. With a high probability this process occurs in the transition
zone between the detectors TAPS and Crystal Barrel (Fig. 1 left). The photons from
split-off events are in most cases of low energy. It is possible to suppress
such events by applying the following cuts:
1) The detectors in the TAPS to CB transition zone at angles
between 26o and 34o are excluded from the analysis, as well as the detectors
for 155o. According to simulations this leads to a 15 loss in the signal.
2) The energy threshold in each photon cluster is set to 50 MeV.
As a result of both cuts the background is reduced by 21%.
III.3.4 reconstruction
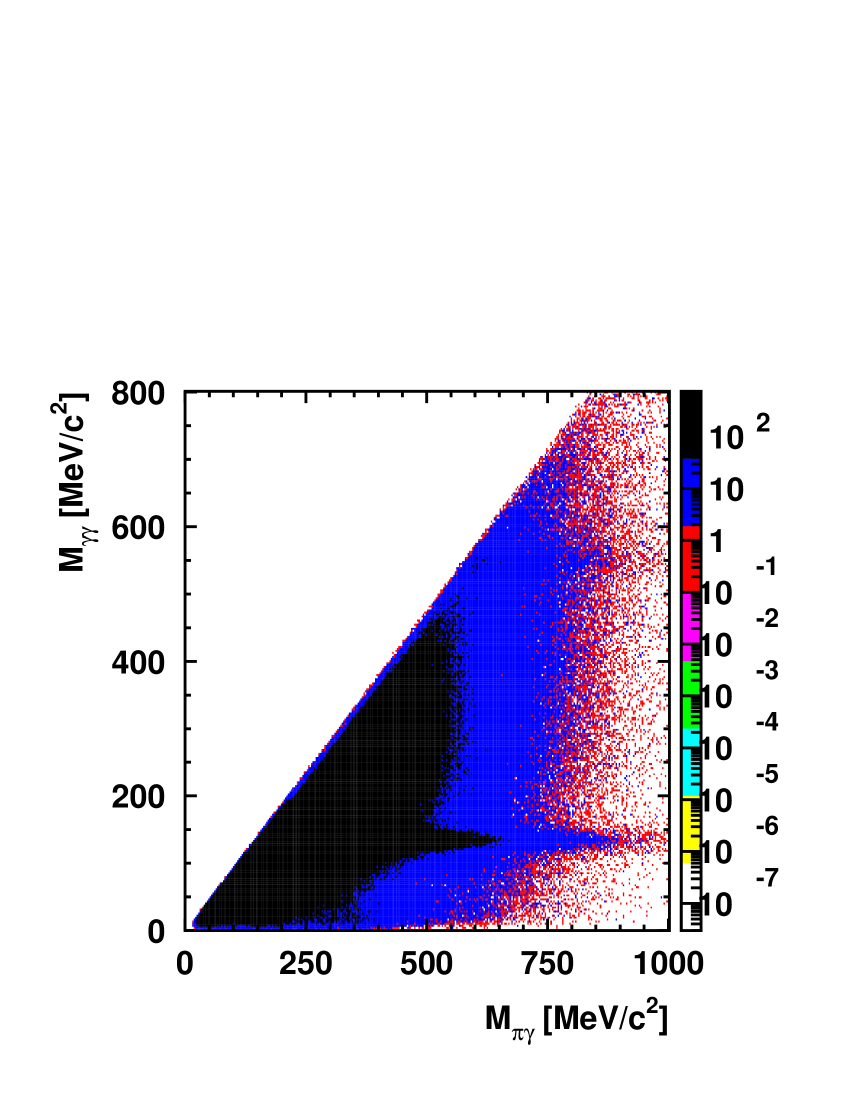
The meson was reconstructed and identified via the three photon final state invariant mass. Since the meson sequentially decays according to , the reconstructed particle can only be an meson if two of the three photons stem from a decay. According to the relation
| (2) |
the and mesons have been identified via
| (3) |
| (4) |
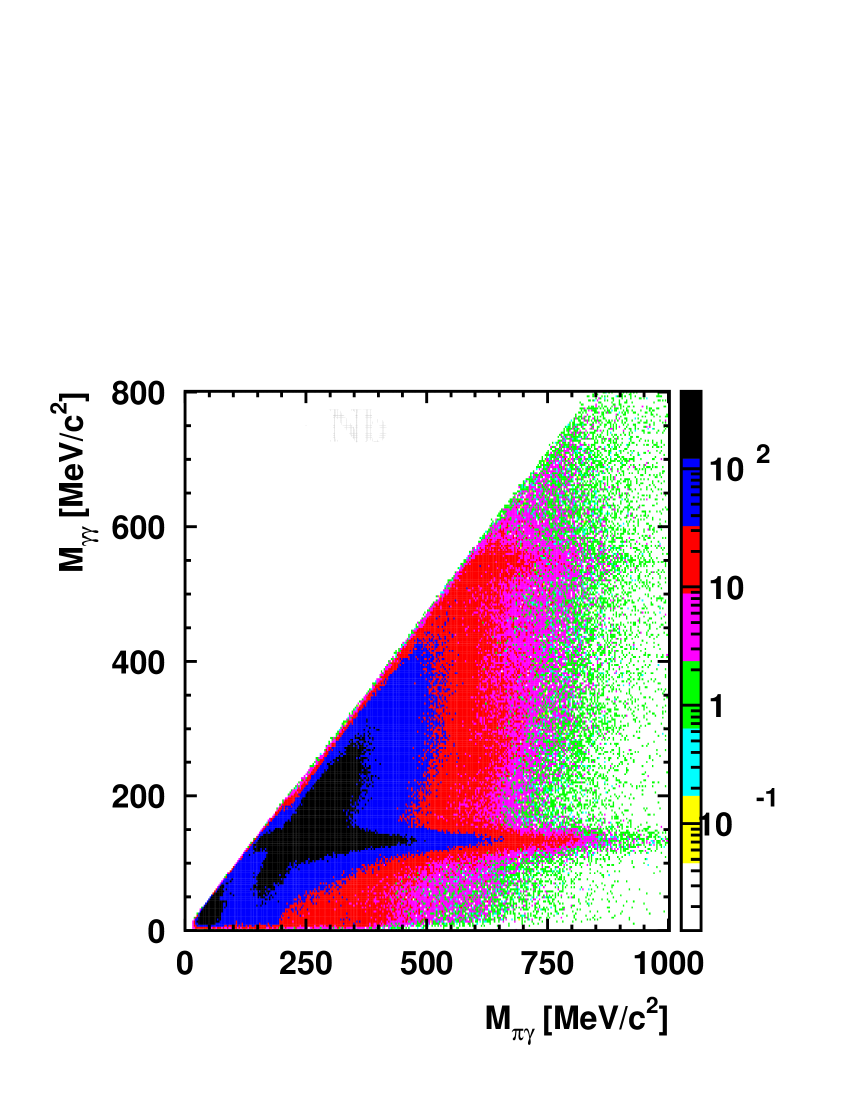
Thus in a two-dimensional plot of the two photon invariant mass (all 3 combinations) against the invariant mass, the meson should appear in this plane at the mass (2 axis) and the mass ( axis). Such a plot is shown in Fig. 5 left, where all cuts described so far have already been applied.

III.3.5 Sideband subtraction technique
As mentioned above, one of the channels which contribute to the background is
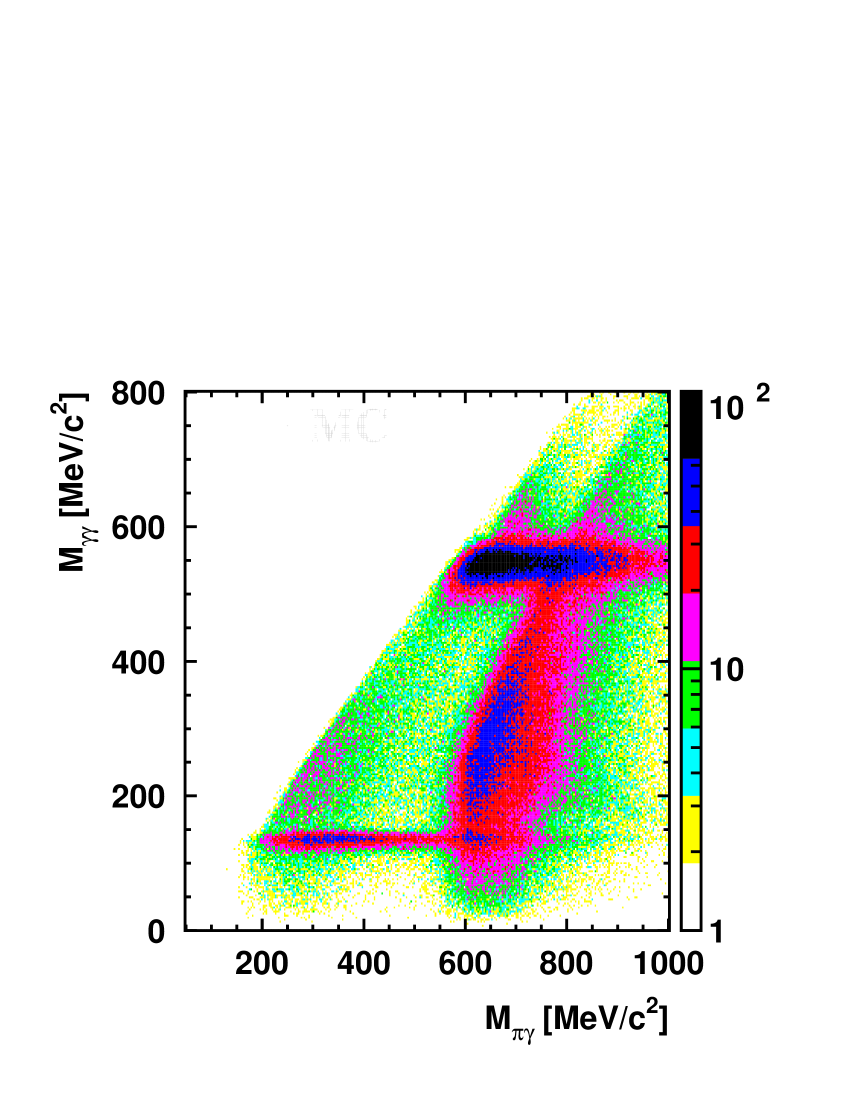
photoproduction with 4 photons in the final state when one of the photons escapes detection. In order to suppress this background in the spectrum the technique of side band subtraction was used. Monte Carlo simulations (Fig. 5 right) show that events obtained by combining 2 ’s from an decay with a coming from a decay appear as an almost vertical band around 600 MeV on the x-axis, which shows up as a bump in the M() projection.

To reduce this bump and to suppress the combinatorial background, side band subtraction has been applied. Fig. 6a shows the projection on the y-axis
M() for the mass range 570 M()
630 MeV. Projections on the x-axis M() are shown in
Fig. 6b for cuts close to the pion mass: 110 to 160 MeV and
left (75 to 100 MeV) and right(170 to 195 MeV) from the peak. The sum of
both sideband spectra (Fig. 6c) was normalized to the background counts
under the pion peak and fitted with an exponential and Gaussian function. In
the next step this curve was subtracted from the M() spectrum
over the full mass range. Fig. 6d shows the resulting
spectrum after the sideband subtraction. The bump around 600 MeV is removed from the final spectrum. The background in the spectrum for masses of
400 MeV to 700 MeV is 37% lower compared to the spectrum without sideband
subtraction, but the difference in the region of the signal from 700 MeV
to 820 MeV is only 14% (Fig. 6d). It is essential to remove this structure arising from the channel as it extends towards higher masses where it may distort the line shape.
III.3.6 Momentum cut
Only mesons decaying inside the nucleus carry information on the in-medium properties which are to be studied. To enhance the in-medium decay probability, the vector meson decay length should be comparable to nuclear dimensions. This was achieved in the analysis by applying a kinematic cut on the three momentum of the meson 500 MeV/c. But still, only a fraction of the mesons will decay inside the nucleus. Thus, one expects the invariant mass spectrum to show a superposition of decays outside of the nucleus at the vacuum mass with a peak position at 782 MeV/ and of possibly modified decays inside the nucleus johan . In addition, the most pronounced in-medium effects are expected for low meson momenta with respect to the the nuclear medium.
III.3.7 Cut on the kinetic energy of the in the final state
The disadvantage of reconstructing the meson in the decay mode is a possible rescattering of the meson which was studied in johan . The authors have demonstrated that the constraint on the pion kinetic energy 150 MeV suppresses the final state interaction down to the percent level in the invariant mass range of interest (650 MeV MeV). This result has been confirmed in transport calculations Kaskulov , Muhlich .
III.4 Background Analysis
The next main step in the analysis was the determination of the background directly from the data and its absolute normalization.
III.4.1 Background reconstruction
As mentioned before, the most probable sources of background come from the reactions and with 4 and one proton in the final state. Due to photon cluster overlap or detection inefficiencies one of the four photons may not be registered, thereby giving rise to a final state, which is exactly identical and therefore not distinguishable from the meson final state. To study this background, 5 PED events were selected with 4 neutral and 1 charged hit. One of the four neutral particles was randomly omitted and from the remaining photons a was identified and combined with the 3rd photon. The 2-dimensional plot of mass versus the invariant mass is shown in Fig. 7 (left). It is similar to the plot from the 4 PED events for the reconstruction (see Fig. 5 left). This is filled four times for all combinations with 4 photons. The side band subtraction technique was applied as described in sec. III.3.5. The applied cuts on the momentum, on the kinetic energy of the pion and on the prompt peak were the same as for the meson reconstruction The resulting spectrum is shown in Fig. 7 (right).
III.4.2 Lost photons
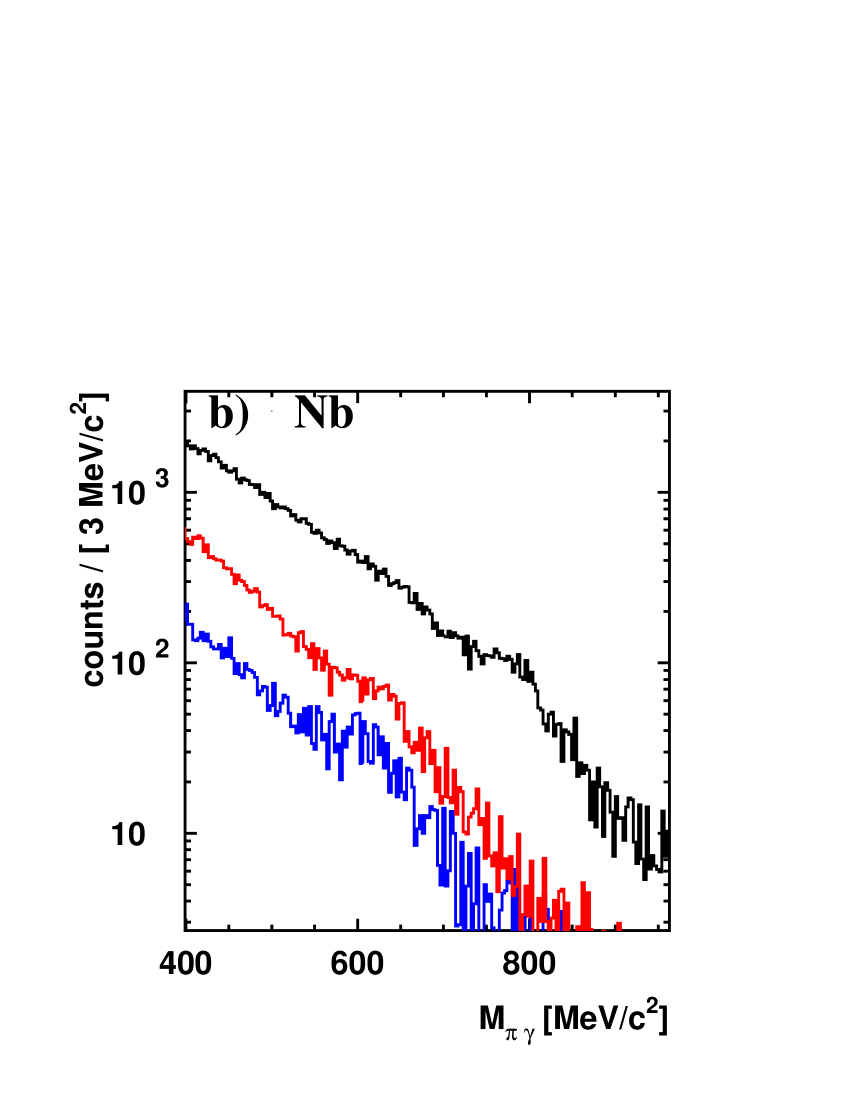
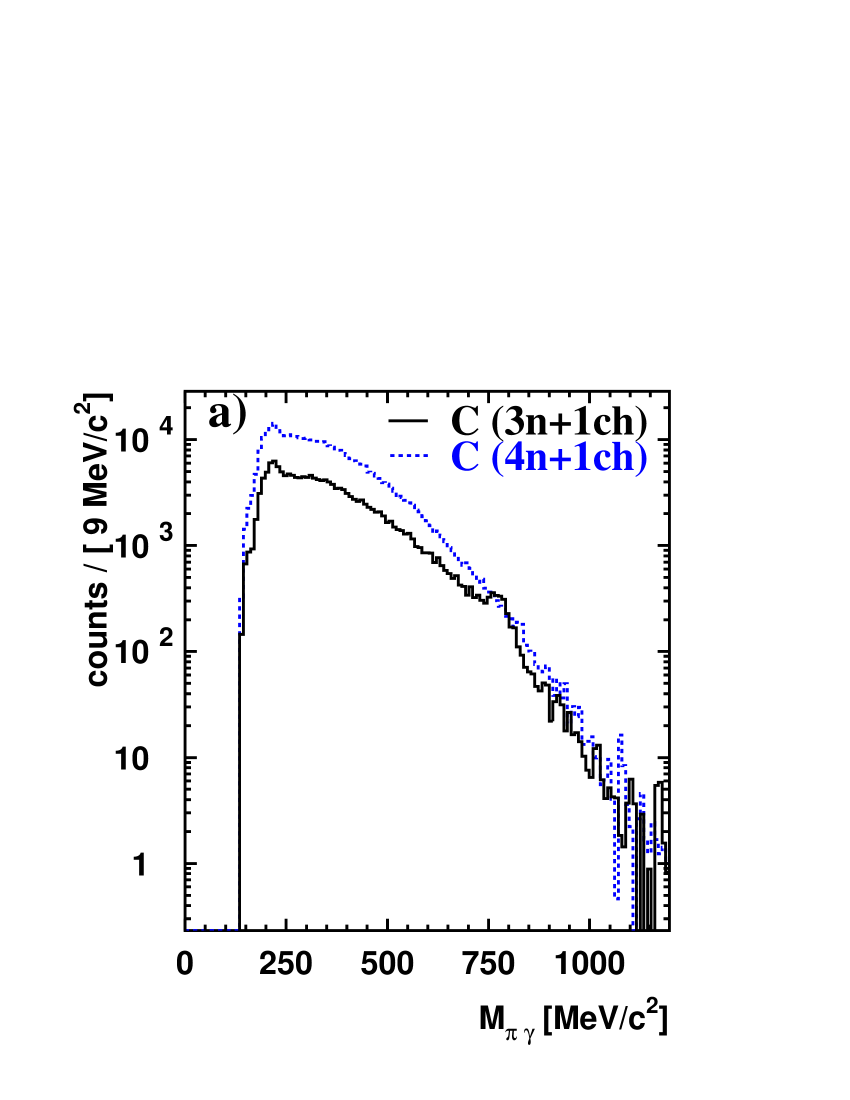
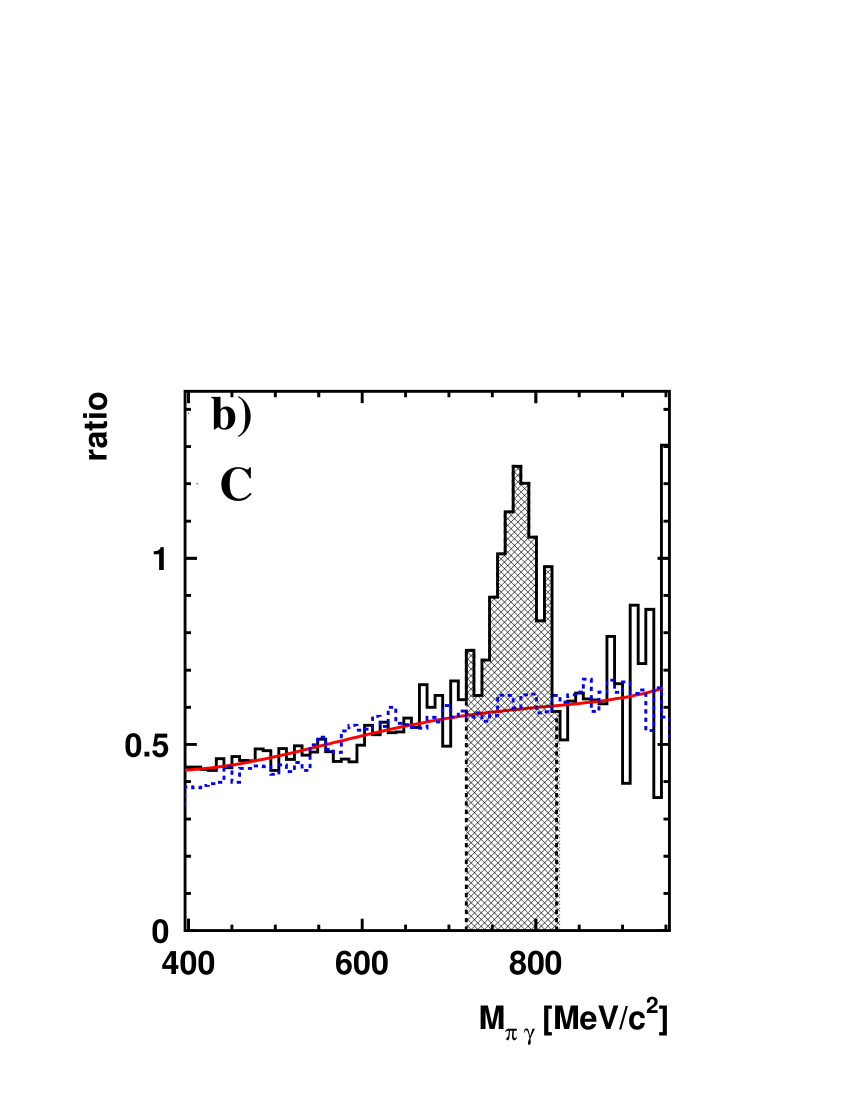
The slopes in the signal and background (BG) spectra shown in Fig. 8a are different due to the different kinematics in detecting events with 4 neutral and 1 charged particle with respect to events with 3 neutral and 1 charged hits, reflecting the energy dependence of the probability that only 3 out of 4 photons are detected. The ratio of both spectra is shown in Fig. 8b for the target. A procedure has been developed to correct the background slope in the spectrum using the data obtained on the carbon target which is such a light nucleus that strong in-medium effects are not expected. The correction function is derived by fitting the ratio of the spectra for the carbon data excluding the peak region, as it is shown in Fig. 8b. The dependence of this correction on the invariant mass is confirmed by simulations (dashed curve in Fig. 8b) studying the energy dependence of the probability to register only 3 out of 4 photons for the dominating 2 background channel. The background for from events with 4 neutral and 1 charged particles is multiplied with this correction function. As a result, the background for the data changes its slope.
III.4.3 Background normalization
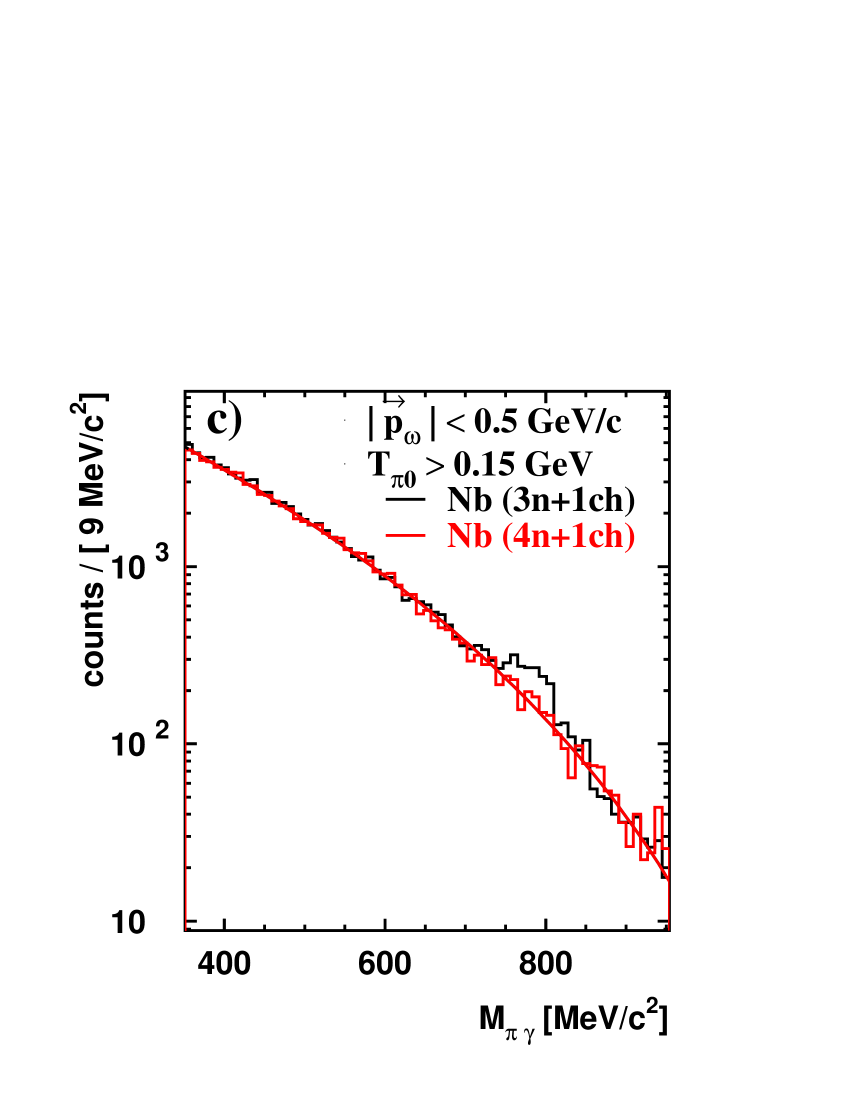
The absolute height of the background is determined by requesting the same number of counts for the signal and background spectra in the mass range from 400 to 960 MeV, excluding the counts in the peak which account for only 2% of the total yield in the given mass range. Thereby, the background level is fixed without paying any attention to the signal region. Fig. 8c shows the and the corrected and normalized background spectra. The ratio of these two spectra given in Fig. 8d demonstrates that the background in the spectrum on is properly reproduced by the background spectrum generated from the events with 4 neutral and 1 charged hits after applying the required corrections. In the invariant mass range from 400 to 700 MeV the average deviation from unity is 4. For higher invariant masses fluctuations become stronger because of the poorer statistics.


III.5 Results and Discussion
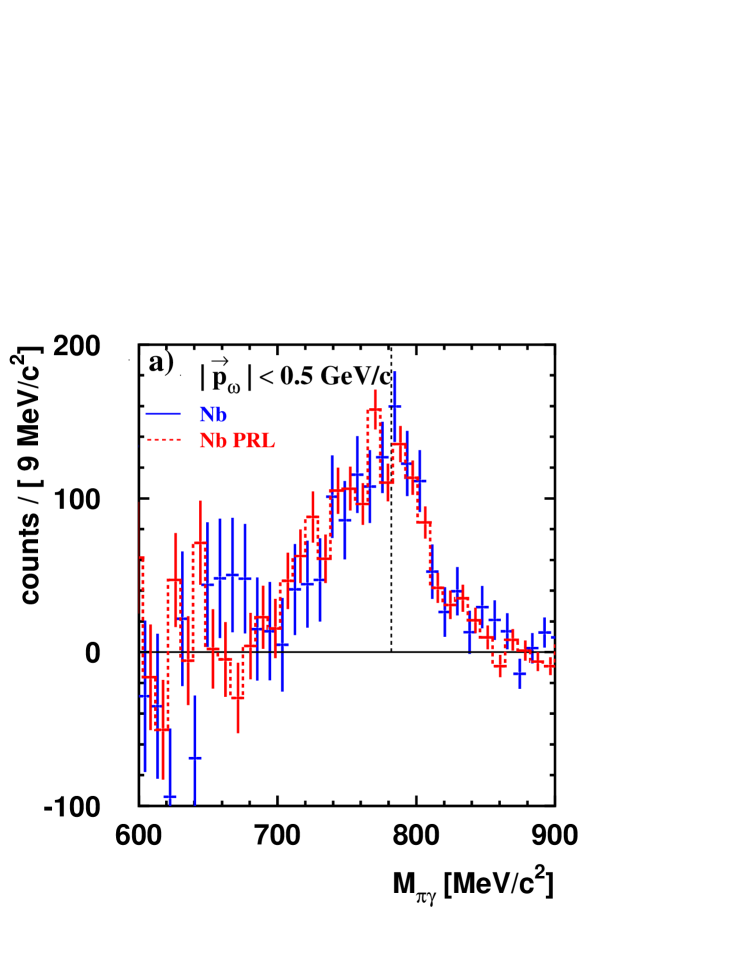
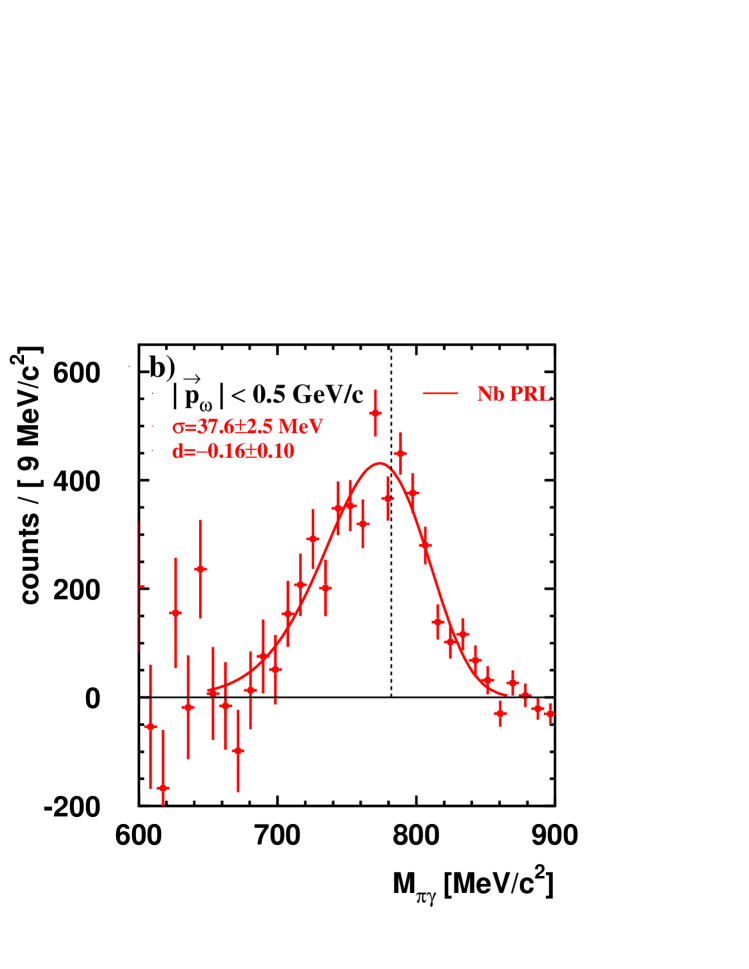
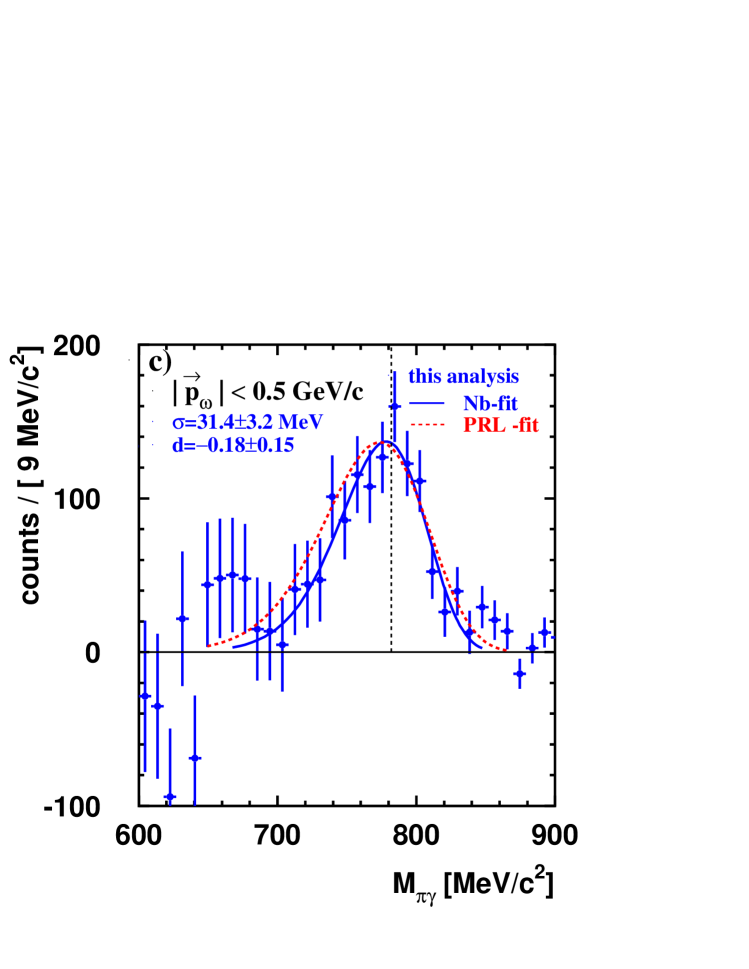
The signal shown in Fig. 9a is obtained by subtraction of the background from the signal spectrum. For comparison the line shape deduced in the previous analysis david is overlayed. Only slight differences are observed which, however, become more apparent when the signals are fitted individually, as shown in Fig. 9b,c. The following function Aubert has been used for the fits:
| (5) |
where
| (6) |
Here is the amplitude of the signal, is the peak energy, is FWHM/2.35 and is the asymmetry parameter. This function takes into account the tail in the region of lower invariant masses resulting from the energy response of the calorimeters. Fig. 9 compares the fit to the signal published in david (Fig. 9b) with the fit to the signal obtained in this work (Fig. 9c). In the re-analysis a somewhat narrower signal is observed.
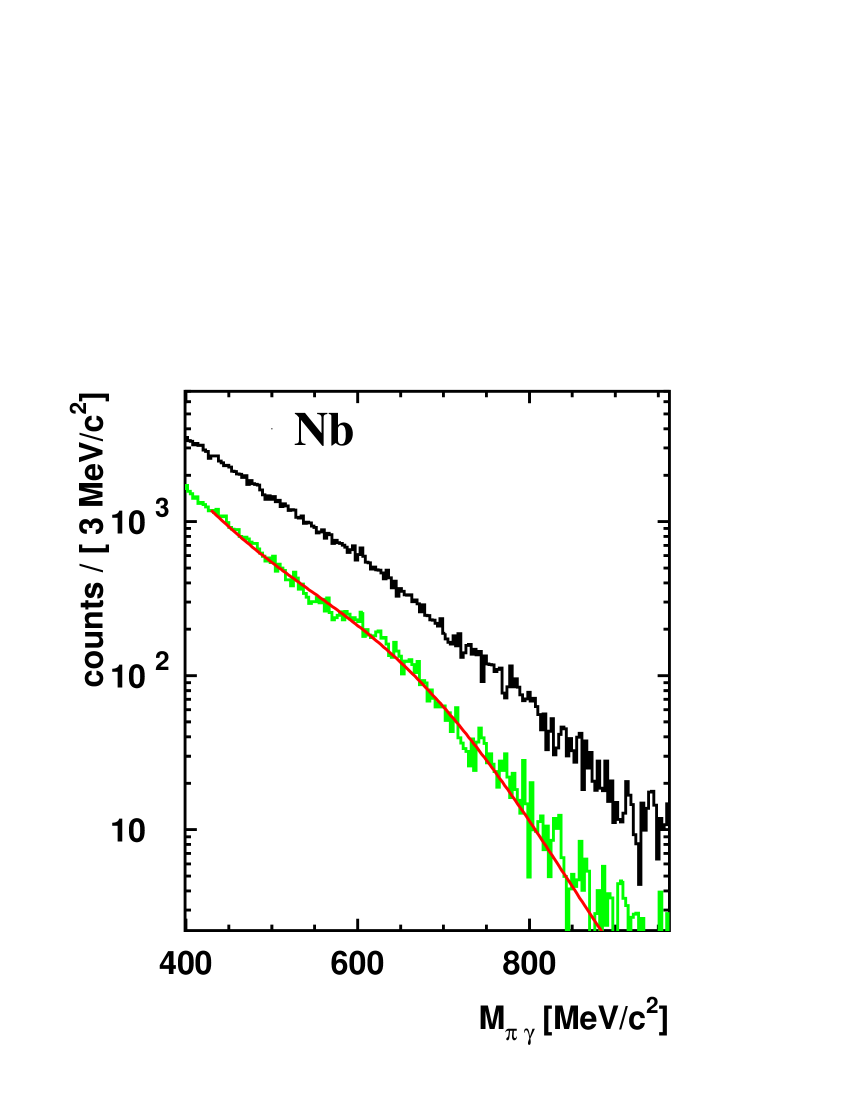
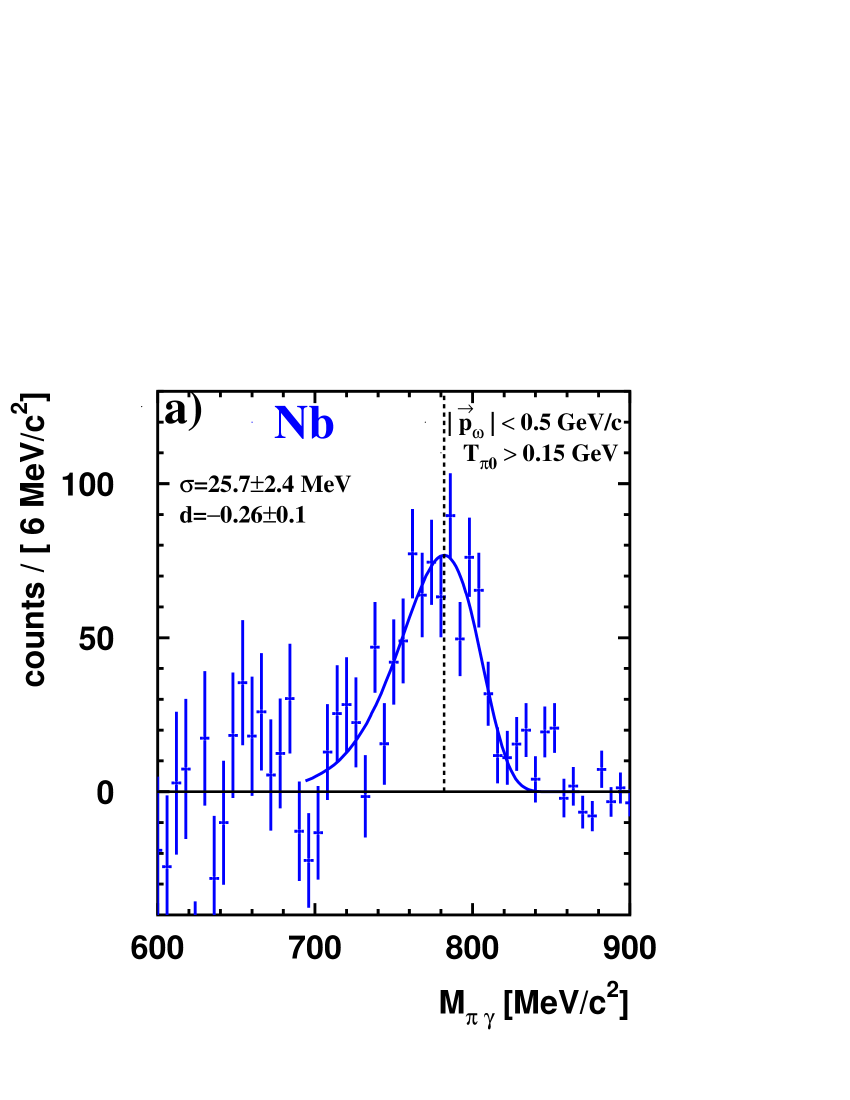
Applying in addition the cut on the kinetic energy of the meson (150 MeV)
a fit to the signal (Fig. 10a) yields a width parameter
=25.7 2.4 MeV which is consistent within
errors with the and MC signals (Fig. 10b,c) which serve as a reference. The deviation from the reference signals claimed in david and interpreted as evidence
for an in-medium mass shift of the meson is thus not confirmed in the
re-analyis of the data described in this paper. The current analysis does not
yield any evidence for an in-medium lowering of the mass. This does
not necessarily mean that there is no mass shift because the line
shape may be insensitive to in-medium modifications as pointed out in Kaskulov .
This problem is illustrated in Fig. 11 which
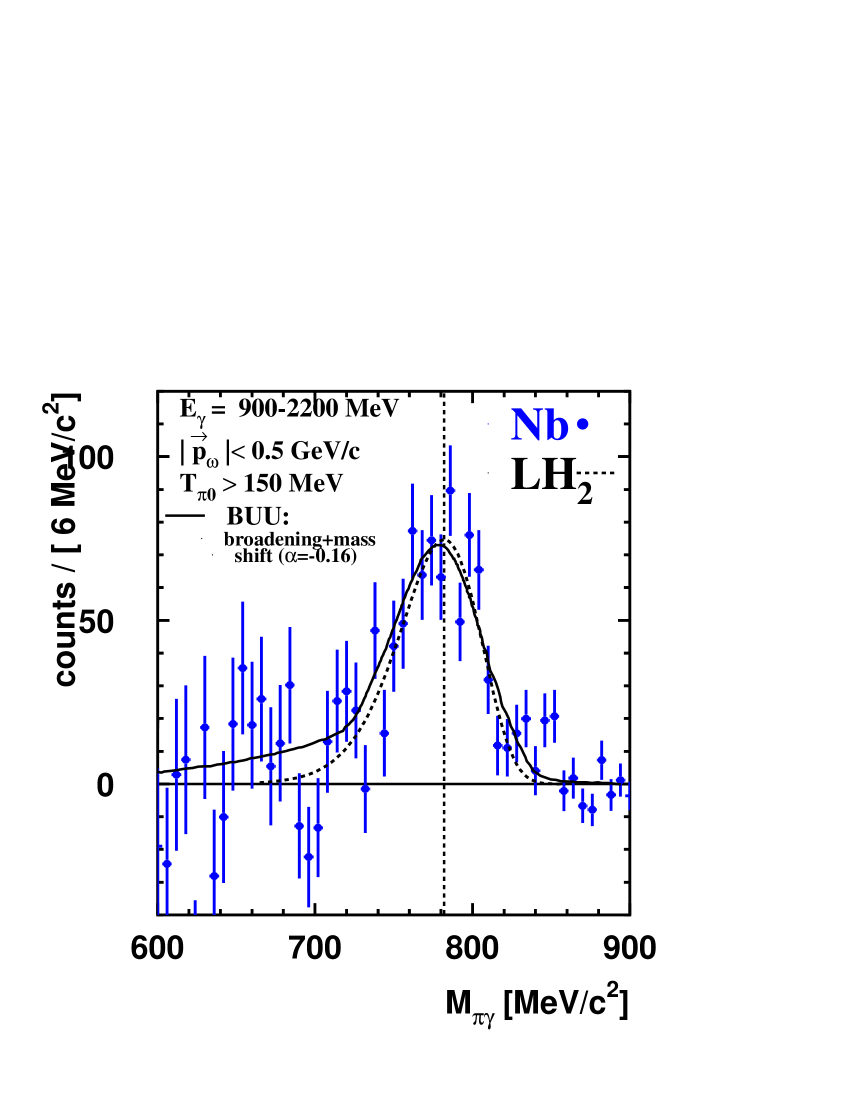
compares the line shape of the present analysis to the line shape for the target as well as to a prediction of the line shape in a GiBUU transport model calculation. In this calculation an in-medium pole mass shift according to
| (7) |
has been assumed. Here, is the nuclear density at the decay point of
the meson and is the normal nuclear matter density. The fact
that the experimental signal is consistent with both scenarios indicates that
the line shape is indeed insensitive to in-medium modifications for the
given invariant mass resolution and statistics.
This insensitivity is first of all due to the relatively long lifetime of the meson. Even requiring the recoil momentum to be lower than 500 MeV/c, only about 20% of all decays in occur at densities for the given reaction kinematics according to BUU simulations Muehlich_PhD . In addition, due to inelastic processes like , the mesons are removed in the nuclear medium thereby reducing their effective lifetime and correspondingly increasing their width. If this broadening is very large as observed for the meson Kotulla the strength of the in-medium signal is spread out in mass so strongly that it becomes hard to distinguish it from the background.
This argument can also be formulated more rigorously as discussed in Lehr ; LMM . Any mass distribution measurement of a vector meson from its decay into particles does not give the hadronic spectral function of the meson directly but folded with the branching ratio into the specific final channel one is investigating eichstaedt
| (8) |
Since the branching ratio may depend on the mass the unfolding is not trivial. Integrating Eq. 8 over all nucleons and parameterizing the spectral function by a Breit-Wigner function, the result involves the term
| (9) |
Here is the total width of the meson , obtained as a sum of the vacuum decay width, , and an in-medium contribution :
| (10) |
with
| (11) |
in the low density approximation. Due to the second factor in Eq. 9 the meson decay into the channel of interest will decrease for a strong broadening of the meson in the nuclear medium. Furthermore, according to the first factor in Eq. 9 this reduced yield is spread out over a broader mass range, making it much more difficult to separate the in-medium decay contribution from the background. Moreover, since for the second factor in Eq. 9 becomes proportional to , leading to a suppression of contributions from higher densities. The sensitivity of meson production in an elementary reaction is thereby shifted to the nuclear surface. In case of a strong in-medium broadening of a meson it is thus in principle difficult
to detect in-medium modifications by an analysis of the signal shape. As a consequence the
experiment becomes less sensitive to a possible mass shift. Requesting a
proton in coincidence with 3 photons does not shift the sensitivity to even
smaller densities. According to GiBUU simulations the fraction of decays at densities larger than is
thereby changed only by less than 2% for the kinematic conditions of the
current analysis Friedrich .
It should be pointed out, however, that a significant effect close to the
production threshold of the meson, =1109 MeV, was
nevertheless predicted by the Gi-BUU model gallmeister . A data
analysis confined to this energy regime is under way and will be published separately.
IV Summary and Conclusions
Data on the photoproduction of mesons on and have
been re-analyzed, applying an improved background determination and
subtraction method. An earlier claim of an in-medium lowering of the
mass is not confirmed. The strong broadening of the meson in the
nuclear medium due to inelastic processes - as determined in a transparency
ratio measurement - suppresses contributions to the observed signal
from the interior of the nucleus. The branching ratio for in-medium decays
into the channel of interest is drastically reduced. Thereby, the sensitivity
is shifted to the nuclear surface, making the line shape analysis less
sensitive to a direct observation of in-medium modifications. Data with much
higher statistics will be needed to gain further insight. A corresponding
experiment has been performed at the MAMI C electron accelerator using the
Crystal Ball/TAPS detector setup. The analysis is ongoing.
Acknowledgements.
We thank the scientific and technical staff at ELSA and the collaborating institutions for their important contribution to the success of the experiment. We acknowledge detailed discussions with M. Kaskulov, U. Mosel, P. Mühlich, E. Oset and J. Weil. This work was supported financially by the Deutsche Forschungs Gemeinschaft through SFB/TR16. The Basel group acknowledges support from the Schweizerischer Nationalfond and the KVI group from the Stichting voor Fundamenteel Onderzoek der Materie (FOM) and the Nederlandse Organisatie voor Wetenschappelijk Onderzoek (NWO).References
- (1) D. Trnka et al., Phys. Rev. Lett. 94, 192303 (2005)
- (2) D. J. Gross, Proc. Nat. Acad. Sci. 102, 9099 (2005)
- (3) H. D. Politzer, Proc. Nat. Acad. Sci. 102, 7789 (2005)
- (4) F. Wilczek, Proc. Nat. Acad. Sci. 102, 8403 (2005)
- (5) S. Dürr et al., Science 322, 1224 (2008)
- (6) R. Rapp, J. Wambach, and H. van Hees, arXiv:0901.3289, Landolt-Börnstein New Series I-23/A(2009)
- (7) R. Hayano and T. Hatsuda, arXiv:0812.1702(2009)
- (8) S. Leupold, V. Metag, and U. Mosel, arXiv: 0907.2388, Int. J. Mod. Phys. E 19, 147 (2010)
- (9) M. Naruki et al., Phys. Rev. Lett. 96, 092301 (2006)
- (10) R. Arnaldi et al., Eur. Phys. J. C. 49, 235 (2007)
- (11) M. Kotulla et al., Phys. Rev. Lett. 100, 192302 (2008)
- (12) T. Ishikawa et al., Phys. Lett. B 608, 215 (2005)
- (13) M. Kaskulov, E. Hernandez, and E. Oset, Eur. Phys. J. A 31, 245 (2007)
- (14) E. Aker et al., Nucl. Instr. and Methods A 321, 69 (1992)
- (15) R. Novotny et al., IEEE Trans. Nucl. Sci. 38, 392 (1991)
- (16) A. R. Gabler et al., Nucl. Instr. and Meth. A 346, 168 (1994)
- (17) D. Husmann and W. J. Schwille, Phys. Bl. 44, 40 (1988)
- (18) W. Hillert, Eur. Phys. J. A 28, 139 (2006)
- (19) D. Elsner et al., Eur. Phys. J. A 33, 147 (2007)
- (20) G. Suft et al., Nucl. Instr. Meth., A 538, 416 (2005)
- (21) J. G. Messchendorp et al., Eur. Phys. J. A 11, 95 (2001)
- (22) P. Mühlich, T. Falter, and U. Mosel, Eur. Phys. J. A 20, 499 (2004)
- (23) B. Aubert et al., Phys. Rev. D 70, 112006 (2004)
- (24) P. Mühlich, PhD thesis, Univ. of Giessen(2006)
- (25) J. Lehr and U. Mosel, Phys. Rev. C. 64, 042202 (2001)
- (26) F. Eichstädt et al., Prog. Theo. Phys. Suppl. 168, 495 (2007)
- (27) S. Friedrich, University of Giessen, priv.com., http://gibuu.physik.uni giessen.de(2010)
- (28) K. Gallmeister, M. Kaskulov, U. Mosel, and P. Mühlich, Prog. Part. Nucl. Phys. 61, 283 (2008)