The Properties of X-ray Luminous Young Stellar Objects in the NGC 1333 and Serpens Embedded Clusters.
Abstract
We present new Chandra X-ray data of the NGC 1333 embedded cluster and combine these data with existing Chandra data, Sptizer photometry and ground based spectroscopy of both the NGC 1333 and Serpens Cloud Core clusters to perform a detailed study of the X-ray properties of two of the nearest embedded clusters to the Sun.
We first present new, deeper observations of NGC 1333 with Chandra ACIS-I and combine these with existing Spitzer observations of the region. In NGC 1333, a total of 95 cluster members are detected in X-rays, of which 54 were previously identified in the Spitzer data. Of the Spitzer identified sources, we detected 23% of the Class I protostars, 53% of the Flat Spectrum sources, 52% of the Class II, and 50% of the Transition Disk young stellar objects (YSO). Forty-one Class III members of the cluster are identified, bringing the total identified YSO population to 178.
The X-ray Luminosity Functions (XLFs) of the NGC 1333 and Serpens clusters are compared to each other and the Orion Nebula Cluster. Based on a comparison of the XLFs of the Serpens and NGC 1333 clusters to the previously published ONC, we obtain a new distance for the Serpens cluster of pc.
Using our previously published spectral types, effective temperatures and bolometric luminosities, we analyze the dependence of the X-ray emission on the measured stellar properties. The X-ray luminosity was found to depend on the calculated bolometric luminosity as in previous studies of other clusters. We examine the dependence of on stellar surface area and effective temperature, and find that depends primarily on the stellar surface area. In the NGC 1333 cluster, the Class III sources have a somewhat higher X-ray luminosity for a given surface area. We also find evidence in NGC 1333 for a jump in the X-ray luminosity between spectral types of M0 and K7, we speculate that this may result from the presence of radiative zones in the K-stars.
The gas column density vs. extinction in the NGC 1333 parental molecular cloud was examined using the Hydrogen column density determined from the X-ray absorption to the embedded stars and the -band extinction measured to those stars. In NGC 1333, we find , this is lower than expected of the standard ISM but similar to that found previously in the Serpens Cloud Core.
1 Introduction
In recent years many studies of young stellar clusters have been undertaken to investigate the emission properties of pre-main sequence stars and protostars in the higher energy X-ray regime (Wolk et al., 2006; Getman et al., 2005; Preibisch & Feigelson, 2005). These studies compliment those carried out in the mid-IR, where young stars are identified by the excess emission produced through the reprocessing of stellar radiation by circumstellar material. Optical and near-IR spectroscopic observations of the young stars in these regions add information on the fundamental properties of the stars, such as effective temperature and luminosity.
Young stellar objects (YSOs) often possess levels of X-ray emission elevated to , this elevated emission can be used to distinguish them from field stars (Feigelson & Montmerle, 1999; Feigelson & Kriss, 1981). In developed, hydrogen burning stars, X-ray activity arises from magnetic fields generated as a result of shear between the core radiative zone and the outer convective zone. The process behind the generation of the highly increased levels of emission in young stellar objects remains uncertain since low mass pre-main sequence stars are often fully convective. Some suggested causes are magnetic disk-locking between the star and disk (Hayashi et al., 1996; Isobe et al., 2003; Romanov et al., 2004), accretion onto the star (Kastner et al., 2002; Favata et al., 2003, 2005), and alternative dynamo models for coronal emission (Küker & Rüdiger, 1999; Giampapa et al., 1996).
We present a study of X-ray emitting young stars in the Serpens and NGC 1333 clusters. These two clusters are examples of nearby (0.5 kpc), low mass regions with high fractions of protostars yet different spatial geometries and frequencies of jets. Both are deeply embedded in their natal clouds. Serpens is the more deeply embedded with extinctions exceeding 40 magnitudes in the visual. IR and submm observations identify at least 38 protostars in the central core region, and more than 130 embedded young stars in total (Testi et al., 1998, 2000; Davis et al., 1999; Hogerheijde et al., 1999; Winston et al., 2007). An age of 2 Myrs has been found for the cluster (Kaas et al., 2004; Winston et al., 2009), with some evidence for a halo of older sources surrounding the central core (see Winston et al., 2009, for a discussion of the possible age spread.) The Chandra X-ray observations of Serpens have previously been reported by Giardino et al. (2007) and Winston et al. (2007). NGC 1333 contains a high number of embedded protostars, cores and outflows (Knee & Sandell, 2000), and while showing a spread in isochronal ages was found to have a median age of 2 Myrs (Winston et al., 2009). The region has previously been observed in X-rays with ROSAT by Preibisch (1997) who identify 16 YSOs. A study by Getman et al. (2002) with Chandra associated 95 detections with cluster members and found no difference in X-ray luminosity between Classical T-Tauri stars (CTTS) and weak line T-Tauri stars (WTTS). Preibisch (2003) observed NGC 1333 using XMM, detecting 86 sources in the region. Optical and IR surveys to identify the YSOs in the region have been carried out by Aspin et al. (1994), Wilking et al. (2004), Lada et al. (1996), Gutermuth et al. (2008b) and Gutermuth et al. (2009). Over 160 young stars have been identified in the cluster. NGC 1333 does not appear to be centrally condensed though the protostars are observed to trace the underlying gas distribution, whereas the Serpens protostars are located along a filament in the centre of the cluster.
There are four main results in this paper. First, we utilise the elevated X-ray luminosity to identify YSOs in the NGC 1333 region that do not exhibit IR-emission from a dusty disk (evolutionary Class III) and would otherwise be indistinguishable from field stars using Spitzer photometry. Protostars (Class 0/I and Flat Spectrum) and pre-main sequence stars with disks (Class II and Transition Disks) may also show elevated X-ray emission and we identify such objects with detectable X-ray emission.
Second, we use the X-ray data to redetermine the distance to the Serpens cluster. One of the more elusive properties of Young Stellar Clusters (YSCs) is an accurate measure of their distances. The distance underpins luminosity calculations, and therefore the determination of the stellar isochronal ages and masses. The distance to NGC 1333 has recently been measured based on a VERA measurement of maser parallax toward SVS 13 to be at 240 pc, and this is the distance used in this study (Hirota et al., 2008). A method for determining the distance to YSCs based on the comparison of the X-ray luminosity function (XLF) to a ’universal’ XLF (Feigelson et al., 2005) is applied to the Serpens data to obtain a more accurate distance to the cluster. The most commonly adopted distance to the Serpens Cloud is 260 pc based on an extinction versus distance diagram to 450 stars using Vilnius seven-color photometry (a discussion of the distance is given in Straiz̆ys et al., 2003). Other estimates have ranged from 700 pc (Zhang et al., 1988) to 440 pc (Racine, 1968; Strom et al., 1974) and 310 pc (de Lara et al., 1991). Here we will attempt to judge the distance via a technique applied to the YSOs in the cluster themselves.
In the third section, we present a detailed study of the combined spectral and X-ray properties of the populations of YSOs as a function of their evolutionary class in the Serpens and NGC 1333 clusters, identified by observations with Spitzer and Chandra and published by Gutermuth et al. (2008a) and Winston et al. (2007, 2009). Chandra has recently examined the X-ray properties of the Orion Nebula Cluster (ONC), in a project known as the Chandra Orion Ultra-Deep Project (COUP). Although the Serpens and NGC 1333 samples are much smaller than the COUP survey, the analysis of these two smaller clusters has the advantage of excellent 3.6-24 photometry; observations longward of 4.5 are difficult in the centre of the ONC due to the bright infrared emission from the molecular cloud. This photometry allows us to accurately ascertain the evolutionary class of each object, and study the dependence of the X-ray properties on evolutionary state. Further, optical and infrared spectroscopy has been obtained and used to determine the effective temperatures, bolometric luminosities, and stellar surface areas of a number of the YSOs. With these data, we can examine the X-ray flux to bolometric luminosity by evolutionary class, and examine the dependance on surface area and effective temperature in these two clusters.
Finally, we derive the relationship between Hydrogen column density derived from X-ray data and near-infrared extinction. Consistent with our preliminary work, we find that in these molecular clouds, the hydrogen column density per magnitude of K-band extinction is 1/3 that in the diffuse ISM. This may be the result of grain growth and coagulation in cold, dense molecular clouds.
2 Observations and Data Reduction
2.1 Spitzer & 2MASS IR Photometry
We have obtained Spitzer images of the Serpens and NGC 1333 regions in six wavelength bands: the 3.6, 4.5, 5.8 and 8.0 m bands of the Infrared Array Camera (IRAC; Fazio et al. (2004)) and the 24 m and 70 m bands of the Multi-band Imaging Photometer for Spitzer (MIPS; Rieke et al. (2004)). The photometry extracted from these data was supplemented by , and -band photometry from the 2MASS point source catalogue (Skrutskie et al., 2006), resulting in data in nine photometric bands spanning 1-70 m. The observations, image reduction and photometry for the Spitzer data have previously been presented by Winston et al. (2007) and Gutermuth et al. (2008b). In Serpens, Winston et al. (2007) identified 117 YSOs with IR-excesses: 22 Class 0/I objects, 16 Flat Spectrum, 62 Class II and 17 Transition Disks (see Winston et al., 2009, on contamination of Transition Disk objects by AGB stars.) In comparison, Gutermuth et al. (2008b) identified 137 YSOs in NGC 1333: 11 candidate Class 0, 26 Class I, 16 Flat Spectrum, 80 Class II and 4 Transition Disks (note that the Flat Spectrum classification was applied to the NGC 1333 catalog by Winston et al., 2009).
2.2 Chandra Data Reduction
The X-ray data were taken from the ANCHORS (AN archive of CHandra Observations of Regions of Star formation111http://cxc.harvard.edu/ANCHORS/) archive. The Serpens cluster was observed on June 19th 2004, OBSID 4479, with a 88.45 ks exposure time, the field centered on the coordinates: . The Serpens observations have been previously published in Giardino et al. (2007) and Winston et al. (2007). The NGC 1333 data is newly published here, hence we describe the reduction of the NGC 1333 data in detail. NGC 1333 was observed in three epochs: OBSID 6436, a 36.95 ks exposure on July 5th 2006, OBSID 6437, a 40.12 ks exposure on July 11th, 2006, and OBSID 642, a 43.91 ks exposure on July 12th 2000, giving a total exposure time of 120.98 ks. The 2006 fields were centred on the coordinates: , with the 2000 field centred on the coordinates: . These three epochs are combined to provide the final source list used in this analysis, with a total of 180 point sources detected in the field. Table 1 lists the identifiers, coordinates and properties of the 180 sources identified in NGC 1333. The table provides the Chandra identifier, source locations, the raw and net number counts (net counts are background subtracted and aperture corrected), plasma temperature (), hydrogen column density (), absorbed and unabsorbed X-ray flux (), and flaring statistics. The field of view of Chandra is 17′, smaller than that covered by the IR data: thus not all IR-identified cluster members were observed at X-ray wavelengths.
2.2.1 Source Detection
For NGC 1333, the three separate epochs were first combined using the merge_all script222Chandra contributed software - http://cxc.harvard.edu/ciao/download/contrib.html This wrapper script uses standard ciao tools to create a merged event file. The inputs were the individual event files and the level 1 aspect solution data products. The event files were standard level 2 products with an energy filter of 0.3-8.0 keV and a spatial filter to select CCD chips 0-3 applied. We used obsid 6437 (the latest observation) as the coordinate reference to which the other observations have their coordinates reprojected. With the merged event file we ran a recursive blocking source detection algorithm. In this scheme, we performed two iterations using the ciao wavlet based source detection tool, wavdetect. The first pass looked at a square region 15’ on each side and centered at the aimpoint with full resolution. The second pass examined a area including all six ACIS chips with pixels binned by two.
Source and background regions were determined separately for the three datasets. The program was used to convert the WCS coordinates of the merged events list back to the physical coordinates in the individual observations. From the detected source positions, we create elliptical source extraction regions for the 3 individual datasets. For each source, the parameters of the ellipse are the size of the semimajor and semiminor axis as well as the orientation angle of the ellipse, . Allen, Jerius, & Gaetz (2004) have produced a parameterization of the axial description of the Chandra point spread function by using observed data. The ellipse semimajor and semiminor axes for a given encircled energy fraction (ECF) and energy can be interpolated from the lookup table as a function of azimuth angle, , measured in degrees, and off-axis angle, .333A lookup table of the parameterization is available at: http://cxc.harvard.edu/cal/Hrma/psf/ECF/hrmaD1996-12-20hrci_ell_ecf_N0003.fits The size of the ellipse axis are determined by a linear interpolation. The table value for the off-axis angle nearest the source, at 95% ECF and 1.0 keV is used. The interpolation is then between the nearest adjacent azimuth angles. Due to the coarse grid of this calibration parameterization, it is impractical to interpolate the proper ellipse angle, . Therefore, we used the CIAO tool to obtain images of the PSF at a finer grid of off-axis and azimuthal angles around the ACIS array. We fit ellipses at each location, and derived a general empirical formula: . A centroid algorithm is then applied to the source ellipse to balance the distribution of photons within the ellipse in the actual dataset. Background regions were defined as similar elliptical annuli, centered on the source position. The outer semimajor and semiminor axes were 6 times the size of the source ellipse and the inner axes 3 times the source. Finally a check was done to identify nearby or overlapping sources. These sources are removed from the source extraction area with exclusion regions of ellipses 3 times the original source size. Finally, psextract was run to create appropriate files for spectral fitting. Psextract follows the standard CIAO 3.4 threads444http://cxc.harvard.edu/ciao3.4/threads/ispec.html. First, dmextract is used to create the source and background spectra in Pulse Height Amplitude (PHA) space. Then, dmstat lists the chip location of the source and background regions and acis_fef_lookup uses this information to identify the appropriate spectral calibration files (FEFs). Then mkrmf applies the FEF to create the source and background Response Matrix Function (RMF). These files are used by Sherpa to convert PHA channels to energy. In most cases, because the source and background regions have the same average detector coordinates, the two files are the same. Next, asphist is used to create the aspect histogram, which is a binned representation of aspect motion during the observation. This is then applied by mkarf to create an appropriate Ancillary Response Function (ARF). The ARF contains the combined telescope/filter/detector areas (“effective area”) and the quantum efficiency (QE) as a function of energy averaged over time.
2.2.2 Spectral Analysis
We used the CXC SHERPA program to generate spectral fits and solve simultaneously for the absorbing column of hydrogen, , and the temperature of the thermal plasma, . The results incorporate simultaneous fits of the three observations by defining each spectrum independently and fitting with the same model for a result which minimizes the combined residuals. We fit the unbinned spectra to a one temperature Raymond-Smith model. In the case of NGC 1333, the temporal spread in the data means that the temperature and flux of the sources could change between epochs; the reported fits are effectively an average of the data from the epochs. We used unbinned data fitted using CSTAT statistics and Powell optimization. This combination is more robust in avoiding local minimizations, which binned methods tend toward. This also gives more reliable results in low count sources. This later point was especially important for NGC 1333 in which the observations were thrice divided and hence we would have required about 30 counts in each observation for successful binned fits. Recent work by Siemiginowska (2008; http://cxc.harvard.edu/sherpa/references/papers/statistics.pdf) also indicates that unbinned statistics are less biased then the binned form. We used a model background consisting of a constant, power-law, and Gaussian to resemble a typical ACIS background. X-ray fluxes are estimated using Sherpa’s eflux function. We calculate the total integrated energy flux over our standard energy range (0.3-8.0 keV). A flux is returned in units of . This is repeated using only the kT model component to obtain the unabsorbed flux. The values are scaled up from the 95% encircled energy radius for the final published values.
2.3 Optical & Near-IR Spectroscopy
To undertake a more thorough examination of the X-ray properties of the two young clusters, we obtained spectral observations of members identified by the Spitzer and Chandra observations (as well as a number of stars surrounding the clusters to search for additional members). The spectral observations of both clusters were obtained using the Hectospec instrument on MMT and the SpeX instrument on IRTF. A full analysis of these data can be found in the companion paper Winston et al. (2009), where a comparison with the IR photometry and evolutionary classifications of the sources is undertaken. Hectospec, on the MMT, provides simultaneous far-red (6000-9000 Å) spectra of up to 300 objects, and was used to observe the less embedded known cluster members and to search for diskless members not detected by Chandra. SpeX on the IRTF provided spectra of known, more deeply embedded Class II and III members, over the , and -bands. A brief summary of the relevant points from the companion paper is provided: In total, spectral types were obtained for 64 young stellar objects (YSOs) in Serpens, with a further 74 in NGC 1333. All of the SpeX sources were known cluster members, while eight (4 in Serpens, 4 in NGC 1333) of the Hectospec sources are possible new diskless young stellar objects that were not detected in the Chandra data but show absorption, an indicator of stellar youth. We determined spectral types for 60 and 70 previously identified YSOs in Serpens and NGC1333, respectively. Of these members with spectral types, 34 and 59 have Chandra X-ray counterparts in Serpens and NGC 1333, respectively.
3 X-ray Characteristics of the NGC 1333 YSOs
3.1 YSO Detection Rates
Previous infrared studies by Gutermuth et al. (2008b) have revealed 137 YSOs with IR-excess emission in the NGC 1333 cluster. The Chandra observations of the region identified 180 point sources, of which 95 were matched to an IRAC or 2MASS detection in at least one IR band, with a maximum separation between the Chandra and IR positions of . Table 1 lists the coordinates and X-ray properties of the 180 X-ray point sources in the Chandra catalogue. Table 2 lists the Chandra identifier and coordinates, the infrared coordinates and IR photometry of the 95 X-ray detections with an IR counterpart. The formal uncertainties for each Spitzer magnitude are listed; in addition to these uncertainties is an approximately 5% uncertainty in the calibration. The remaining 85 X-ray sources were not detected in any IR band and were randomly distributed across the field of view, and are therefore considered to be background contamination from AGN. In this paper we use the classification scheme used in Winston et al. (2007): Class 0/I sources, with rising spectral energy distributions (SEDs) with where , Flat Spectrum sources with flat SEDs and , Class II sources with decreasing SEDs (), Transition Disks which show weak infrared excesses at 3-8 m and are thought to have large holes in their inner disks, and Class III members of the cluster which lack an infrared excess.
Of the remaining 95 X-ray sources with an IR counterpart, 54 were known IR YSOs. The remaining 41 sources exhibited no IR-excess emission and were identified as YSOs solely by their elevated X-ray emission. These sources are Class III diskless members of the cluster, bringing the total number of cluster members to 178. Of the YSO detections, 64 were previously identified in the Getman et al. (2002) study, including 22 of the Class III young stars. Thus we identify 19 new Class III members. Of the cluster members, or 23% were identified solely by Chandra. A list of the Spitzer coordinates and identifiers of the YSOs detected in the Chandra field are given in Table 3 along with the evolutionary class and Getman et al. (2002) identifier.
The Chandra ACIS-I FOV did not cover the entire Spitzer IRAC field. Of the 137 IR-excess YSOs, 127 were in the ACIS FOV: None of the eleven cluster members determined to be in evolutionary Class 0 were detected. Five of the twenty-two Class I protostars were detected (22.7 10% of the Class I’s in X-ray field of view); eight of the fifteen Flat Spectrum sources were observed (53.3 19%). Thirty-nine of the seventy-five Class II objects were found to have X-ray counterparts (52% 9%), while two of the four Transition Disk objects were detected (50 35%). These are similar detection fractions to the 50% found in Serpens (Winston et al., 2007). No difference in detection rate was observed between the later evolutionary classes; to within 1 , approximately 50% of objects in each of these classes were detected. The X-ray detection fraction in NGC 1333 is slightly lower in the Class I group; however, the protostars in NGC 1333 are more dispersed than in Serpens and tend to lie further off-axis in the ACIS field of view. Compared to the later evolutionary stages, the protostars are more deeply embedded and their soft X-ray emission is more highly absorbed. Further, it is possible that the NGC 1333 protostars are at an early evolutionary stage, the mechanism of X-ray production in these stars may just be turning on in this cluster (Giardino et al., 2007).
3.2 Spatial Distribution
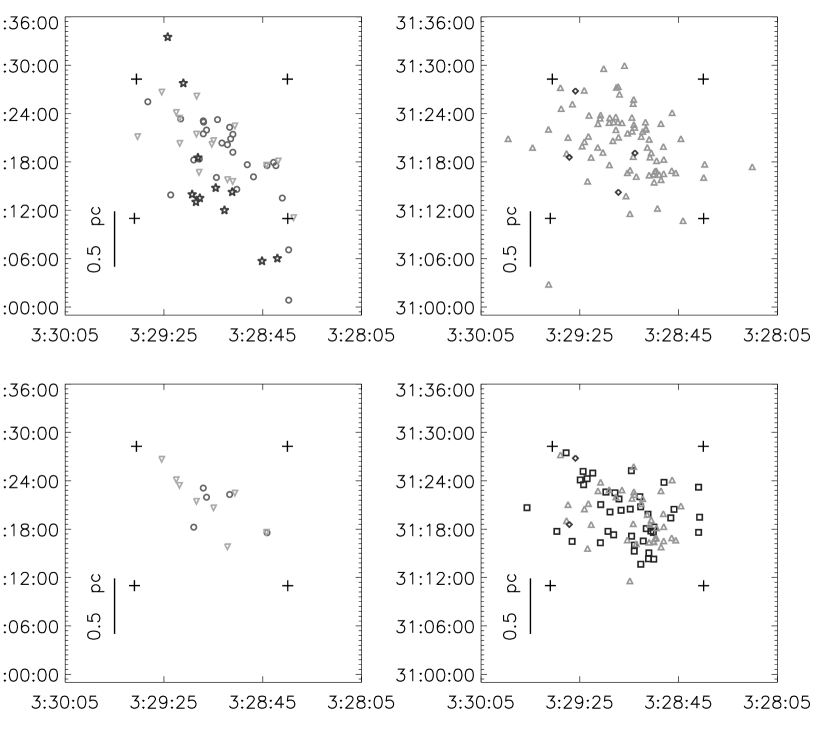
The 178 young stellar objects identified as belonging to the NGC 1333 cluster were mapped to determine their spatial distribution, as shown in Fig. 1. The spatial distribution is shown for the sample of infrared-excess stars (upper two plots) and the sub-sample of X-ray luminous member stars (lower two plots), including the Class III objects. The Chandra field of view is constrained to 17′17′, a region outlined by the four crosses in the figure. A detailed discussion of the underlying distribution of the NGC 1333 YSOs is presented in Gutermuth et al. (2008b, 2009). The protostars in NGC 1333 follow an elongated distribution, tracing the underlying filamentary dust and gas distribution (Hatchell et al., 2005). The Class II and the newly identified Class III stars are more concentrated into a central ’double’ cluster (Gutermuth et al., 2008b; Lada et al., 1996).
The spatial distribution of the cluster sources was examined for each of the evolutionary classes using a nearest neighbour technique. In keeping with our Serpens study (Winston et al., 2007), the Class 0 and Class I protostars were combined into one group. The nearest neighbour distance is the projected distance to the nearest YSO of the same evolutionary class, using the adopted distance to NGC 1333 of 240 pc. Figure 2 shows the distribution of nearest neighbour distances. We also calculate the nearest neighbor distance for the sub-sample of X-ray detected sources in each evolutionary class. The mean separation between the combined group of Class 0 and Class I protostars is 0.099 pc, with the separation between the Flat Spectrum objects at 0.139 pc. In Serpens, the equivalent separations were 0.033 pc and 0.109 pc, respectively (the Serpens separations are the results from Winston et al. (2007) scaled up to account for the revised distance of 360 pc to Serpens, c.f. Section 4). The Class II sources have a slightly smaller average separation than the protostars of only 0.08 pc (in Serpens 0.134 pc). The separations between the Transition Disk stars have a mean value of 0.437 pc (this is biased by the small number of sources), in Serpens it was 0.183 pc. The mean separation for the Class III stars is 0.097 pc, similar to that of the youngest protostars. In Serpens, the Class III stars had a mean separation of 0.181 pc, five times that of the protostars. The mean separation of the Class III sources may be biased to a lower value by the field of view of the Chandra data. The X-ray field covers 90% of the Class II sources however, so unless the Class III distribution is greatly extended beyond that of the Class II, then this value is likely a representative result.
Comparison of the spatial distributions of the YSOs in each evolutionary class with a random distribution was carried out by generating 10,000 random distributions with an equal number of stars to that of the given evolutionary class. For the Class III sources the size of the random field is constrained to the Chandra field of view. The resulting nearest neighbour distributions were compared using the K-S test and the mean probability taken. The Class I, Class II, and Class III populations were all unlikely to arise from a random distribution with probabilities . The Flat Spectrum and Transition Disk sources had probabilities of 24% and 53%, due to the small number of sources in each class.
In distinct contrast to Serpens, the NGC 1333 star forming region shows a cluster arrangement where the young protostars show a similar spacing to that of the Class II & III populations. It is important to note that the Class II and Class III sources show very similar spacings. We have thus extended the result of Gutermuth et al. (2008a), that the protostars and Class II objects show similar spacings, to the Class III objects. The Kolmorogov-Smirnov probability that the Class II and Class III distributions arise from the same parent distribution is 26.5%. Winston et al. (2009) also find similar age distributions for the Class II and III objects. These observations, taken in aggregate, show that the populations of pre-main sequence stars with and without disks exhibit indistinguishable spatial and age distributions; this suggests that the Class III objects are not typically older, more evolved stars, but stars that lost their optically thick disks more rapidly.
3.3 X-ray Absorption, , and of Bright X-ray Sources
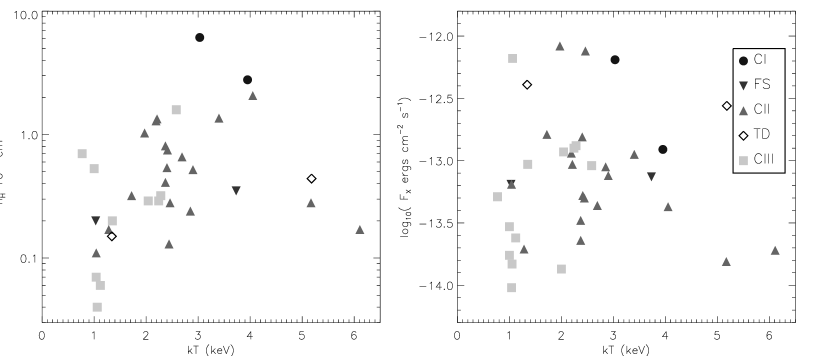
The observed X-ray detection limit can be estimated from Feigelson et al. (2005) as , where the distance to NGC 1333 is taken as 240 pc, and the exposure time is 88.45 ks, and the assumed . Only those detections with an X-ray count in excess of 100 were considered when examining the following emission properties to ensure reliable estimates. Fig.3 shows a plot of plasma temperature against the column density of hydrogen. There is a trend with evolutionary class in both and , with the Class I sources showing the highest values in both. The Class III sources exhibit the lowest values, from the lowest values we estimate the in the line of sight to the cluster from these diskless sources as . The median values of hydrogen column density by class are: for the Class I sources and Flat Spectrum sources, for the Class II and Transition Disk objects, and for the Class III stars.
Fig.3 shows the X-ray flux corrected for absorption and for the different classes. The median flux of the three Class I sources falls in the same range as that of the Class II and III stars, suggesting that the protostellar and PMS X-ray flux levels are similar. Jeffries et al. (2006) have shown increasing with flux, and a trend toward cooler coronal temperatures in older clusters. Here, as in Serpens (Winston et al., 2007), the evidence for an increasing trend in the to is not clear, with a Spearman rank coefficient of 0.034. If we discard the outliers, those with values of and , then we obtain a Spearman rank coefficient of 0.33, and a fit of , this is equivalent to . The relation for the Serpens data is . Previous studies have found values of for 1-Temperature model fits to late type stars (Schmitt et al., 1990) and for 2-Temperature model of ROSAT solar type field stars (Gudel et al., 1997). Preibisch (1997) finds a value of 2.2 for pre-main sequence stars in the Orion Nebula Cluster, similar to what we find. We defer a more in-depth discussion of the plasma temperature and X-ray luminosities of the Class II and III sources to Section 5.3 where we perform a detailed analysis of the X-ray properties.
3.4 Disk Fraction
To estimate the number of missing diskless Class III objects in our sample, we make an initial assumption that the X-ray detection rates of Class II and Class III sources are similar, at 52%. Further, from the examination of the spatial distribution and nearest neighbour comparisons, we find that, as in Serpens, the spatial distributions of the Class II and III sources are indistinguishable. Hence, as 41 Class III objects were observed, and taking into account that 94% of the Class II population is contained in the Chandra field of view, the total Class III YSO population of the cluster may be estimated as , or 84 objects, which would bring the total cluster membership to 221.
The fraction of stars with disks in the region was calculated from the X-ray detected Class II and III stars, as , or 49%8%, similar to the 51% found in Serpens. If the Class 0/I through Transition Disk objects are included then the fraction becomes: , or 57%8%. These fractions may be compared to the disk fraction calculated by Gutermuth et al. (2008b), who subtracted the estimated number of background sources from the observed number of infrared sources in the NGC 1333 field with mag. This led to an estimate of 87 YSOs in a circular region of radius 5.5′, covering the same central core as the Chandra field, of which 72 were IR-excess YSOs (Class I through Transition Disks), indicating a disk fraction of , or 83%11%. Comparing our X-ray detections in the same circular region, we find 45 IR-excess YSOs and 27 Class IIIs, leading to a disk fraction of 63%9%. Adopting the same upper -band magnitude limit at 14 mag as Gutermuth et al. (2008b), we find 21 IR-excess YSOs and 15 Class IIIs, giving 58%13%. The disk fraction estimated by Wilking (1989) of the northern filamentary cluster was 75%20%. There is a hint that the X-ray selected samples give systematically lower disk fractions than those estimated by source counts, although the 1 error bars of the results do (barely) overlap. If the number counts method is yielding too high a disk fraction, this may be an underestimate of the number of Class IIIs due to an overestimate of the background contamination in the cluster. Conversely, the assumption that the fraction of Class III detected in X-rays is equal to the fraction of Class II detected may be erroneous. This may be due to the somewhat higher X-ray luminosity in the Class III sources (see Sec. 5.1.)
4 X-ray Luminosity Functions: Distance to Serpens
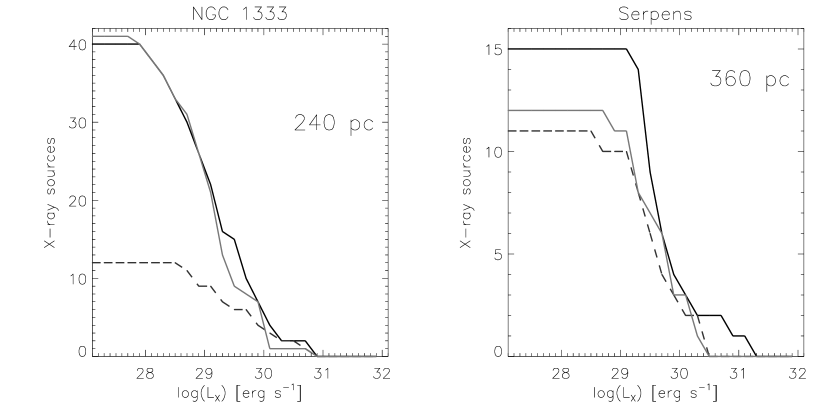
The X-ray Luminosity Functions (XLFs) of young stellar clusters with ages 5 Myrs have been found to follow a universal distribution that can be fit by a lognormal with and . This has been demonstrated from consideration of observational data from the Orion COUP survey, IC 348, and NGC 1333 (Feigelson & Getman, 2005; Feigelson et al., 2005) and LkH101 (Wolk et al., 2009). The observed cluster XLF depends only on the number of sources and the distance to the cluster. In Fig.4 we plot the XLF of all the X-ray sources in NGC 1333 with calculated as in Sec.5.1, using the maser parallax derived distance of 240 pc to the cluster (Hirota et al., 2008) and with the log-normal curve overplotted. As was previously reported using less sensitive Chandra ACIS-I imaging (Getman et al., 2002), the NGC 1333 luminosity function is well fit by the universal log-normal, indicating that our adopted distance to NGC 1333 is likely to be accurate.
The distance to the Serpens Cloud is currently estimated as 260 pc (Straiz̆ys et al., 1996). An early distance determination was that of Strom et al. (1974) who measured the distance to HD 170734 as 440 pc, assuming A0 spectral type, 9.2 and 0.3. Zhang et al. (1988) reported distance of 700 pc was based on HD 170634, HD 170739, and HD 170784 with B spectral types, and 3.1. de Lara et al. (1991) used the same stars, adding BD-24607 and Chavarria 7, reclassifying them to be on the main sequence, with and obtained a distance of 310 pc. Straiz̆ys et al. (2003) details Vilnius photometry and photometric classification of 473 stars toward the Serpens Cauda cloud complex, to a depth of . The and distance to each star was calculated and used to determine the near edge of the Serpens cloud and to estimate the depth of the cloud. The near edge of the cloud is found to lie at 22555 pc, with an estimated depth of 80 pc, leading to the average distance of 260 pc. The far edge of the cloud therefore lies at a maximum distance (assuming a +1 deviation) of 360 pc.
In Fig.5 we plot the XLFs for the Serpens X-ray sources from Winston et al. (2007) with modelled fluxes using four different distances to calculate the luminosity. Three of these are from previous literature studies: 260 pc (the currently most commonly adopted distance), 310 pc, and 440 pc, and one at 360 pc. We performed a least squares fit of the observed distribution to the universal XLF of Getman et al. (2005), varying the number of sources between 39 and 81 members and incrementing the distance by 10 pc from 250 to 450 pc. The fit was performed on the tail of the distribution from to avoid including any incomplete luminosity bins in the sample and to fit to the universal XLF where it is best defined. The figure shows the minimum fit at each distance and the fit for 60 sources, the probabilities for both fits are also given. The best fit to the data was found to be at a distance to Serpens of pc and 60 detections, with a probability of 0.998. To estimate the uncertainties, we determine the distances at which while constraining the number of objects to 60 and varying the distance in steps of 1 pc. There are 60 Chandra detections coincident with IR sources in the Serpens field, though only 40 had high enough count rates to have luminosities determined through model spectrum fits (hence the flat topped observed luminosity distributions in Fig.5). As such, the model fit to sixty sources appears to be reasonable. We note that if the number of X-ray luminous members is in excess of 60, higher distances are likely. For example, a high probability of 0.9 is found for 40 pc if we allow 80 objects - 20 more than have been detected. In contrast, distances of 310 pc or lower require the numbers of X-ray luminous members to be less than the number detected and may be ruled out. This best fit distance is approximately mid-way between the de Lara et al. (1991) 310 pc and Strom et al. (1974) 440 pc estimates, and indicates that Serpens may be further than the commonly adopted 260 pc. While statistical uncertainties and systematic errors in the determination of will introduce scatter and cause uncertainty in the XLF fitting, and the universal XLF itself is not exactly lognormal, these errors should apply equally to NGC 1333. As NGC 1333 is consistent with the universal XLF for the known distance and cluster membership, we find it unlikely that the more distant fit of Serpens can be due to these effects alone. Given that similar velocities have been found for the molecular gas associated with the recently discovered Serpens South cluster (Gutermuth et al., 2008a) and that associated with the Serpens Cloud Core studied here, we suggest that this further distance apply to the southern region as well.
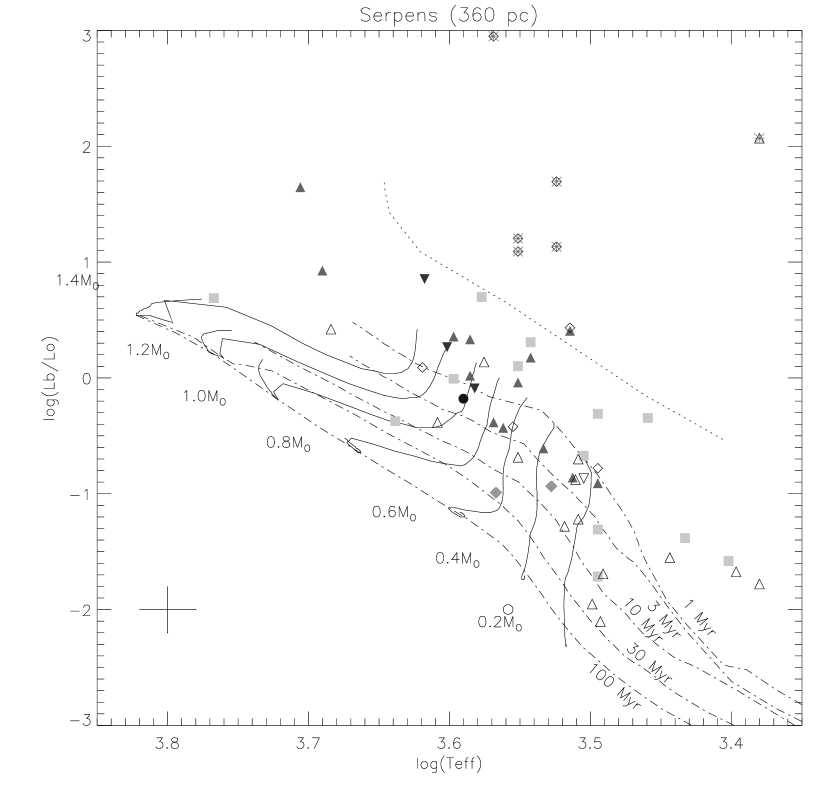
To ascertain whether this new estimated distance is compatible with our previous study of the Serpens HR diagram (HRD), in Fig.6 we have replotted the HRD of the region using the distance of 360 pc to calculate the luminosities of the spectrally classified YSOs (c.f. Fig.6 in Winston et al. (2009) for the HRD at 260 pc). At the new distance, the median age of both the Class II and III YSOs decrease to 1 Myrs. Two objects are newly located at or above the birth line, and these may be over-luminous, perhaps due to binarity, variability, or uncertainties in the position of the birthline. The majority of sources now have isochronal ages less than 3 Myr. At this distance, only four members now have apparent isochronal ages 10 Myr and none have ages 30 Myr. These ages are more in keeping with what might be expected of YSOs in a deeply embedded cluster rich with protostars. In the following discussions in this paper, both the bolometric and the X-ray luminosities for the Serpens cluster have been calculated from this new distance of 360 pc.
Does the XLF depend on evolutionary class? Fig.7 shows the XLFs of the two clusters by evolutionary class for the Class II, Class III, and protostellar sources (Class I and Flat Spectrum). In both clusters the Class II and Class III members show similar XLFs, with a Kolmogorov-Smirnov test probability of their arising from the same parent distribution of 48% in NGC 1333 and 65% in Serpens, for sources with in Serpens and in NGC 1333. These cut-offs in luminosity are imposed so that the K-S tests are based on complete bins in all evolutionary groups. The K-S probabilities indicate that the detection rate of the Class III sources is comparable to that of the Class II. This is similar to Getman et al. (2002), who found no differences in the XLFs of the Class II and Class III sources in the ONC. In contrast, Telleschi et. al. (2007) show WTTS to be brighter in X-rays than CTTS in Taurus. In Section 5.2 we will further discuss the differences in Class II and III X-ray luminosities.
The protostellar sources also show similar XLFs to those of the more evolved objects, although the sample is biased towards higher luminosities by their higher extinctions. In NGC 1333, the XLFs have probabilities of 71% and 34% of being drawn from the same parent distribution as the Class II and III sources, respectively. In Serpens, those probabilities are 99% and 86% for Class II and III sources, respectively. Thus, we find no evidence that the protostellar luminosity function differs from the primarily Class I and Flat Spectrum sources.
5 The Dependence of X-ray Emission on Measured Stellar Properties
5.1 X-ray Luminosity and Bolometric Luminosity
While the X-ray luminosity of main sequence stars, like the Sun, is variable, it also scales as a function of the bolometric luminosity and is dependent on the Rossby number (a measure of the stellar rotation rate) and the convective turnover time (Noyes et al., 1984). The X-ray luminosity of pre-main sequence stars has also been found to vary with bolometric luminosity (Feigelson et al., 1993; Preibisch et al., 2005). Coronal magnetic activity appears to be less variable in pre-MS stars that in MS stars (Stern et al., 1994), and is likely the origin of most of the X-ray emission from the YSOs, though accretion processes may also have an effect. Preibisch et al. (2005) and Preibisch & Zinnecker (2002) examined the relation of to for YSOs in the Orion COUP survey and IC 348, and for a sub-sample of field stars from the NEXXUS survey. They find that for pre-main sequence stars , where 1, compared to 0.4 for stars on main sequence. This relation was also observed for pre-main sequence stars in the Taurus molecular cloud by the XEST survey (Telleschi et. al., 2007).
We applied a similar analysis, determining the X-ray luminosity from where is the distance (we use tabulated in Table 1 for NGC 1333 and on the ANCHORS website for Serpens, using our new estimate of the distance in the calculation), and using the from Winston et al. (2007). Tables 4 & 5 list the spectral, X-ray and IR properties of the 138 YSOs considered in the following studies. The tables list the Spitzer identifier, spectral type, evolutionary class, Chandra identifier, bolometric luminosity, effective temperature, stellar surface area, the X-ray luminosity, plasma temperature and hydrogen column density, the extinction at -band, isochronal age and mass. The Serpens data are taken from Winston et al. (2007) and Winston et al. (2009), while the NGC 1333 IR and spectroscopic data are taken from Gutermuth et al. (2008a) and Winston et al. (2009), and the NGC 1333 X-ray data from this work. The isochronal ages and masses were determined from the isochrones and mass tracks of Baraffe (1998) interpolated onto a grid using IDL routines; the earliest isochrone used was 1 Myr. Those sources with isochronal ages listed as 0.2 Myr were near to the boundary of the grid used for extrapolation, where the age estimates were less certain, and were therefore assigned an estimated isochronal age. Those without an isochronal age or mass measurement were located beyond the boundaries of the grids where a useful age/mass estimate could not be obtained. The extinction at -band was measured following Gutermuth et al. (2008a) - who uses the CTTS locus first discussed by Meyer et al. (1997). Where a value of -band extinction could not be determined or was found to be blueward of the CTTS locus, the was set to zero in the calculations. In Tables 4 & 5 an of 0. indicates that the source was blueward of the CTTS locus, and a null value that it could not be calculated.
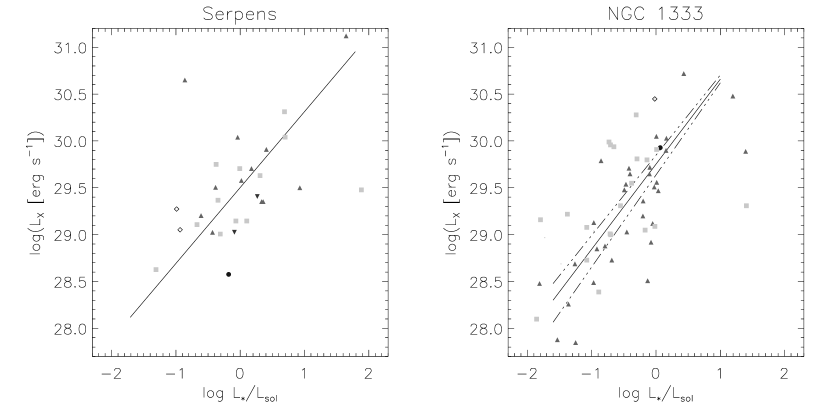
Figure 8 plots the stellar X-ray luminosity against the stellar bolometric luminosity in units of for the Serpens (left) and NGC 1333 (right) clusters. In both regions, a trend of increasing with stellar bolometric luminosity is observed. The slope of the relationship in the Serpens data is: , and the slope in the NGC 1333 region is: . In both regions, the bolometric values correspond, within 2 , to the relation observed previously in other young stellar clusters. For the NGC 1333 region, the Class II sources appear slightly less luminous than the Class III, but with the large scatter in the data the difference is less than 1 . The power law exponent for the Class II sources is: , while for the Class III sources it is: .
In Winston et al. (2007), a discussion of the stellar X-ray flux to the dereddened -band magnitude was put forth. The near-IR magnitude was used as a proxy for the stellar bolometric luminosity. In Serpens and NGC 1333, respectively, we find values of with of 0.420.17 and 0.530.09, where is the dereddened magnitude. Casanova et al. (1995), working from the results of Greene et al. (1994), found empirically that . Therefore, the vs. relationships are consistent with our derived and relationships.
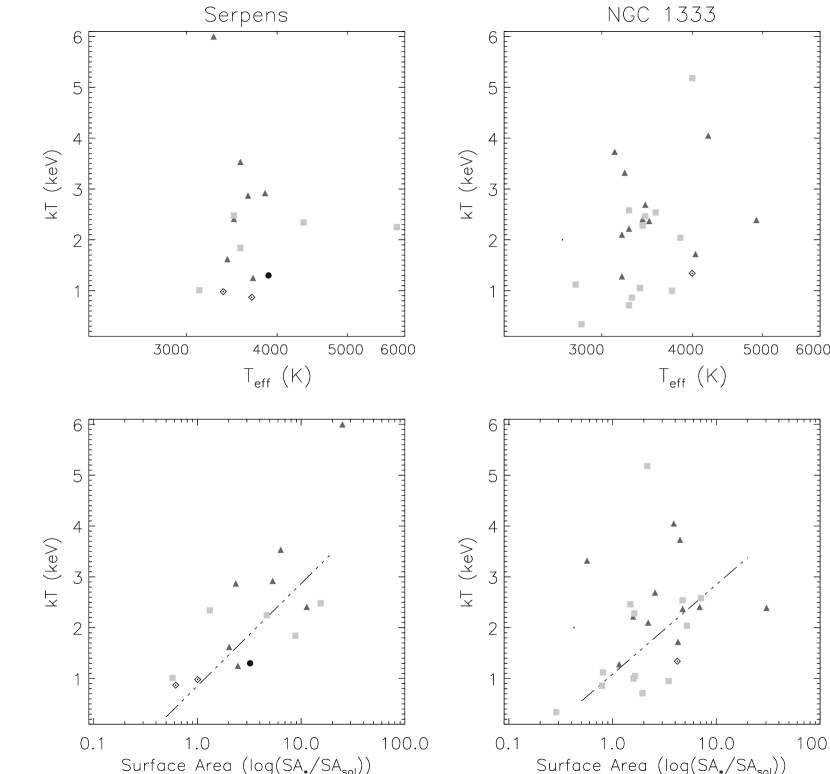
5.2 with Surface Area & Effective Temperature
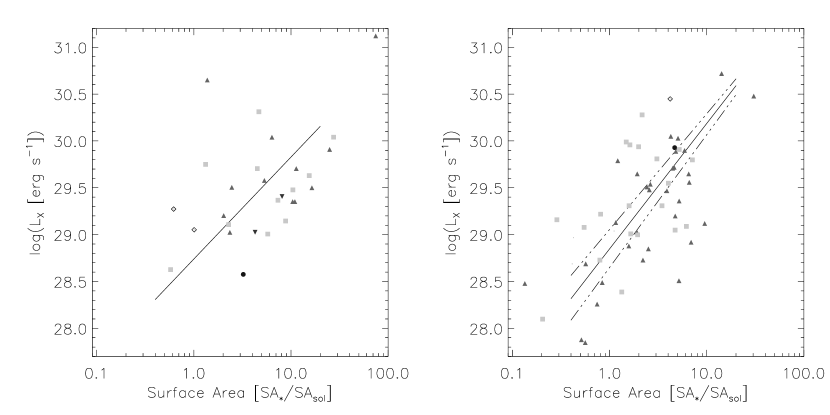
In this section we will examine the dependence of with surface area and with to discover if the increasing trend of X-ray flux to bolometric luminosity arises from variations in the effective temperature or the surface area of the star. The bolometric luminosity of a star may be given as , where is the stellar surface area and is the effective temperature. The surface area was determined in solar units from the bolometric luminosity and effective temperature derived from the spectral classification of each star, determined in Winston et al. (2009). The plots in Figs. 9 & 10 examine the physical parameters on which the vs. relation may depend: stellar surface area, , and effective temperature, . We note that the stellar surface area and effective temperature are not independent parameters: they will show some interdependence, such that hotter, more massive pre-main sequence stars will on average have larger surface areas.
In Fig. 9, the X-ray luminosity is plotted against the stellar surface area: The trend to increasing with stellar surface area is clearly visible in the plots. In Serpens, the fit to these data is , while in NGC 1333 it is . In Serpens, the Class II and III YSOs do not show any difference in trend of to . In NGC 1333, for a given surface area, the Class III YSOs have a somewhat higher X-ray flux than the Class IIs. The two populations can be fitted separately, with for the Class III and for the Class II. This difference in the median luminosity of the two fits is approximately 0.3 dex. Thus, we find a marginal offset of about between the fits of the two evolutionary classes. It is not clear why Serpens and NGC 1333 show different results. We do note that the Serpens sample is smaller (12 Class II and 11 Class III vs. 31 Class II and 23 Class III in NGC 1333) and dominated by more X-ray luminous objects where the difference between Class II and III objects is less obvious; hence such a difference could be less apparent.
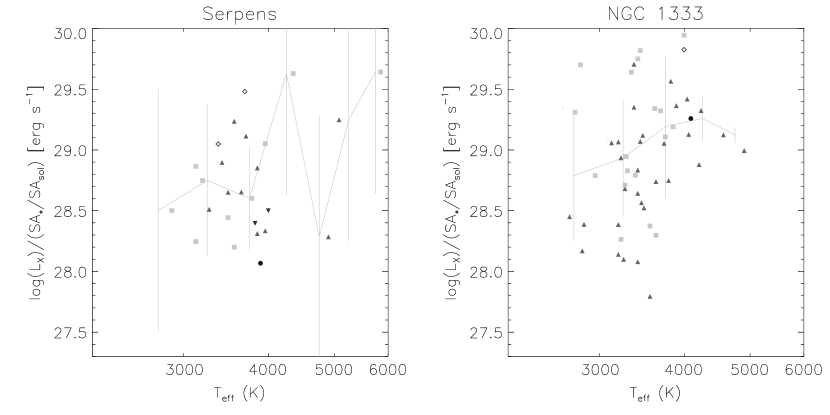
In Fig. 10, the X-ray luminosity is compared with the effective temperature, . In order to remove the contribution from surface area and thus isochronal age, the surface area has been divided out of the X-ray luminosity data to give the surface flux: . The overlaid graphs plot the median value of in bins of 500 K in from 2500 K to 6000 K. There is a discontinuity in the NGC 1333 plot, which occurs at an approximate temperature of 3800, the transition between and spectral types. A Kolmogorov-Smirnov test was performed on the populations to either side of this boundary temperature to ascertain the probability that they are from the same parent distribution: in NGC 1333 the probability was 7.4%, in Serpens 29.3%. Although the result in NGC 1333 is suggestive, a larger sample of sources is needed to provide the statistical significance necessary to confirm the discontinuity.
Previous studies have arrived at contradictory answers on the issue of the X-ray luminosity of Class II and Class III YSOs. A number of studies have found no difference in the X-ray luminosities of the two groups (Gagné et al., 1995; Feigelson et al., 1993; Casanova et al., 1995; Preibisch & Zinnecker, 2002), while in Taurus, Stelzer & Neuhauser (2001) and Telleschi et. al. (2007) find the WTTS to be more luminous. Preibisch et al. (2005) find that while accreting T Tauri stars are less luminous than non-accretors, those stars with - or -band excesses show no difference in luminosity to those without. It is not clear how much of this is due to the intrinsic scatter in the X-ray luminosities (which is greater than the systematic differences between Class II and III sources), real differences between different star forming regions, and the different criteria (accretion signatures and near IR excess emission) used to separate Class II and Class III. Winston et al. (2009) found a strong correspondence between the presence of an accretion indicator and the presence of an IR-excess from a disk; thus, we do not expect a difference in behavior between samples selected by accretion indicators and those selected by IR-excess. The fact that even with the Spitzer data, we find one cluster with differing Class II and II X-ray luminosities (NGC 1333) and one without (Serpens) suggests that the contradictory results may result from a combination of the large intrinsic scatter and the smaller sample size in Serpens.
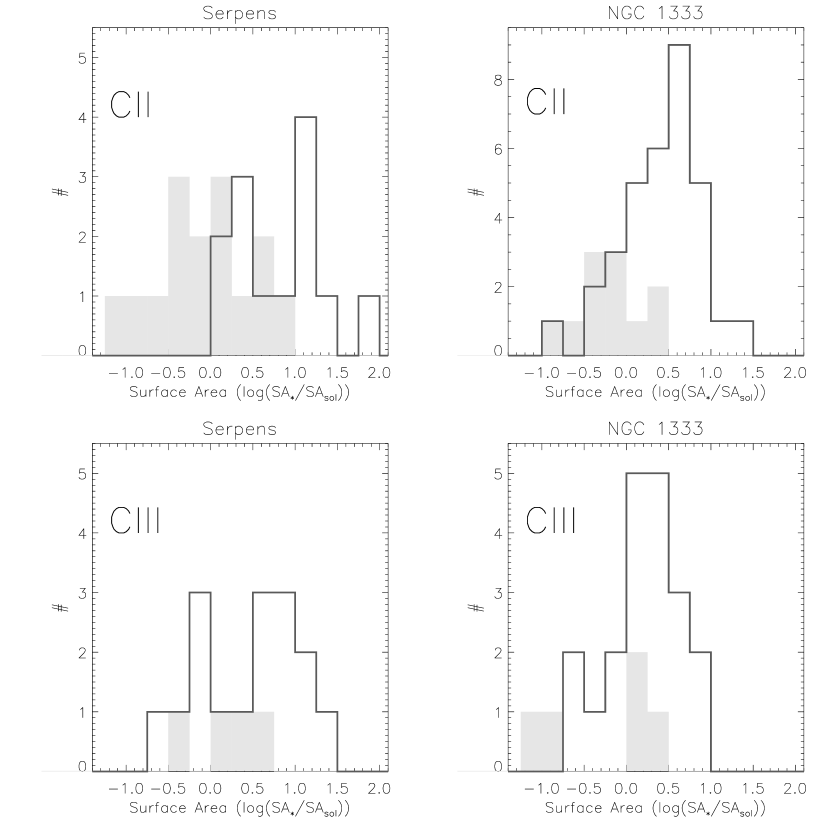
Given the dependence of on surface area for detected sources, it is also important to assess the detection rate of YSOs as a function of their surface areas. In Fig.11, the histograms of the surface areas of the Class II and Class III YSOs with spectral types in each cluster are presented for both clusters. The solid black histograms indicate the X-ray detected YSOs, while the shaded grey histograms are those of the non X-ray detections. The Class II sources without X-ray detections are easily detected by their IR-excesses. The displayed sample are the Class II sources for which we obtained spectra; Winston et al. (2009) describe the selection biases in that sample. The histograms show that the X-ray detected Class IIs have larger surface areas than the non X-ray detections, with median values of 2.62 and 0.61 for NGC 1333 and 3.32 and 0.70 for Serpens, respectively. The Class IIIs have median values of 1.94 for NGC 1333 and 2.35 for Serpens. To attempt to find a value for the non X-ray detected Class IIIs we have utilised the candidate Class IIIs identified from in their spectra (Winston et al., 2009). Their median surface areas were 1.11 and 1.54 for NGC 1333 and Serpens, respectively, though the statistics here are small. Not only are the median surface areas of the non-detected sources smaller, but we find that all of the non-detected sources have for Serpens and for NGC 1333. Such sources with smaller surface areas may emit too weakly in X-rays to be detected in our Chandra observations unless they are undergoing strong flaring.
5.3 Plasma Temperature with Surface Area and Effective Temperature
In Section 3, the X-ray luminosity was found to increase with the plasma temperature. A hotter plasma may arise from increased heating rate in the coronal loop or through increased loop length (Preibisch, 1997). Gagné et al. (1995) note that the plasma temperature is dependent on the stellar rotation period and stellar age. Preibisch et al. (2005) also find that the plasma temperature increases with . As is dependent on and , in Fig. 12, we investigate the dependence of the X-ray plasma temperature, , on the surface area and effective temperature of the star. The fits to these plots were made while removing the outlier data points: the outlier points are at 6 keV in Serpens, and at 3 keV in NGC 1333 (see the vs plot in Fig. 12 for the motivation for removing these points.) Neither cluster shows strong evidence of a trend in plasma temperature with increasing effective temperature. Both clusters do show trends of increasing plasma temperature with increasing surface area. The Serpens data show a trend of , with NGC 1333 giving .
There is also a dependence of plasma temperature on evolutionary class. In NGC 1333, the Class II and Class III sources have statistically distinguishable values of , with a Kolmogorov-Smirnov test giving a probability of 3.3% that the Class II and III come from the same distribution (in Serpens the probability is 21%, probably due to the small sample). A similar difference in the electron temperature of CTTS and WTTS was observed in the Taurus XEST study by Telleschi et. al. (2007). In NGC 1333, the mean value of the Class II is keV and the mean value for the Class III sources is keV. The mean value for the 3 Class I objects is keV, though the Class I objects likely have higher extinctions that may absorb most of the low energy X-rays. All but one of the Class III diskless members have plasma temperatures keV, while the Class I sources all exhibit values above 3 keV.
5.4 X-Ray Luminosity with Isochronal Age and Mass
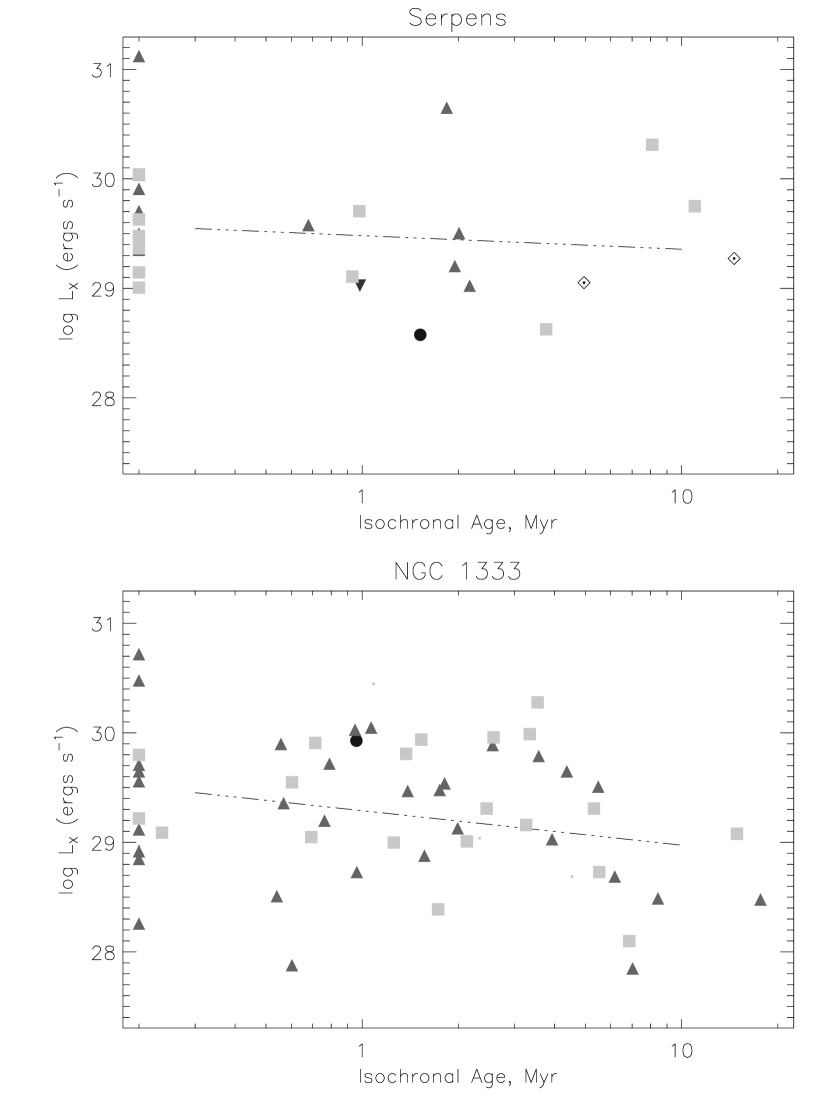
It is known that decreases with age over the stellar lifetime and increases with stellar mass (Micela et al., 2002a, b). The ages and masses of the stars in Serpens and NGC 1333 were determined by use of their spectral types to map them from the H-R diagram with isochrones and mass tracks taken from Baraffe (1998), and are thus dependent on the choice of model. The apparent isochronal ages and the inferred age spreads, in particular, are controversial (Chabrier et al., 2000; Hartmann et al., 2005; Peterson et al., 2008; Winston et al., 2009). We do not expect to see evidence for a rapid decrease in with age over the isochronal ages of these stars; other cluster studies have shown that the X-ray luminosity does not decrease rapidly until 100 Myrs (Micela et al., 2002a). A decreasing trend in X-ray luminosity with stellar age was found for PMS stars in Orion by Preibisch & Feigelson (2005). Given their large sample, they use four mass bins from 0.1 to 2 , while here we will examine the sample as a whole. Over all four bins, they find a decreasing trend of with age, with average value: .
Figure 13 (left) examines the X-ray luminosities of the young stars with respect to their ages. A marginal trend towards lower luminosities with increasing age is observed in the NGC 1333 data, , while no significant trend is found in the Serpens region. Since stars contract as they age, this may result from the dependence of X-ray luminosity on the surface area. No difference was observed in the fits of with isochronal age separated by evolutionary class.
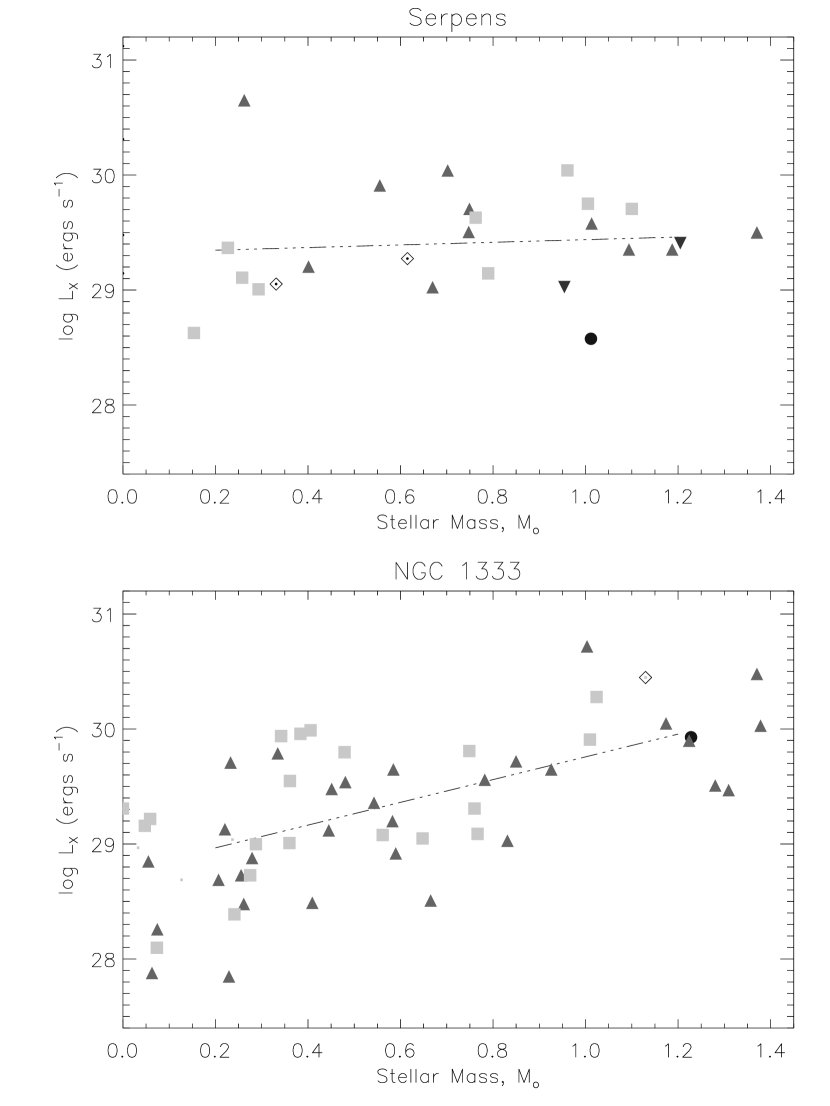
Preibisch & Zinnecker (2002) found in IC 348 that the where , whereas Preibisch et al. (2005) found a lower of 1.44 or 1.13 for stars with mass in Orion (depending on whether the Siess et al. (2000) or Palla & Stahler (2000) PMS model tracks, respectively, are used). Work in Taurus by Telleschi et. al. (2007) on the XEST survey found . Figure 13 (right) examines the effect of stellar mass on the X-ray luminosity; the masses were determined by Winston et al. (2009) using the Baraffe (1998) tracks. A trend to increasing with increasing mass is evident in NGC 1333, with . In Serpens , we do not find a significant increase with mass. The trends with mass were not found to be dependent on evolutionary class.
5.5 Discussion of X-ray Properties
From our analysis of the X-ray and spectral properties of the two clusters NGC 1333 and Serpens we identify four main relations of interest that we will discuss in this section.
Dependence of X-ray Luminosity on Bolometric Luminosity & Stellar Surface Area. In Sec 5.1 we find that the v. relation holds to that published in the literature for other young stellar clusters in Serpens and NGC 1333. In the young stars, increases approximately linearly with , while for more evolved field stars the relation is shallower. We find that the strong dependance of on bolometric luminosity is due for the most part to an approximately linear dependence on the surface areas of the young stars, while there is a much weaker dependence with effective temperatures. The dependence on surface area suggests that coronal X-ray production is saturated in the young stars. Further, this dependence suggests that coronal emission (and not accretion emission) is the dominant mechanism involved in X-ray production in the YSOs.
Dependence of X-ray Luminosity on Evolutionary Class. We use our IR SED classifications of Class II and Class III objects to compare the properties of diskless and disk-bearing YSOs and find that for a given surface area the Class III stars are more X-ray luminous than the Class II.
In NGC 1333, we find some evidence that for a given surface area, the mean luminosity of the Class III YSOs is somewhat higher than that of the Class IIs. The difference between the median Class II and Class III values is 0.3 dex. Such a difference has been noted previously in other regions and suggested explanations include: absorption of X-rays due to the inclination of the circumstellar disk in Class II sources, or magnetic disk-braking causing slower rotation in Class IIs and thus a weaker - dynamo. It is also possible that the accretion column onto the surface of the Class II stars is reducing the total volume of the corona available to produce X-rays (Gregory et al., 2007). This would require that 30% (0.3 ) of the surface area of the Class II stars was covered by accretion columns. However, studies such as Calvet & Gullbring (1998) and Muzerolle et al. (2001) estimate that from 1%-10% of the stellar surface is affected by accretion. This effect is therefore not large enough to fully account for the difference between the Class II and III stars.
Another possible origin of the difference in Class II and III for a given or is that the disk-bearing YSOs are over-luminous in due to veiling, which leads to an over estimation of their bolometric luminosity (Cieza et al., 2005). In Winston et al. (2009) we estimate veiling of up to 0.3 in . However, if this were the case the Class II would be systematically intrinsically fainter than the Class III (by ) and would therefore have a greater median age (4.5 Myr compared with the current 2.1 Myr), making them significantly older than the Class III (2.4 Myr).
Dependence of X-ray Luminosity on Effective Temperature. In NGC 1333, we find some evidence for a discontinuity in the distribution of X-ray luminosities at 3800 K, the boundary between K7 and M0 spectral classes. The K-M boundary at 1 Myr is the approximate location of the turnover from the convection tracks to the radiative tracks (Baraffe, 1998). The discontinuity in X-ray luminosity could then be due to the transition between the fully convective YSOs and those developing a radiative core and convection zone.
Dependence of Plasma Temperature with Evolutionary Class, Surface Area, Effective Temperature We find that the plasma temperature increases with the surface area squared, but there is no apparent dependence on effective temperature. In NGC 1333, the Class III stars exhibit consistently cooler plasma temperatures than the Class II. This is also seen to a lesser extent in Serpens where the Class III objects do not show plasma temperatures exceeding 2.5 keV. If the plasma temperature is dependent on the coronal loop length, this might imply that the Class II stars had longer loop lengths. However, the higher plasma temperature and lower luminosities of Class II objects may be due to under-correction of disk absorption in the X-ray modelling, thus leading to hotter plasma temperatures (since the lower energy X-rays are absorbed) and lower determinations for the Class IIs.
Dependence of X-ray Luminosity on Isochronal Age & Mass. Lastly, we find some weak dependence of X-ray luminosity with isochronal age and mass, qualitatively consistent with dependence on surface area and effective temperature, from which the values of age and mass are determined. The X-ray luminosity tends to decrease slightly if at all with isochronal age and to increase with mass. Since the isochronal age depends on surface area, the dependence of with age may really be the dependence of with stellar surface area. In turn, the surface area depends in part on age, mass, and potentially the accretion history (Chabrier et al., 2009), thus weakening the dependence on the actual age of the source. The dependence of with stellar mass may also reflect the dependence with surface area, although the possible increase of with may also contribute.
6 Hydrogen Column Density and Extinction in NGC 1333 and Serpens
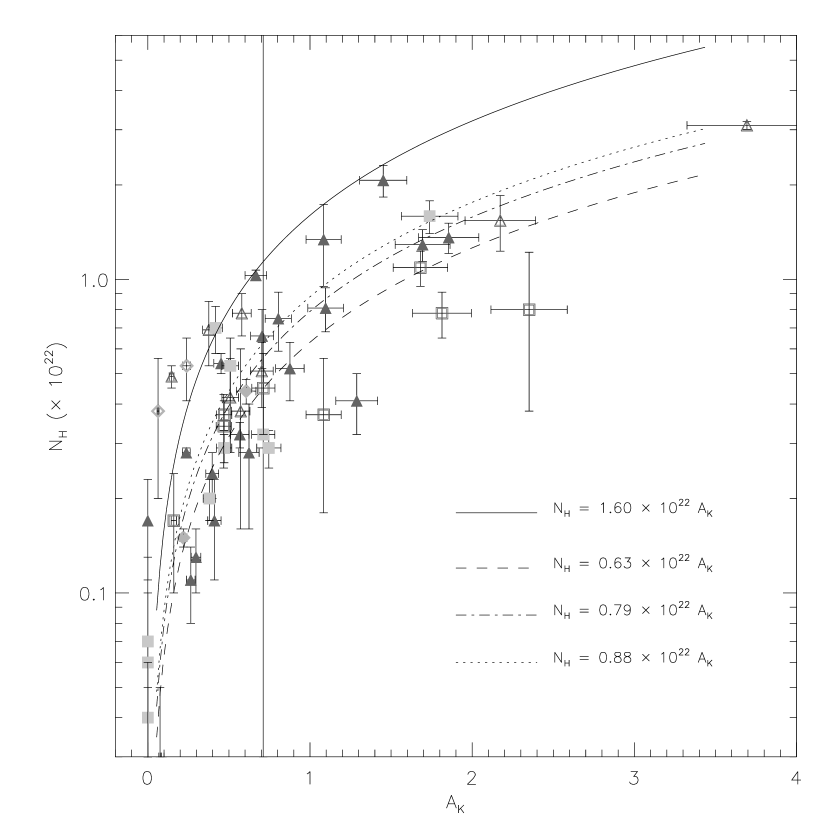
The X-ray and infrared results have also been used to calibrate the relationship between Hydrogen gas column density in the line of sight and the extinction measured using the near-IR bands (Fig. 14). Previous measurements of this value lead to an approximately linear fit of (Vuong et al., 2003; Feigelson et al., 2005) for star forming regions, while the value for the diffuse ISM ranges from (Vuong et al., 2003; Gorenstein, 1975). In NGC 1333, Preibisch (2003) noted that SVS16 had a value of corresponding to an inconsistent with the extinction calculated in the IR of and suggested this may be due to the X-ray production mechanism or a change in the canonical dust-to-gas ratio. Winston et al. (2007) found the value using Class III objects in the Serpens region , where (Rieke & Lebosky, 1985). The rationale for using the Class III objects was that they would be unaffected by local extinction due to disks and accretion flows. Winston et al. (2007) proposed that this discrepant value was due to changes in the extinction law due to the growth of grains through the accretion of volatiles onto grain mantles and/or coagulation. A limitation of this result was that the fit of the extinction law was driven by only three Class III objects with 1.6 2.4.
We calculated for each star using the method of Gutermuth et al. (2004), which is based on the reddening loci from Meyer et al. (1997) and the extinction law of Flaherty et al. (2007). These values are compared to the column density of hydrogen atoms, , which is calculated from the inferred absorption of the X-ray emission for 26 objects in NGC 1333 and 18 in Serpens. The results for NGC 1333 are consistent with those in Serpens by Winston et al. (2007). The linear fit of the slope for seven Class III stars was , while that for the Class II objects (18 in number) was . In all cases, the ratio falls below that found for the diffuse ISM (Vuong et al., 2003). In the Class II objects, the X-rays may be absorbed by the gas in an accretion flow (within which it would be too hot for dust grains to exist) or in a disk. In addition, some of the near-IR light might be scattered by dust in the disks, potentially resulting in an underestimate of the extinction. This would be consistent with our analysis in Sec. 3, which shows a lower X-ray luminosity and higher X-ray temperature for the Class II sources compared to the Class III sources. Since the v. relationship for Class II objects could be affected by the circumstellar environment, it is best determined using Class III objects. These diskless sources are reliably identified with the mid-IR data from Spitzer.
The relationship of to was previously examined in the NGC 1333 region by Getman et al. (2002) using an 37.5 ks Chandra observation of the region. While they find their results to be consistent with standard ISM values, they also note that some sources are consistent with the lower v slope we determined from the Serpens region. We have compared their values of and to our own and found that they agree to within the 1 uncertainties. In our work, the low vs. slope becomes apparent due to the separation of sources into Classes II and III and our extension to higher .
For the combined clusters, the slope of to is 1/3 that of the interstellar ISM. Using the Class III objects of NGC 1333 and Serpens, we calculate that . These results are consistent with those found in the deeply embedded stars in the RCW 108 region (Wolk et al., 2009), suggesting that the slope of v is typically lower in deeply embedded regions where the extinction exceeds .
7 Conclusion
In this paper we have presented Chandra X-ray observations of the NGC 1333 star forming region, and compared these data with the Spitzer catalogue of identified young stellar objects in the region. The work further presents a comparative study of the X-ray and fundamental stellar (bolometric luminosity, effective temperature, age, mass) properties of the NGC 1333 and Serpens clusters determined with far-red and near-IR spectra.
-
•
In total, we identify 95 NGC 1333 cluster members in X-rays. Five of these detections were Class I, eight Flat Spectrum, thirty-nine Class II, and two Transition Disk objects. We identify 41 Class III members of the NGC 1333 cluster through their elevated X-ray emission, 19 of which are new to this study. This brings the total number of detected cluster members to 178.
-
•
We found the fraction of each class detected in X-rays; 23% of Class I, 53% of Flat Spectrum, 52% of Class II, 50% of Transition Disks. If the detection rate of Class II and Class III sources are the same, the total Class III population of the cluster is approximately 84 members (implying 221 members in total); however, if the Class III sources are more X-ray luminous than the Class II sources then the number of Class III sources will be lower. None of the known Class 0 protostars were detected by Chandra.
-
•
Using the XLF of Serpens, a new distance to the cluster is estimated at pc. This distance is similar to previous literature distances to the cluster, and is found to be compatible with the HRD of the region, giving a median age of 1 Myr for the star forming region. This new distance may also be applied to the recently discovered Serpens South cluster.
-
•
The relation found in other star forming regions was confirmed for the two clusters. This was found to be predominantly a dependence of X-ray luminosity on the stellar surface area, with some weak dependence on the effective temperature. There is some evidence for a jump in with near the M0-K7 transition, which may be due to the turnover from purely convective YSOs to one with a developing radiative core.
-
•
A marginal dependence of X-ray luminosity with evolutionary class suggests that the diskless Class III sources in NGC 1333 are, for a given stellar surface area, more luminous than their disk-bearing Class II counterparts. In Serpens the two classes show similar luminosities, although this may be due to the smaller sample size and the larger scatter.
-
•
The temperature of the X-ray emitting plasma was also examined as a function of effective temperature and surface area, with increasing trends observed with surface area. The Class III sources are found to have lower values of than the Class II in each case, with K-S probabilities of them arising from the same distribution of 21% (Serpens) and 3.3% (NGC 1333). This may be a result of underestimation of the absorption due to circumstellar disks.
-
•
The variation of X-ray luminosity with age was considered, indicating a marginal trend in NGC 1333 to higher levels of X-ray flux at younger ages. This may reflect the dependence of isochronal age on stellar surface area. There is also a trend in with mass, with more massive YSOs showing higher X-ray fluxes. This is consistent with previous studies such as the COUP in Orion.
-
•
In the case of NGC 1333, the ratio of to is lower than expected, , a similar value to that found in Serpens (Winston et al., 2007). The median value for both clusters is . This may be the result of grain growth through coagulation of the accretion of grain mantles as discussed in Winston et al. (2007).
This work is based on observations made with the Chandra Telescope, under NASA contract NAS8-03060. This work is based on observations made with the Spitzer Space Telescope (PID 6, PID 174), which is operated by the Jet Propulsion Laboratory, California Institute of Technology under NASA contract 1407. Support for this work was provided by NASA through contract 1256790 issued by JPL/Caltech. Support for the IRAC instrument was provided by NASA through contract 960541 issued by JPL. This work is based on observations taken with the Hectospec instrument on the MMT, a joint venture of the Smithsonian Institute and the University of Arizona. This publication makes use of data products from the Two Micron All Sky Survey, which is a joint project of the University of Massachusetts and the Infrared Processing and Analysis Center/California Institute of Technology, funded by the National Aeronautics and Space Administration and the National Science Foundation. This research has made use of the NASA/IPAC Infrared Science Archive, which is operated by the Jet Propulsion Laboratory, California Institute of Technology, under contract with the National Aeronautics and Space Administration.
References
- Allen, Jerius, & Gaetz (2004) Allen, C., Jerius, D. H., & Gaetz, T. J. 2004, Proc. SPIE, 5165, 423
- Aspin et al. (1994) Aspin, C., Sandell, G., Russell, A.P.G., 1994, A&AS, 106, 165.
- Baraffe (1998) Baraffe, I., 1998, A&A, 337, 403,
- Calvet & Gullbring (1998) Calvet, N., Gullbring, E., 1998, ApJ, 509, 802.
- Casanova et al. (1995) Casanova, S., Montmerle, T., Feigelson, E.D., Andre, P., 1995, ApJ, 439, 752.
- Chabrier et al. (2000) Chabrier, G., Baraffe, I., Allard, F., Hauschildt, P., 2000, ApJ, 542, 464.
- Chabrier et al. (2009) Chabrier, G., Baraffe, I., Allard, F., 2009, in press.
- Cieza et al. (2005) Cieza, L., et al., 2005, ApJ, 635, 422.
- D’Antona & Mazzitelli (1997) D’Antona, F., Mazzitelli, I., 1997, Mem. S.A.It., 68, 807.
- Davis et al. (1999) Davis, C.J., Matthews H.E., Ray T.P., et al, 1999, Mon. Not. R. Astron. Soc 309, 141-152.
- de Lara et al. (1991) de Lara, E., Chavarria, K. C., Lopez-Molina, G. 1991, A&A, 243, 139.
- Favata et al. (2003) Favata, et al., 2003, A&A, 403, 187.
- Favata et al. (2005) Favata, et al. , 2005, ApJS, 160, 469.
- Fazio et al. (2004) Fazio, G.G., et al., 2004, ApJS, 154, 10.
- Feigelson et al. (2005) Feigelson, E., Getman, R., et al., 2005, ApJ, 160, 379.
- Feigelson & Getman (2005) Feigelson, E. & Getman, R., 2005, astro-ph/0501207.
- Feigelson & Montmerle (1999) Feigelson, E. D., Montmerle, T., 1999, ARA&A, 37, 363-408.
- Feigelson et al. (1993) Feigelson, E.D., Casanova, S., Montmerle, T., Guibert, J., 1993, ApJ, 416, 623.
- Feigelson & Kriss (1981) Feigelson, E. D.; Kriss, G. A., 1981, ApJ, 248, L35-L38.
- Flaherty et al. (2007) Flaherty, K.M., et al., 2007, ApJ, 663, 1069F.
- Gagné et al. (1995) Gagné, M., Caillaut, J.P., Stauffer, J.R., 1995, ApJ, 450, 217.
- Getman et al. (2008) Getman, K.V., et al., 2008, ApJ, 688, 437.
- Getman et al. (2005) Getman, K. V., et al., 2005, ApJS, 160, 319-352.
- Getman et al. (2002) Getman, K. V., et al., 2002, ApJ, 575, 345-377.
- Giampapa et al. (1996) Giampapa, M.S., et al., 1996, ApJ, 463, 707.
- Giardino et al. (2007) Giardino, G., Favata, F., Micela, G., Sciortino, S., Winston E., 2007, A&A, 463, 275-288.
- Gorenstein (1975) Gorenstein, P., 1975, ApJ, 198, 95.
- Greene et al. (1994) Greene, T.P., Wilking, B.A., Andre, P., Young, E.T., Lada, C.J., 1994, ApJ, 434, 614.
- Gregory et al. (2007) Gregory, S.G., Wood, K., Jardine, M., 2007, MNRAS, 379, L35-L39.
- Gudel et al. (1997) Gudel, M., Guinan, E.F., Skinner, S.L., 1997, ApJ, 483, 947.
- Gutermuth et al. (2009) Gutermuth, R., et al., 2009, ApJS, 184, 18G.
- Gutermuth et al. (2008a) Gutermuth, R., et al., 2008, ApJ, 673, 151.
- Gutermuth et al. (2008b) Gutermuth, R., et al., 2008, ApJ, 674, 336.
- Gutermuth et al. (2004) Gutermuth, R., Megeath, S. T., Muzerolle, J., Allen, L., Pipher, J., Myers, P., Fazio, G. G., 2004, ApJS, 154, 374.
- Hatchell et al. (2005) Hatchell, J., et al., 2005, A&A, 440, 151-161.
- Hartmann et al. (2005) Hartmann, L., Megeath, S.T., Allen, L.E., Luhman, K., Calvet, N., D’Alessio, P., Franco-Hernandez, R., Fazio, G., 2005, ApJ, 629, 881-896.
- Hayashi et al. (1996) Hayashi, M.R., Hibata, K., Matsumoto. R., 1996, ApJ, 468, L37.
- Hernadez et al. (2007) Hernadez, J., et al., 2007, ApJ, 662, 1067.
- Hirota et al. (2008) Hirota T., et al., 2008, PASJ, 60, 37.
- Hogerheijde et al. (1999) Hogerheijde, M., van Dishoeck E., Salverda J., 1999, ApJ, 513, 350-369.
- Isobe et al. (2003) Isobe, H., et.al., 2003, PASJ, 55, 967.
- Jeffries et al. (2006) Jeffries, R.D., Evans, P.A., Pye, J.P., Briggs, K.R., 2006, Mon. Not. R. Astron. Soc., 367, 781-800.
- Kaas et al. (2004) Kaas, A.A., Olofsson G., Bontemps S., et al, 2004, A&A, 421, 623-642.
- Kastner et al. (2002) Kastner, J.H., et al., 2002, ApJ, 567, 434.
- Knee & Sandell (2000) Knee, L.B.G., & Sandell, G., 2000, A&A, 361, 671.
- Küker & Rüdiger (1999) Küker, M., & Rüdiger, G., 1999, A&A, 346, 922.
- Lada et al. (1996) Lada, C.J., Alves, J., Lada, E.A., 1996, AJ, 111, 1964.
- Mercer et al. (2009) Mercer, E.P., et al., 2009, AJ, 138, 7-18.
- Meyer et al. (1997) Meyer, M. R.; Calvet, N.; Hillenbrand, L. A., 1997, AJ, 114, 288-300.
- Micela et al. (2002a) Micela, G., et al., 2002, ASPC, 269, 107.
- Micela et al. (2002b) Micela, G., et al., 2002, ASPC, 277, 263.
- Muzerolle et al. (2001) Muzerolle, J., Calvet, N., Hartmann, L., 2001, ApJ, 550, 944.
- Noyes et al. (1984) Noyes, R.W., Hartmann, L.W., Baliunas, S.L., et al., 1984, ApJ, 279, 763.
- Palla & Stahler (2000) Palla, F., Stahler, S.W., 1999, ApJ, 525, 772.
- Peterson et al. (2008) Peterson, D.E., et al., 2008, ApJ, 685, 313.
- Preibisch (1997) Preibisch, T., 1997, A&A, 320, 525-539.
- Preibisch & Zinnecker (2002) Preibisch, T., Zinnecker, H., 2002, AJ, 123, 1623.
- Preibisch (2003) Preibisch, T., 2003, A&A, 401, 543-555.
- Preibisch et al. (2005) Preibisch, T., Kim, Y., Favata, F., et al., 2005, ApJS, 160, 401.
- Preibisch & Feigelson (2005) Preibisch, T., Feigelson, E., 2005, ApJS, 160, 390.
- Racine (1968) Racine, R., 1968, AJ, 73, 233.
- Rieke & Lebosky (1985) Rieke, G., Lebosky, ., 1985, ApJ, 288, 618.
- Rieke et al. (2004) Rieke, et al., 2004, ApJS, 154, 25-29.
- Romanov et al. (2004) Romanov, M.M., et al., 2004, ApJ, 616, L151.
- Schmitt et al. (1990) Schmitt, J.H.M.M., Collura, A., Sciortino, S., Vaiana, G.S., Harnden, F.R., Rosner, R., 1990, ApJ, 365, 704.
- Siess et al. (2000) Siess, L., Dufour, E., Forestini, M., 2000, A&A, 358, 593.
- Skrutskie et al. (2006) Skrutskie, M.F., Cutri R.M., Stiening R., et al., 2006, AJ, 131, 1163.
- Stelzer & Neuhauser (2001) Stelzer, B., Neuhauser, R., 2001, A&A, 377, 538.
- Stern et al. (1994) Stern, R.A., Schmitt, J.H.M.M., Pye, J.P., et al., 1994, ApJ, 427, 808.
- Straiz̆ys et al. (1996) Straiz̆ys, V., C̆ernis, K., Bartas̆iūtė, S., 1996, Baltic Astron., 5, 125
- Straiz̆ys et al. (2003) Straiz̆ys, V., C̆ernis, K., Bartas̆iūtė, S., 2003, A&A, 405, 585.
- Strom et al. (1974) Strom, S. E., Grasdalen, G. L., Strom, K. M. 1974, ApJ, 191, 111.
- Telleschi et. al. (2007) Telleschi, A., Gudel, M., Briggs, K.R., Audard, M., Palla, F., 2007, A&A, 468, 425.
- Testi et al. (1998) Testi, L., Sargent, A., 1998, ApJ, 508, L91-L94.
- Testi et al. (2000) Testi, L., Sargent, A., Olmi L., Onella J., 2000, ApJ, 540, L53-L56.
- Vuong et al. (2003) Voung, M. H., et al., 2003, A&A, 408, 581-599.
- Wilking (1989) Wilking, B.A., 1989, Publ. Astron. Soc. Pacific, 101, 229.
- Wilking et al. (2004) Wilking B.A., Meyer, M.R., Greene, T.P., Mikhail, A., Carlson, G., 2004, AJ, 127, 1131.
- Winston et al. (2007) Winston, E., Megeath, S.T., Wolk, S.J., Muzerolle, J., Gutermuth, R., Hora, J.L., Allen, L.E., Spitzbart, B., Myers, P., Fazio, G.G., 2007, ApJ, 669, 493.
- Winston et al. (2009) Winston, E., Megeath, S.T., Wolk, S.J., Muzerolle, J., Gutermuth, R., Hora, J.L., Allen, L.E., Hernandez, J., Covey, K., Spitzbart, B., Myers, P., Fazio, G.G., 2009, AJ, 137, 447.
- Wolk et al. (2006) Wolk, S. J., Spitzbart, B. D., Bourke, T. L., Alves, J., 2006, AJ, 132, 1100-1125.
- Wolk et al. (2009) Wolk, S. J., et al., 2008, AJ, 135, 693.
- Zhang et al. (1988) Zhang, C. Y., Laurejs, R. J., Clark, F. O., Wesselius, P. R. 1988, A&A, 199, 170.
| Chandra | RA | Dec | Raw | Net aaNet Counts: background subtracted and aperture corrected from raw counts. | kT | Abs. Flux | Tot. UnAbs. Flux | ||
|---|---|---|---|---|---|---|---|---|---|
| ID | (2000) | (2000) | CNT | CNT | keV | ||||
| 1 | 3:29:03.03 | 31:15:17.09 | 47 | 40.2 | 4.18 | 12.09 | -14.06 | -13.72 | 1.01 |
| 2 | 3:28:52.16 | 31:15:47.75 | 36 | 29.5 | 0.100.14 | 0.960.09 | -14.73 | -14.58 | 0.80 |
| 3 | 3:28:59.32 | 31:15:49.56 | 1552 | 1544 | 1.460.08 | 2.390.16 | -12.79 | -12.36 | 2.23 |
| 4 | 3:29:02.91 | 31:16:01.63 | 273 | 268 | 0.000.00 | 1.000.04 | -13.76 | -13.76 | 1.00 |
| 5 | 3:29:02.18 | 31:16:12.15 | 71 | 65.7 | 0.020.07 | 0.840.04 | -14.40 | -14.36 | 0.72 |
| 6 | 3:29:21.15 | 31:16:17.47 | 62 | 50.2 | 18.07 | -13.76 | -13.21 | 1.24 | |
| 7 | 3:29:03.50 | 31:16:18.34 | 52 | 47.4 | 2.940.77 | 2.631.14 | -14.18 | -13.66 | 0.77 |
| 8 | 3:29:16.72 | 31:16:19.45 | 408 | 400 | 0.000.02 | 1.080.03 | -13.58 | -13.58 | 1.32 |
| 9 | 3:28:56.99 | 31:16:22.98 | 168 | 162 | 0.410.09 | 2.370.39 | -13.88 | -13.64 | 1.14 |
| 10 | 3:28:55.19 | 31:16:25.46 | 116 | 110 | 0.280.12 | 5.170.01 | -13.95 | -13.81 | 0.99 |
| 11 | 3:28:55.09 | 31:16:29.29 | 171 | 165 | 0.810.13 | 2.370.41 | -13.82 | -13.48 | 1.03 |
| 12 | 3:28:59.26 | 31:16:30.94 | 12 | 6.77 | 0.000.01 | 1.650.00 | -15.22 | -15.22 | 0.63 |
| 13 | 3:28:46.22 | 31:16:39.45 | 723 | 715 | 0.110.03 | 1.040.03 | -13.35 | -13.19 | 1.52 |
| 14 | 3:29:05.82 | 31:16:40.23 | 455 | 451 | 1.360.15 | 3.400.56 | -13.28 | -12.95 | 1.55 |
| 16 | 3:28:54.65 | 31:16:51.66 | 492 | 486 | 0.520.11 | 2.900.65 | -13.36 | -13.12 | 1.58 |
| 17 | 3:28:47.86 | 31:16:56.03 | 97 | 89.7 | 0.180.08 | 2.320.01 | -14.15 | -13.99 | 1.14 |
| 18 | 3:29:18.14 | 31:17:05.51 | 19 | 14.5 | 1.85 | -14.53 | -14.34 | 0.67 | |
| 19 | 3:28:43.38 | 31:17:02.72 | 12 | 4.55 | 30.62 | -14.75 | -14.05 | 0.74 | |
| 20 | 3:29:04.11 | 31:17:08.25 | 134 | 129 | 0.070.06 | 1.040.06 | -14.13 | -14.02 | 0.95 |
| 22 | 3:29:11.34 | 31:17:18.47 | 183 | 177 | 0.000.01 | 2.000.19 | -13.87 | -13.87 | 1.19 |
| 23 | 3:28:43.31 | 31:17:33.49 | 309 | 301 | 2.780.26 | 3.950.61 | -13.32 | -12.91 | 1.68 |
| 25 | 3:28:36.96 | 31:17:36.32 | 900 | 875 | 0.290.04 | 2.040.14 | -13.15 | -12.93 | 2.33 |
| 26 | 3:28:43.58 | 31:17:37.27 | 536 | 528 | 0.350.07 | 3.730.54 | -13.30 | -13.13 | 1.89 |
| 27 | 3:29:13.64 | 31:17:44.34 | 28 | 23.0 | 1.49 | 1.44 | -14.70 | -14.10 | 0.81 |
| 28 | 3:28:56.21 | 31:17:44.95 | 24 | 21.5 | 0.010.16 | 1.010.12 | -14.86 | -14.84 | 0.51 |
| 29 | 3:29:19.05 | 31:17:58.72 | 9 | 4.70 | |||||
| 30 | 3:28:58.13 | 31:18:04.47 | 183 | 180 | 0.530.12 | 1.000.08 | -14.02 | -13.53 | 0.85 |
| 32 | 3:28:53.97 | 31:18:09.97 | 442 | 439 | 1.290.15 | 2.190.29 | -13.37 | -12.94 | 1.52 |
| 33 | 3:28:56.85 | 31:18:11.74 | 8 | 5.92 | 4.990.44 | 1.890.92 | -14.98 | -14.19 | 0.40 |
| 34 | 3:29:12.97 | 31:18:15.30 | 850 | 847 | 6.120.34 | 3.030.27 | -12.82 | -12.19 | 1.78 |
| 35 | 3:28:55.02 | 31:18:16.03 | 18 | 15.7 | 0.18 | -14.73 | -14.66 | 0.50 | |
| 36 | 3:28:51.06 | 31:18:18.82 | 154 | 152 | 0.170.06 | 6.110.00 | -13.81 | -13.72 | 0.95 |
| 37 | 3:29:20.43 | 31:18:35.08 | 138 | 132 | 2.070.24 | 4.050.05 | -13.73 | -13.37 | 1.20 |
| 38 | 3:29:29.27 | 31:18:35.77 | 1798 | 1782 | 0.440.04 | 5.180.55 | -12.72 | -12.56 | 4.88 |
| 39 | 3:28:56.67 | 31:18:36.47 | 284 | 281 | 0.750.16 | 2.410.55 | -13.60 | -13.28 | 1.23 |
| 40 | 3:29:03.43 | 31:18:40.02 | 25 | 22.6 | 0.000.02 | 1.080.09 | -14.83 | -14.83 | 0.50 |
| 41 | 3:29:15.65 | 31:18:52.65 | 54 | 51.6 | 17.520.55 | 8.761.22 | -13.83 | -13.20 | 0.72 |
| 42 | 3:29:23.22 | 31:19:02.19 | 13 | 8.00 | 0.000.03 | 6.780.00 | -14.90 | -14.90 | 0.61 |
| 43 | 3:28:56.15 | 31:19:09.15 | 16 | 14.4 | 8.750.00 | 9.550.00 | -14.45 | -13.98 | 0.43 |
| 44 | 3:29:22.17 | 31:19:23.56 | 23 | 18.0 | 0.64 | -14.51 | -14.39 | 0.65 | |
| 45 | 3:28:48.18 | 31:19:24.35 | 14 | 12.1 | 0.330.10 | 0.24 | -15.06 | -14.20 | 0.37 |
| 46 | 3:29:18.61 | 31:19:26.22 | 77 | 74.7 | 3.440.55 | 5.090.08 | -13.88 | -13.48 | 0.79 |
| 47 | 3:28:36.54 | 31:19:30.07 | 89 | 76.1 | 0.110.12 | 0.860.06 | -14.28 | -14.11 | 1.46 |
| 48 | 3:28:59.94 | 31:19:31.12 | 6 | 4.04 | |||||
| 49 | 3:28:48.80 | 31:19:31.67 | 29 | 27.1 | 1.34 | 13.67 | -14.26 | -14.05 | 0.48 |
| 50 | 3:29:06.64 | 31:19:34.05 | 32 | 30.5 | 1.82 | -14.15 | -13.95 | 0.50 | |
| 51 | 3:28:57.73 | 31:19:48.84 | 630 | 627 | 0.240.04 | 2.850.28 | -13.21 | -13.05 | 1.66 |
| 52 | 3:28:57.45 | 31:19:51.09 | 166 | 163 | 0.700.12 | 0.770.06 | -14.01 | -13.29 | 0.79 |
| 53 | 3:28:51.22 | 31:19:55.37 | 1297 | 1294 | 0.320.03 | 1.720.09 | -13.05 | -12.79 | 1.60 |
| 54 | 3:28:55.08 | 31:19:55.88 | 7 | 5.30 | |||||
| 56 | 3:29:12.83 | 31:20:08.69 | 18 | 16.3 | 0.870.28 | 0.340.05 | -15.01 | -13.68 | 0.37 |
| 57 | 3:29:09.28 | 31:20:14.38 | 10 | 8.42 | 4.912.26 | 2.320.81 | -14.78 | -14.10 | 0.34 |
| 58 | 3:28:39.25 | 31:20:16.88 | 15 | 7.52 | 3.31 | -14.55 | -14.30 | 0.82 | |
| 59 | 3:28:54.11 | 31:20:20.41 | 10 | 7.93 | |||||
| 60 | 3:29:08.34 | 31:20:20.27 | 10 | 8.71 | 1.88 | 0.71 | -15.13 | -13.84 | 0.26 |
| 61 | 3:28:46.89 | 31:20:28.55 | 23 | 18.9 | 0.000.02 | 0.980.12 | -14.86 | -14.86 | 0.66 |
| 62 | 3:29:04.58 | 31:20:29.48 | 16 | 13.7 | 0.38 | -14.71 | -14.61 | 0.45 | |
| 63 | 3:28:44.99 | 31:20:33.59 | 10 | 6.19 | |||||
| 64 | 3:29:27.08 | 31:20:31.71 | 12 | 6.89 | |||||
| 65 | 3:28:39.62 | 31:20:34.15 | 16 | 9.21 | 0.00 | -14.93 | -14.93 | 0.74 | |
| 66 | 3:28:51.31 | 31:20:38.87 | 17 | 14.6 | 3.510.00 | 9.550.00 | -14.51 | -14.19 | 0.53 |
| 67 | 3:29:04.95 | 31:20:39.19 | 9 | 7.25 | |||||
| 68 | 3:29:00.41 | 31:20:46.42 | 32 | 29.7 | 0.34 | 1.14 | -14.79 | -14.45 | 0.52 |
| 69 | 3:28:45.86 | 31:20:49.28 | 8 | 4.25 | 100. | -14.84 | -13.49 | 0.45 | |
| 70 | 3:28:45.45 | 31:20:51.01 | 71 | 67.5 | 1.240.29 | 0.00 | -13.86 | -13.70 | 0.80 |
| 71 | 3:29:16.60 | 31:21:03.56 | 16 | 13.8 | 0.960.46 | 1.720.67 | -14.94 | -14.50 | 0.46 |
| 72 | 3:29:29.78 | 31:21:03.39 | 89 | 81.6 | 0.090.08 | 2.100.28 | -14.21 | -14.11 | 1.08 |
| 73 | 3:29:19.08 | 31:21:07.18 | 66 | 63.9 | 0.96 | 13.95 | -14.06 | -13.88 | 0.70 |
| 74 | 3:29:00.18 | 31:21:10.22 | 17 | 14.8 | 2.380.65 | 0.820.25 | -14.87 | -13.64 | 0.42 |
| 75 | 3:29:24.16 | 31:21:10.32 | 38 | 30.3 | 3.30 | -14.17 | -13.89 | 0.93 | |
| 76 | 3:29:21.56 | 31:21:11.27 | 206 | 200 | 0.170.06 | 1.280.10 | -13.91 | -13.71 | 1.11 |
| 77 | 3:29:00.53 | 31:21:26.89 | 10 | 8.44 | |||||
| 78 | 3:29:11.90 | 31:21:27.92 | 38 | 36.2 | 2.550.67 | 3.881.99 | -14.10 | -13.70 | 0.58 |
| 79 | 3:29:09.16 | 31:21:44.63 | 19 | 16.8 | |||||
| 80 | 3:28:59.57 | 31:21:47.43 | 51 | 48.8 | 0.470.16 | 2.240.45 | -14.42 | -14.15 | 0.64 |
| 81 | 3:29:03.88 | 31:21:49.44 | 1051 | 1048 | 0.540.04 | 2.400.15 | -13.09 | -12.81 | 1.79 |
| 82 | 3:29:07.75 | 31:21:56.91 | 56 | 54.5 | |||||
| 83 | 3:28:47.93 | 31:21:57.56 | 43 | 38.7 | 4.161.12 | -14.03 | -13.75 | 0.88 | |
| 84 | 3:29:10.40 | 31:21:59.85 | 3796 | 3792 | 1.030.04 | 1.970.07 | -12.50 | -12.08 | 2.14 |
| 85 | 3:29:00.72 | 31:22:01.54 | 67 | 64.8 | 1.24 | 1.44 | -14.31 | -13.75 | 0.66 |
| 86 | 3:29:10.56 | 31:22:01.49 | 879 | 875 | 1.010.08 | 2.250.16 | -13.11 | -12.73 | 2.58 |
| 87 | 3:29:14.07 | 31:22:14.65 | 38 | 35.1 | 2.03 | -14.22 | -14.00 | 0.66 | |
| 88 | 3:29:02.79 | 31:22:17.84 | 9 | 6.81 | 1.92 | 0.90 | -15.26 | -14.23 | 0.41 |
| 89 | 3:28:58.43 | 31:22:18.19 | 107 | 104 | 21.582.09 | 9.05 | -13.50 | -12.81 | 0.95 |
| 90 | 3:28:43.44 | 31:22:21.58 | 14 | 8.06 | 0.00 | -14.87 | -14.87 | 0.68 | |
| 91 | 3:28:45.52 | 31:22:28.37 | 13 | 9.04 | |||||
| 92 | 3:28:56.27 | 31:22:28.01 | 21 | 18.7 | 0.96 | 1.83 | -14.76 | -14.33 | 0.43 |
| 93 | 3:29:29.55 | 31:22:28.79 | 15 | 7.41 | 0.00 | -14.84 | -14.84 | 0.81 | |
| 94 | 3:29:10.81 | 31:22:30.75 | 40 | 37.4 | 1.19 | 0.71 | -14.70 | -13.65 | 0.58 |
| 95 | 3:29:14.45 | 31:22:36.91 | 38 | 35.3 | |||||
| 96 | 3:29:03.15 | 31:22:38.27 | 25 | 22.9 | 0.740.35 | -14.47 | -14.35 | 0.53 | |
| 97 | 3:28:56.59 | 31:22:41.08 | 8 | 5.68 | |||||
| 98 | 3:29:17.67 | 31:22:45.60 | 6397 | 6391 | 0.280.01 | 2.460.08 | -12.32 | -12.12 | 2.40 |
| 99 | 3:28:52.18 | 31:22:46.02 | 525 | 520 | 0.130.03 | 2.440.17 | -13.42 | -13.30 | 1.58 |
| 100 | 3:29:07.97 | 31:22:52.29 | 299 | 297 | 1.340.39 | 2.210.78 | -13.47 | -13.03 | 1.05 |
| 101 | 3:29:13.13 | 31:22:53.27 | 56 | 53.7 | 1.100.27 | 2.410.66 | -14.30 | -13.92 | 0.65 |
| 102 | 3:28:45.56 | 31:22:55.01 | 27 | 22.7 | 3.69 | -14.26 | -14.00 | 0.77 | |
| 103 | 3:29:09.14 | 31:23:06.23 | 18 | 15.5 | 1.800.99 | 1.190.62 | -14.84 | -14.08 | 0.49 |
| 104 | 3:28:36.96 | 31:23:12.58 | 864 | 851. | 0.200.03 | 1.350.05 | -13.25 | -13.03 | 1.94 |
| 105 | 3:28:59.08 | 31:23:21.18 | 12 | 7.78 | 0.000.04 | 0.19 | -14.94 | -14.94 | 0.69 |
| 106 | 3:29:18.73 | 31:23:26.27 | 679 | 670 | 0.200.04 | 1.030.03 | -13.45 | -13.19 | 1.62 |
| 107 | 3:29:23.50 | 31:23:31.69 | 1033 | 1025 | 0.290.03 | 2.240.10 | -13.11 | -12.90 | 2.29 |
| 108 | 3:28:51.01 | 31:23:48.29 | 316 | 309 | 1.590.19 | 2.580.41 | -13.46 | -13.04 | 1.84 |
| 109 | 3:29:16.62 | 31:23:50.36 | 264 | 255 | 0.660.14 | 2.690.62 | -13.64 | -13.36 | 1.60 |
| 110 | 3:28:47.65 | 31:24:06.54 | 58 | 51.9 | 0.890.20 | 2.220.07 | -14.32 | -13.96 | 0.92 |
| 111 | 3:29:20.07 | 31:24:08.29 | 75 | 67.5 | 2.910.49 | 2.560.56 | -13.99 | -13.46 | 1.07 |
| 112 | 3:29:22.05 | 31:24:15.78 | 223 | 216 | 0.000.05 | 1.050.04 | -13.83 | -13.83 | 1.12 |
| 113 | 3:29:13.49 | 31:24:41.09 | 53 | 46.0 | 9.962.60 | -13.88 | -13.47 | 1.04 | |
| 114 | 3:29:18.63 | 31:24:41.85 | 12 | 5.03 | 100. | -14.66 | -13.31 | 0.66 | |
| 116 | 3:29:19.78 | 31:24:58.24 | 136 | 122 | 0.740.20 | 0.950.12 | -14.14 | -13.53 | 1.37 |
| 117 | 3:29:19.13 | 31:25:00.66 | 19 | 5.38 | 0.00 | 2.01 | -15.16 | -15.16 | 1.09 |
| 118 | 3:28:42.22 | 31:24:59.12 | 19 | 7.26 | |||||
| 119 | 3:28:47.61 | 31:25:19.13 | 17 | 4.89 | 0.000.02 | 0.150.02 | -14.45 | -14.45 | 1.09 |
| 120 | 3:28:59.63 | 31:25:42.69 | 32 | 20.9 | 12.070.42 | 2.921.23 | -14.26 | -13.45 | 1.27 |
| 121 | 3:28:49.40 | 31:26:17.29 | 20 | 7.49 | 0.00 | -14.96 | -14.96 | 1.26 | |
| 122 | 3:28:59.31 | 31:26:39.07 | 68 | 56.4 | 1.450.39 | -13.97 | -13.79 | 1.44 | |
| 123 | 3:28:57.10 | 31:15:02.74 | 43 | 24.8 | 0.190.22 | -14.32 | -14.26 | 1.35 | |
| 124 | 3:28:49.09 | 31:15:18.56 | 24 | 9.96 | 0.000.01 | -14.74 | -14.74 | 1.12 | |
| 125 | 3:29:08.71 | 31:15:20.34 | 18 | 13.0 | |||||
| 126 | 3:29:17.65 | 31:15:45.63 | 23 | 9.23 | 0.000.01 | 5.040.00 | -14.78 | -14.78 | 1.12 |
| 127 | 3:29:07.15 | 31:15:57.90 | 11 | 7.85 | |||||
| 128 | 3:28:51.04 | 31:16:32.44 | 16 | 9.33 | 0.000.08 | 3.250.01 | -14.99 | -14.99 | 0.79 |
| 129 | 3:28:55.29 | 31:17:35.78 | 14 | 11.5 | 1.390.32 | 0.230.02 | -15.27 | -12.94 | 0.41 |
| 130 | 3:29:24.34 | 31:18:05.79 | 33 | 26.5 | 2.600.00 | -14.29 | -14.06 | 0.92 | |
| 131 | 3:28:46.15 | 31:18:30.65 | 24 | 17.2 | 0.00 | -14.67 | -14.67 | 0.89 | |
| 132 | 3:29:30.46 | 31:19:02.92 | 35 | 19.5 | 0.000.02 | 6.800.00 | -14.54 | -14.54 | 1.22 |
| 133 | 3:29:17.05 | 31:19:10.16 | 9 | 6.63 | |||||
| 134 | 3:29:24.68 | 31:20:23.81 | 24 | 17.9 | 2.03 | -14.34 | -14.14 | 0.67 | |
| 135 | 3:29:23.22 | 31:20:31.39 | 20 | 15.8 | 0.340.25 | 0.840.09 | -14.99 | -14.58 | 0.59 |
| 136 | 3:29:24.88 | 31:20:52.08 | 57 | 50.6 | 1.60 | 2.24 | -14.25 | -13.79 | 0.96 |
| 137 | 3:28:44.11 | 31:20:53.45 | 13 | 10.0 | 0.00 | 1.29 | -14.96 | -14.96 | 0.50 |
| 138 | 3:29:04.08 | 31:20:53.45 | 12 | 10.3 | 17.130.08 | 1.970.82 | -14.70 | -13.55 | 0.39 |
| 139 | 3:28:35.09 | 31:21:11.96 | 37 | 26.4 | 5.071.88 | 2.931.64 | -14.28 | -13.69 | 1.18 |
| 140 | 3:28:31.91 | 31:21:21.26 | 70 | 50.9 | 2.790.74 | -13.90 | -13.67 | 1.54 | |
| 141 | 3:29:31.69 | 31:21:24.81 | 34 | 20.4 | 0.220.25 | -14.48 | -14.41 | 1.17 | |
| 142 | 3:28:42.26 | 31:22:18.65 | 23 | 15.6 | 1.68 | 11.17 | -14.52 | -14.29 | 0.85 |
| 143 | 3:29:24.84 | 31:24:06.69 | 30 | 22.9 | 0.000.02 | 0.940.06 | -14.74 | -14.74 | 0.85 |
| 144 | 3:28:49.51 | 31:24:15.76 | 19 | 11.0 | 2.82 | -14.49 | -14.22 | 0.86 | |
| 145 | 3:29:04.84 | 31:24:34.84 | 12 | 9.85 | |||||
| 146 | 3:28:59.83 | 31:24:41.95 | 21 | 17.4 | 3.090.98 | 3.031.27 | -14.56 | -14.07 | 0.66 |
| 147 | 3:29:05.76 | 31:24:54.79 | 8 | 5.01 | 10.730.10 | 2.301.02 | -14.75 | -13.85 | 0.60 |
| 148 | 3:29:23.73 | 31:25:09.14 | 49 | 28.4 | 0.00 | 6.83 | -14.38 | -14.38 | 1.53 |
| 149 | 3:29:04.21 | 31:25:15.74 | 48 | 43.2 | 0.760.28 | 2.541.09 | -14.10 | -13.79 | 0.80 |
| 150 | 3:28:51.50 | 31:25:14.45 | 29 | 16.3 | 1.280.17 | 5.960.23 | -14.49 | -14.24 | 1.25000 |
| 151 | 3:28:48.65 | 31:25:23.98 | 37 | 24.3 | 0.900.50 | -14.33 | -14.19 | 1.05 | |
| 152 | 3:29:02.99 | 31:25:45.64 | 12 | 1.26 | |||||
| 153 | 3:29:07.04 | 31:27:02.29 | 25 | 15.2 | 4.49 | -14.38 | -14.06 | 1.07 | |
| 155 | 3:28:53.66 | 31:15:38.58 | 18 | 10.4 | 4.27 | 1.54 | -14.75 | -13.89 | 0.80 |
| 156 | 3:28:48.58 | 31:24:47.53 | 29 | 16.2 | 0.000.02 | 0.18 | -14.64 | -14.64 | 1.04 |
| 161 | 3:29:00.34 | 31:13:39.51 | 1019 | 997 | 0.32 | 2.28 | -13.10 | -12.88 | 2.70 |
| 162 | 3:28:55.16 | 31:14:16.53 | 38 | 21.2 | 1.18 | 10.57 | -14.32 | -14.12 | 1.26 |
| 163 | 3:28:57.24 | 31:14:19.94 | 8015 | 7996 | 0.040.01 | 1.060.01 | -12.25 | -12.18 | 3.27 |
| 164 | 3:29:25.22 | 31:15:27.19 | 38 | 25.2 | 0.000.04 | -14.37 | -14.37 | 1.11 | |
| 165 | 3:29:21.85 | 31:15:37.43 | 103 | 91.0 | 3.380.55 | 3.210.83 | -13.82 | -13.33 | 1.37 |
| 166 | 3:29:28.17 | 31:16:29.52 | 316 | 302 | 0.060.04 | 1.120.03 | -13.72 | -13.62 | 1.72 |
| 167 | 3:29:39.33 | 31:16:31.03 | 58 | 20.6 | 1.13 | -14.18 | -14.02 | 2.02 | |
| 168 | 3:29:26.40 | 31:16:56.30 | 32 | 18.2 | 10.94 | -14.16 | -13.69 | 1.19 | |
| 169 | 3:29:34.32 | 31:17:44.45 | 1506 | 1484 | 0.040.02 | 2.460.17 | -12.90 | -12.85 | 3.47 |
| 170 | 3:29:33.73 | 31:20:27.48 | 28 | 12.9 | 3.54 | -14.36 | -14.10 | 1.11 | |
| 171 | 3:29:46.37 | 31:20:40.19 | 81 | 59.4 | 0.180.15 | 0.860.05 | -14.06 | -13.80 | 1.65 |
| 173 | 3:28:29.71 | 31:25:11.78 | 91 | 45.4 | 0.140.18 | -14.00 | -13.95 | 2.01 | |
| 174 | 3:28:37.84 | 31:25:27.26 | 72 | 39.7 | 1.750.54 | -14.00 | -13.81 | 1.98 | |
| 175 | 3:29:25.99 | 31:26:41.57 | 1458 | 1425 | 0.280.03 | 4.540.28 | -12.83 | -12.69 | 3.21 |
| 176 | 3:29:26.81 | 31:26:48.34 | 4046 | 4014 | 0.150.01 | 1.340.02 | -12.57 | -12.39 | 3.33 |
| 177 | 3:29:19.49 | 31:27:05.59 | 24 | 4.74 | 0.00 | -14.75 | -14.75 | 1.35 | |
| 178 | 3:29:24.94 | 31:27:45.84 | 56 | 11.3 | 0.000.01 | -14.34 | -14.34 | 1.84 | |
| 179 | 3:29:04.73 | 31:11:35.06 | 35 | 26.0 | |||||
| 180 | 3:29:08.78 | 31:13:15.71 | 35 | 13.4 | 2.47 | -14.11 | -13.88 | 1.66 | |
| 181 | 3:29:25.89 | 31:13:44.37 | 86 | 59.4 | 1.05 | 11.63 | -13.94 | -13.7500 | 1.85 |
| 182 | 3:29:25.71 | 31:13:57.23 | 82 | 52.9 | 0.750.25 | -13.98 | -13.85 | 1.86 | |
| 183 | 3:29:32.87 | 31:27:13.52 | 86 | 39.3 | 0.000.00 | 3.320.00 | -14.15 | -14.15 | 1.91 |
| 184 | 3:28:50.46 | 31:27:55.36 | 85 | 63.7 | 1.020.28 | 5.020.01 | -14.06 | -13.81 | 1.75 |
| 185 | 3:29:21.99 | 31:28:31.76 | 62 | 26.2 | 1.46 | 11.55 | -14.08 | -13.8700 | 1.79 |
| 186 | 3:28:58.49 | 31:11:41.17 | 34 | 22.2 | |||||
| 187 | 3:29:37.54 | 31:20:41.53 | 26 | 4.64 | 3.770.08 | 6.280.35 | -14.53 | -14.15 | 1.38 |
| 188 | 3:29:30.55 | 31:27:27.10 | 78 | 32.3 | 0.000.01 | 8.900.37 | -14.15 | -14.15 | 1.76 |
| 189 | 3:29:31.57 | 31:14:07.07 | 42 | 13.5 | 2.851.17 | -14.27 | -14.04 | 1.69 | |
| 190 | 3:29:41.29 | 31:14:06.19 | 82 | 42.6 | 0.000.01 | -14.12 | -14.12 | 2.00 | |
| 191 | 3:29:43.95 | 31:14:06.71 | 80 | 51.2 | 0.000.01 | -14.09 | -14.09 | 1.82 | |
| 192 | 3:29:44.02 | 31:15:10.42 | 80 | 28.5 | 0.000.11 | -14.15 | -14.15 | 2.20 | |
| Ch. | RA | Dec | RA | Dec | Sep. bb Abs. Flux: Absorbed flux. Tot. UnAbs. Flux: Total unabsorbed flux. | ||||||||
|---|---|---|---|---|---|---|---|---|---|---|---|---|---|
| ID | X-ray (2000) | Infrared (2000) aa The IR detections in multiple bands are matched to 1”, with the coordinates at the shortest detected wavelength listed. | ′′ | ||||||||||
| 1 | 3:29:03.03 | 31:15:17.09 | 3:29:02.97 | 31:15:16.73 | 0.364 | 13.3560.112 | 11.96890.069 | 11.5240.025 | 11.4750.052 | ||||
| 2 | 3:28:52.16 | 31:15:47.75 | 3:28:52.13 | 31:15:47.18 | 0.157 | 13.1610.021 | 12.4690.026 | 12.0290.022 | 11.3560.005 | 11.1120.006 | 10.8040.013 | 10.0010.001 | 7.83500.033 |
| 3 | 3:28:59.32 | 31:15:49.55 | 3:28:59.30 | 31:15:48.52 | 0.198 | 16.490 0.16 | 12.5280.027 | 10.4370.019 | 8.59410.002 | 8.07060.003 | 7.48370.003 | 6.41210.002 | 2.42700.032 |
| 4 | 3:29:02.91 | 31:16:01.64 | 3:29:02.89 | 31:16:01.03 | 0.268 | 12.8380.019 | 12.1770.033 | 11.9430.028 | 11.5410.043 | 10.8430.115 | |||
| 5 | 3:29:02.18 | 31:16:12.15 | 3:29:02.16 | 31:16:11.43 | 0.143 | 14.5260.030 | 13.8650.040 | 13.5670.034 | 13.2790.034 | 12.6920.057 | |||
| 8 | 3:29:16.72 | 31:16:19.45 | 3:29:16.67 | 31:16:18.29 | 0.113 | 11.4430.021 | 10.7480.028 | 10.4310.020 | 10.1660.003 | 10.1590.004 | 10.1520.009 | 10.1240.011 | |
| 9 | 3:28:56.99 | 31:16:22.97 | 3:28:56.94 | 31:16:22.28 | 0.145 | 13.7600.027 | 11.9230.024 | 11.0810.021 | 10.4530.003 | 10.2750.004 | 9.94560.008 | 8.87740.005 | 3.90400.031 |
| 10 | 3:28:55.19 | 31:16:25.46 | 3:28:55.14 | 31:16:24.73 | 0.273 | 13.0100.038 | 11.6560.054 | 10.9270.022 | 9.69160.005 | 9.41490.005 | 8.76450.006 | 7.97880.003 | |
| 11 | 3:28:55.09 | 31:16:29.29 | 3:28:55.05 | 31:16:28.74 | 0.200 | 13.5810.024 | 11.7050.026 | 10.6760.046 | 9.09310.003 | 8.62820.003 | 8.18080.003 | 7.37510.002 | 3.91400.040 |
| 12 | 3:28:59.25 | 31:16:30.94 | 3:28:59.34 | 31:16:31.56 | 1.485 | 17.039 0.25 | 15.6040.147 | 14.5540.105 | 13.9640.017 | 13.9000.024 | 13.9090.118 | ||
| 13 | 3:28:46.22 | 31:16:39.45 | 3:28:46.18 | 31:16:38.59 | 0.216 | 10.8750.017 | 10.0050.019 | 9.69000.018 | 9.31900.003 | 9.22690.003 | 8.88890.005 | 8.30180.004 | 6.82000.034 |
| 14 | 3:29:05.82 | 31:16:40.23 | 3:29:05.75 | 31:16:39.69 | 0.757 | 14.4880.055 | 11.6130.043 | 9.93100.026 | 8.48980.002 | 7.85640.003 | 7.22390.003 | 6.38570.001 | 3.70000.032 |
| 16 | 3:28:54.65 | 31:16:51.66 | 3:28:54.61 | 31:16:51.21 | 0.283 | 12.8600.020 | 11.1930.021 | 10.2320.019 | 9.35160.003 | 8.97900.003 | 8.54420.005 | 7.66310.002 | 4.58900.032 |
| 17 | 3:28:47.86 | 31:16:56.03 | 3:28:47.82 | 31:16:55.21 | 0.288 | 12.9400.021 | 11.7590.023 | 10.9090.019 | 9.86900.003 | 9.38710.003 | 9.08510.006 | 8.36650.003 | 5.59000.033 |
| 20 | 3:29:04.11 | 31:17:08.25 | 3:29:04.06 | 31:17:7.544 | 0.374 | 13.3100.021 | 12.6750.031 | 12.3130.022 | 11.9220.008 | 11.9420.011 | 11.9270.031 | 11.8110.056 | |
| 22 | 3:29:11.34 | 31:17:18.47 | 3:29:11.31 | 31:17:17.59 | 0.133 | 13.9770.024 | 13.3710.031 | 12.9150.026 | 12.3290.007 | 12.3350.010 | 12.3420.033 | 12.1380.047 | |
| 23 | 3:28:43.31 | 31:17:33.49 | 3:28:43.26 | 31:17:33.08 | 0.491 | 12.5880.020 | 10.8610.051 | 9.74700.036 | 7.75960.003 | 6.89100.002 | 5.95920.002 | 5.00150.001 | 1.62200.034 |
| 25 | 3:28:36.96 | 31:17:36.32 | 3:28:36.92 | 31:17:35.38 | 0.162 | 11.9610.018 | 10.6520.021 | 10.1150.019 | 9.69100.003 | 9.64420.003 | 9.56340.007 | 9.56350.008 | 8.88400.036 |
| 26 | 3:28:43.58 | 31:17:37.26 | 3:28:43.55 | 31:17:36.46 | 0.046 | 12.2190.035 | 10.9630.023 | 10.1380.019 | 8.92310.006 | 8.48450.006 | 6.36500.015 | 2.72000.038 | |
| 27 | 3:29:13.64 | 31:17:44.33 | 3:29:13.61 | 31:17:43.49 | 0.184 | 16.4410.129 | 14.2500.050 | 13.0280.032 | 12.0100.007 | 11.8550.008 | 11.7070.030 | 11.6760.064 | |
| 28 | 3:28:56.20 | 31:17:44.94 | 3:28:56.22 | 31:17:45.73 | 0.834 | 13.4780.023 | 12.6470.027 | 12.1700.025 | 11.6970.006 | 11.6180.007 | 11.5500.020 | 11.5380.038 | |
| 30 | 3:28:58.13 | 31:18:04.46 | 3:28:58.09 | 31:18:03.82 | 0.284 | 12.8090.020 | 11.7070.023 | 11.3450.021 | 11.0840.005 | 11.0800.006 | 10.9530.016 | 10.8310.019 | |
| 32 | 3:28:53.97 | 31:18:09.97 | 3:28:53.92 | 31:18:09.28 | 0.241 | 14.8190.058 | 12.2660.035 | 10.8780.022 | 9.99610.003 | 9.66450.004 | 9.20910.006 | 8.28470.003 | 4.83400.032 |
| 34 | 3:29:12.97 | 31:18:15.30 | 3:29:12.94 | 31:18:14.61 | 0.327 | 18.598 | 17.773 | 14.1150.049 | 9.18500.003 | 7.56880.003 | 6.65010.002 | 5.79540.001 | 2.60500.035 |
| 35 | 3:28:55.01 | 31:18:16.03 | 3:28:54.97 | 31:18:15.33 | 0.155 | 16.881 | 14.8860.089 | 13.1550.039 | 12.1500.010 | 11.8930.012 | 11.6700.024 | 11.5740.036 | |
| 36 | 3:28:51.05 | 31:18:18.82 | 3:28:51.01 | 31:18:18.48 | 0.379 | 11.3630.017 | 10.0700.017 | 9.18400.018 | 8.36690.002 | 8.00230.002 | 7.55750.002 | 6.56650.001 | 3.54000.044 |
| 37 | 3:29:20.43 | 31:18:35.08 | 3:29:20.42 | 31:18:34.25 | 0.304 | 14.4020.043 | 12.0100.032 | 10.4730.022 | 8.44370.002 | 7.90710.003 | 7.51220.002 | 6.61400.001 | 3.07400.032 |
| 38 | 3:29:29.27 | 31:18:35.76 | 3:29:29.25 | 31:18:34.77 | 0.208 | 12.5870.021 | 11.3740.027 | 10.9630.020 | 10.6050.004 | 10.6600.005 | 10.5940.012 | 10.0710.010 | 4.72400.032 |
| 39 | 3:28:56.66 | 31:18:36.47 | 3:28:56.64 | 31:18:35.64 | 0.303 | 12.2970.018 | 10.6940.021 | 9.70200.019 | 8.76540.003 | 8.41910.003 | 8.23140.004 | 7.54480.003 | 3.66600.031 |
| 40 | 3:29:03.43 | 31:18:40.02 | 3:29:03.39 | 31:18:39.95 | 0.358 | 15.8330.080 | 14.5480.067 | 14.0000.054 | 13.1560.017 | 13.0750.022 | 12.7890.067 | 12.3400.058 | |
| 43 | 3:28:56.15 | 31:19:09.15 | 3:28:56.08 | 31:19:08.58 | 0.180 | 19.530 | 18.248 | 16.182 0.121 | 11.2220.003 | 9.7060.003 | 8.8440.003 | 8.2620.003 | 6.1440.036 |
| 45 | 3:28:48.17 | 31:19:24.35 | 3:28:48.16 | 31:19:23.50 | 0.141 | 15.5300.063 | 14.6670.066 | 14.4860.093 | 14.2570.019 | 14.2710.028 | |||
| 47 | 3:28:36.54 | 31:19:30.07 | 3:28:36.52 | 31:19:28.93 | 0.533 | 12.8490.020 | 12.1280.026 | 11.8560.023 | 11.5530.005 | 11.5780.007 | 11.4880.018 | 11.5480.023 | |
| 51 | 3:28:57.73 | 31:19:48.84 | 3:28:57.69 | 31:19:48.13 | 0.259 | 13.0450.024 | 11.9750.029 | 11.3790.023 | 10.3760.007 | 10.0480.006 | 9.65570.009 | 8.67650.014 | 5.73000.032 |
| 52 | 3:28:57.45 | 31:19:51.09 | 3:28:57.41 | 31:19:50.56 | 0.413 | 12.1310.036 | 11.0550.044 | 10.6640.037 | 10.2460.004 | 10.2250.006 | 10.0640.012 | ||
| 53 | 3:28:51.22 | 31:19:55.36 | 3:28:51.19 | 31:19:54.89 | 0.270 | 11.7160.017 | 10.4930.021 | 9.89800.018 | 9.05580.002 | 8.78340.003 | 8.40140.004 | 7.32590.002 | 4.31900.032 |
| 56 | 3:29:12.82 | 31:20:08.69 | 3:29:12.79 | 31:20:7.706 | 0.193 | 14.6760.030 | 13.7810.035 | 13.2940.033 | 12.8540.012 | 12.7930.012 | 12.7050.098 | 12.7070.093 | |
| 60 | 3:29:08.35 | 31:20:20.27 | 3:29:08.32 | 31:20:20.34 | 0.199 | 14.6810.032 | 12.9040.028 | 12.0110.020 | 11.2680.005 | 11.1610.005 | 11.0350.017 | 10.9910.026 | |
| 61 | 3:28:46.89 | 31:20:28.54 | 3:28:46.87 | 31:20:27.78 | 0.227 | 14.8090.038 | 14.2460.052 | 13.7980.055 | 13.4920.013 | 13.5310.017 | 13.5060.072 | 13.357 0.13 | |
| 62 | 3:29:04.58 | 31:20:29.47 | 3:29:04.62 | 31:20:28.91 | 0.507 | 16.715 | 15.4640.128 | 13.7460.051 | 12.4960.009 | 12.3440.013 | 11.7620.086 | 11.8480.062 | |
| 67 | 3:29:04.95 | 31:20:39.19 | 3:29:04.94 | 31:20:38.55 | 0.461 | 15.575 | 14.6010.140 | 12.9750.066 | 11.2100.009 | 10.4890.006 | 9.76510.012 | 8.78600.007 | 4.71700.034 |
| 68 | 3:29:00.41 | 31:20:46.42 | 3:29:00.37 | 31:20:45.67 | 0.437 | 13.5600.022 | 12.3710.030 | 11.8010.022 | 11.3270.010 | 11.2980.017 | 11.4120.072 | 11.3650.090 | |
| 71 | 3:29:16.60 | 31:21:03.56 | 3:29:16.55 | 31:21:02.50 | 0.271 | 14.9830.041 | 13.3090.033 | 12.4280.022 | 11.7400.006 | 11.6840.007 | 11.5020.034 | 11.6570.041 | |
| 72 | 3:29:29.77 | 31:21:03.39 | 3:29:29.78 | 31:21:02.70 | 0.673 | 12.6490.021 | 11.6210.027 | 11.1650.018 | 10.6430.003 | 10.4810.005 | 10.0450.009 | 8.97830.005 | 6.08000.032 |
| 74 | 3:29:00.18 | 31:21:10.22 | 3:29:00.15 | 31:21:09.21 | 0.207 | 16.4660.150 | 14.5890.071 | 13.3490.041 | 12.0770.010 | 11.6530.012 | 11.3850.051 | 10.5370.040 | 7.07700.042 |
| 76 | 3:29:21.56 | 31:21:11.27 | 3:29:21.55 | 31:21:10.47 | 0.222 | 12.3930.019 | 11.7230.031 | 11.3720.020 | 10.9290.004 | 10.6920.005 | 10.3670.012 | 9.73900.012 | 6.64900.032 |
| 78 | 3:29:11.90 | 31:21:27.92 | 3:29:11.88 | 31:21:27.13 | 0.262 | 17.217 | 15.6990.115 | 12.8230.026 | 10.5350.008 | 9.70330.005 | 9.06010.039 | 8.27930.068 | |
| 79 | 3:29:09.16 | 31:21:44.63 | 3:29:09.15 | 31:21:44.56 | 0.761 | 14.477 | 14.8070.166 | 12.9740.050 | 10.8450.269 | ||||
| 80 | 3:28:59.57 | 31:21:47.43 | 3:28:59.54 | 31:21:46.78 | 0.263 | 12.6130.020 | 11.2600.023 | 10.3010.019 | 8.82530.002 | 8.45310.003 | 8.21460.004 | 7.44830.003 | 4.66700.031 |
| 81 | 3:29:03.88 | 31:21:49.44 | 3:29:03.86 | 31:21:48.71 | 0.243 | 11.5360.027 | 10.1380.031 | 9.21700.020 | 7.93930.001 | 7.60420.002 | 7.20560.004 | 6.35280.002 | 3.46300.034 |
| 82 | 3:29:07.75 | 31:21:56.91 | 3:29:07.74 | 31:21:57.52 | 0.634 | 15.273 | 13.8020.086 | 10.4280.041 | 6.59500.005 | 5.15460.002 | 4.16750.005 | 3.65480.026 | |
| 84 | 3:29:10.40 | 31:21:59.85 | 3:29:10.37 | 31:21:59.15 | 0.234 | 9.36800.027 | 7.98700.027 | 7.17300.017 | 6.62750.010 | 6.56930.011 | 6.04850.095 | ||
| 85 | 3:29:00.72 | 31:22:01.54 | 3:29:00.69 | 31:22:00.82 | 0.226 | 16.2360.103 | 13.2930.042 | 11.7640.025 | 10.7680.005 | 10.6260.005 | 10.4300.013 | 10.3760.012 | |
| 88 | 3:29:02.79 | 31:22:17.84 | 3:29:02.79 | 31:22:17.28 | 0.485 | 16.9290.175 | 14.7980.067 | 13.3230.030 | 12.1150.013 | 11.6040.011 | 11.1290.025 | 10.4550.034 | |
| 89 | 3:28:58.43 | 31:22:18.19 | 3:28:58.42 | 31:22:17.53 | 0.331 | 18.417 | 14.8050.086 | 11.8490.025 | 9.62020.003 | 8.31790.003 | 7.20480.003 | 6.28720.001 | 2.27300.032 |
| 92 | 3:28:56.27 | 31:22:28.01 | 3:28:56.30 | 31:22:27.92 | 0.219 | 15.8400.093 | 13.1630.041 | 11.8440.026 | 10.5450.004 | 9.97180.004 | 9.26240.006 | 8.27850.003 | 4.73900.031 |
| 94 | 3:29:10.81 | 31:22:30.74 | 3:29:10.79 | 31:22:30.13 | 0.329 | 14.8960.033 | 13.6720.033 | 12.9280.026 | 12.1750.141 | 12.0330.114 | |||
| 95 | 3:29:14.45 | 31:22:36.91 | 3:29:14.43 | 31:22:36.25 | 0.112 | 14.6060.027 | 13.5300.025 | 13.0350.022 | 12.4950.010 | 12.4360.011 | 12.3340.104 | 12.4900.461 | |
| 96 | 3:29:03.16 | 31:22:38.26 | 3:29:03.13 | 31:22:38.16 | 0.621 | 13.7240.026 | 12.3670.033 | 11.3230.020 | 10.2320.003 | 9.75830.004 | 9.29820.006 | 8.31020.005 | 4.92800.033 |
| 98 | 3:29:17.66 | 31:22:45.60 | 3:29:17.66 | 31:22:45.13 | 0.329 | 9.97300.019 | 8.91500.028 | 8.32400.020 | 7.21200.002 | 6.84220.002 | 6.29380.002 | 5.56340.001 | 2.86200.034 |
| 99 | 3:28:52.18 | 31:22:46.02 | 3:28:52.16 | 31:22:45.30 | 0.302 | 11.9820.017 | 11.0130.023 | 10.5620.019 | 10.0410.003 | 9.85840.003 | 9.55090.007 | 8.81800.004 | 6.33200.031 |
| 100 | 3:29:07.97 | 31:22:52.28 | 3:29:07.94 | 31:22:51.58 | 0.382 | 13.0020.026 | 11.1780.030 | 10.1930.020 | 8.87780.003 | 8.41850.003 | 7.92110.014 | 7.29250.053 | 4.91500.054 |
| 101 | 3:29:13.13 | 31:22:53.26 | 3:29:13.12 | 31:22:52.91 | 0.299 | 12.8670.019 | 11.1170.027 | 10.1090.020 | 8.69010.002 | 8.35370.002 | 7.90370.003 | 7.39200.006 | 5.23100.032 |
| 103 | 3:29:09.14 | 31:23:06.23 | 3:29:09.08 | 31:23:05.66 | 0.314 | 14.6490.040 | 12.9440.037 | 11.8920.028 | 10.5420.023 | 10.1230.028 | 8.93940.091 | ||
| 104 | 3:28:36.95 | 31:23:12.58 | 3:28:36.95 | 31:23:12.12 | 0.486 | 11.7810.017 | 10.8200.021 | 10.4970.019 | 10.2540.003 | 10.2460.004 | 10.1770.009 | 10.1200.011 | 10.1140.076 |
| 106 | 3:29:18.73 | 31:23:26.27 | 3:29:18.72 | 31:23:25.44 | 0.304 | 11.4460.021 | 10.6760.028 | 10.3300.020 | 9.52100.003 | 9.01620.003 | 8.35150.004 | 7.06110.004 | 3.81700.032 |
| 107 | 3:29:23.50 | 31:23:31.69 | 3:29:23.49 | 31:23:30.98 | 0.311 | 12.8450.024 | 11.7610.032 | 11.3560.022 | 11.0180.004 | 11.0350.006 | 10.9440.018 | 10.9560.060 | |
| 108 | 3:28:51.01 | 31:23:48.29 | 3:28:50.97 | 31:23:47.92 | 0.495 | 14.6590.036 | 12.3800.027 | 11.2430.021 | 10.4990.003 | 10.3880.004 | 10.2110.010 | 10.1520.011 | |
| 109 | 3:29:16.62 | 31:23:50.36 | 3:29:16.59 | 31:23:49.53 | 0.189 | 13.2540.021 | 11.8420.032 | 11.1810.022 | 10.2270.003 | 9.77080.003 | 9.20650.013 | 8.41310.036 | 6.40200.041 |
| 110 | 3:28:47.64 | 31:24:06.54 | 3:28:47.64 | 31:24:06.15 | 0.104 | 14.1990.036 | 12.6050.032 | 11.6600.023 | 10.3800.003 | 10.0510.004 | 9.76730.008 | 9.30220.006 | 6.55000.031 |
| 111 | 3:29:20.07 | 31:24:08.29 | 3:29:20.03 | 31:24:07.64 | 0.353 | 17.158 | 14.7000.075 | 12.0420.028 | 9.83340.009 | 9.03000.004 | 8.28770.041 | 7.33150.084 | 3.25700.034 |
| 112 | 3:29:22.04 | 31:24:15.78 | 3:29:22.04 | 31:24:15.37 | 0.387 | 11.9980.019 | 11.2660.030 | 11.0020.020 | 10.7230.005 | 10.7380.005 | 10.6900.040 | 10.7000.269 | |
| 116 | 3:29:19.78 | 31:24:58.24 | 3:29:19.77 | 31:24:57.23 | 0.199 | 8.83300.011 | 8.53800.035 | 8.35100.017 | 8.19540.002 | 8.20620.002 | 8.18870.017 | 8.22500.091 | |
| 123 | 3:28:57.10 | 31:15:02.74 | 3:28:57.06 | 31:15:02.89 | 0.285 | 18.314 | 15.778 | 14.0550.072 | 11.9460.006 | 11.2020.006 | 10.8530.017 | 10.8240.017 | |
| 128 | 3:28:51.04 | 31:16:32.44 | 3:28:51.05 | 31:16:32.46 | 0.922 | 13.2920.021 | 12.5160.026 | 12.1210.026 | 11.6000.005 | 11.4010.006 | 11.0730.015 | 10.3280.013 | 8.15200.034 |
| 129 | 3:28:55.29 | 31:17:35.78 | 3:28:55.24 | 31:17:35.40 | 0.138 | 15.0900.047 | 14.0730.052 | 13.4330.045 | 12.8980.010 | 12.7770.012 | 12.7170.038 | 12.7040.072 | |
| 132 | 3:29:30.46 | 31:19:02.92 | 3:29:30.38 | 31:19:3.464 | 0.866 | 12.1100.019 | 11.3910.031 | 11.0260.020 | 10.4770.003 | 9.73360.007 | 8.91260.005 | 6.07200.032 | |
| 135 | 3:29:23.22 | 31:20:31.39 | 3:29:23.14 | 31:20:30.34 | 1.129 | 12.3960.019 | 11.6540.030 | 11.2290.022 | 10.4100.003 | 10.1200.004 | 9.82400.009 | 8.98310.008 | 5.92400.032 |
| 137 | 3:28:44.11 | 31:20:53.45 | 3:28:44.07 | 31:20:52.86 | 0.455 | 14.2450.032 | 13.2350.035 | 12.6270.029 | 11.8620.006 | 11.6450.007 | 11.3140.017 | 10.5750.018 | 8.04300.033 |
| 143 | 3:29:24.84 | 31:24:06.69 | 3:29:24.83 | 31:24:06.28 | 0.255 | 14.4330.030 | 13.7660.036 | 13.3830.039 | 12.9380.012 | 12.9620.017 | 12.7080.188 | ||
| 148 | 3:29:23.73 | 31:25:09.14 | 3:29:23.69 | 31:25:09.55 | 0.919 | 14.0390.026 | 12.9450.033 | 12.3740.026 | 11.8370.018 | 11.8050.017 | 11.2430.174 | ||
| 149 | 3:29:04.21 | 31:25:15.74 | 3:29:04.17 | 31:25:15.15 | 0.387 | 13.6540.026 | 11.8090.029 | 10.8830.024 | 10.1500.003 | 10.0920.004 | 9.95210.010 | 9.91950.025 | |
| 152 | 3:29:02.99 | 31:25:45.64 | 3:29:03.20 | 31:25:45.32 | 0.367 | 15.663 0.029 | 14.6210.039 | 13.9750.029 | 13.2220.008 | 12.6420.008 | 12.2430.028 | 11.5590.049 | 7.3350.093 |
| 161 | 3:29:00.34 | 31:13:39.50 | 3:29:00.31 | 31:13:38.57 | 0.226 | 13.1600.022 | 11.9460.030 | 11.3370.022 | 10.9810.004 | 10.9980.005 | 10.9050.015 | 10.9210.018 | |
| 162 | 3:28:55.16 | 31:14:16.53 | 3:28:55.06 | 31:14:16.49 | 0.094 | 13.7330.039 | 12.9500.054 | 12.7480.099 | 12.6860.131 | ||||
| 163 | 3:28:57.24 | 31:14:19.94 | 3:28:57.21 | 31:14:18.91 | 0.056 | 8.19200.019 | 7.77300.017 | 7.66300.013 | 7.57570.002 | 7.55490.003 | |||
| 165 | 3:29:21.85 | 31:15:37.42 | 3:29:21.87 | 31:15:36.30 | 0.956 | 11.1760.019 | 10.1510.028 | 9.50400.018 | 8.50050.002 | 8.19940.002 | 7.94690.004 | 7.43430.002 | 4.81500.031 |
| 166 | 3:29:28.17 | 31:16:29.52 | 3:29:28.15 | 31:16:28.57 | 0.169 | 13.0540.021 | 12.5000.032 | 12.0910.022 | 11.6170.005 | 11.6000.007 | 11.5490.019 | 11.4680.023 | |
| 169 | 3:29:34.32 | 31:17:44.45 | 3:29:34.31 | 31:17:43.32 | 0.459 | 12.0260.018 | 11.3120.029 | 11.0650.024 | 10.7840.003 | 10.8160.005 | 10.7700.013 | 10.7190.013 | |
| 171 | 3:29:46.36 | 31:20:40.19 | 3:29:46.40 | 31:20:39.41 | 0.973 | 12.3600.019 | 11.7370.028 | 11.4740.025 | 11.1420.004 | 11.1390.006 | 11.0700.015 | 11.0230.018 | |
| 175 | 3:29:25.99 | 31:26:41.57 | 3:29:25.92 | 31:26:40.15 | 0.669 | 11.005 | 9.99200.033 | 9.5100 | 8.71610.002 | 8.21960.002 | 7.63670.003 | 6.46020.001 | 4.27900.031 |
| 176 | 3:29:26.81 | 31:26:48.33 | 3:29:26.81 | 31:26:47.51 | 0.393 | 10.8320.020 | 9.99200.027 | 9.67900.024 | 9.39660.002 | 9.43820.003 | 9.28630.007 | 8.93510.013 | |
| 179 | 3:29:04.73 | 31:11:35.05 | 3:29:04.73 | 31:11:34.89 | 0.798 | 18.499 | 15.642 | 14.4470.075 | 11.8070.007 | 10.9180.005 | 10.3010.011 | 9.70870.009 | 7.20400.033 |
| 183 | 3:29:32.87 | 31:27:13.51 | 3:29:32.86 | 31:27:12.65 | 0.947 | 13.3530.023 | 12.5980.029 | 12.2850.028 | 11.5090.005 | 11.3690.006 | 11.1750.015 | 10.6250.017 | 8.53500.036 |
| 188 | 3:29:30.55 | 31:27:27.10 | 3:29:30.54 | 31:27:28.00 | 1.801 | 13.8080.024 | 13.0140.033 | 12.5980.028 | 12.1950.007 | 12.1420.008 | 12.1070.028 | 12.0960.054 | |
| Spitzer ID aaIdentifiers from Gutermuth et al. (2008b). | RA (2000) | Dec (2000) | Class bb Three sources match to infrared detections with separations 1”: 12, 135, 188. | Chandra ID | G.ID ccIdentifiers from Getman et al. (2002). |
|---|---|---|---|---|---|
| 18 | 3:28:43.26 | 31:17:33.11 | I | 23 | 9 |
| 25 | 3:28:58.41 | 31:22:17.64 | I | 89 | 38 |
| 30 | 3:29:04.94 | 31:20:38.59 | FS | 67 | 57 |
| 31 | 3:29:07.76 | 31:21:57.34 | I | 82 | |
| 34 | 3:29:09.08 | 31:23:05.66 | I | 103 | 63 |
| 36 | 3:29:12.94 | 31:18:14.55 | I | 34 | 71 |
| 45 | 3:28:43.56 | 31:17:36.53 | FS | 26 | 10 |
| 46 | 3:28:44.08 | 31:20:52.89 | II | 137 | 11 |
| 47 | 3:28:46.18 | 31:16:38.66 | II | 13 | 14 |
| 48 | 3:28:47.63 | 31:24:06.14 | II | 110 | 15 |
| 49 | 3:28:47.82 | 31:16:55.32 | II | 17 | 16 |
| 50 | 3:28:51.02 | 31:18:18.53 | II | 36 | 19 |
| 51 | 3:28:51.06 | 31:16:32.63 | II | 128 | 20 |
| 52 | 3:28:51.19 | 31:19:54.94 | II | 53 | 21 |
| 53 | 3:28:52.13 | 31:15:47.24 | II | 2 | |
| 54 | 3:28:52.15 | 31:22:45.41 | II | 99 | 23 |
| 57 | 3:28:53.93 | 31:18:09.30 | II | 32 | 25 |
| 59 | 3:28:54.61 | 31:16:51.29 | II | 16 | 27 |
| 61 | 3:28:55.07 | 31:16:28.82 | II | 11 | 28 |
| 62 | 3:28:55.14 | 31:16:24.73 | II | 10 | |
| 63 | 3:28:56.08 | 31:19:08.58 | II | 43 | |
| 64 | 3:28:56.31 | 31:22:28.02 | FS | 92 | |
| 65 | 3:28:56.64 | 31:18:35.67 | II | 39 | 30 |
| 67 | 3:28:56.95 | 31:16:22.26 | II | 9 | 32 |
| 69 | 3:28:57.69 | 31:19:48.12 | II | 51 | 35 |
| 73 | 3:28:59.31 | 31:15:48.48 | FS | 3 | 39 |
| 74 | 3:28:59.55 | 31:21:46.76 | II | 80 | 41 |
| 75 | 3:29:00.15 | 31:21:09.27 | II | 74 | 42 |
| 76 | 3:29:02.15 | 31:16:11.41 | II | 5 | 47 |
| 77 | 3:29:02.79 | 31:22:17.36 | II | 88 | |
| 78 | 3:29:03.13 | 31:22:38.22 | II | 96 | 50 |
| 79 | 3:29:03.20 | 31:25:45.32 | II | 152 | |
| 80 | 3:29:03.39 | 31:18:40.06 | II | 40 | |
| 82 | 3:29:03.86 | 31:21:48.77 | II | 81 | 52 |
| 85 | 3:29:04.72 | 31:11:35.03 | II | 179 | |
| 88 | 3:29:05.76 | 31:16:39.68 | II | 14 | 58 |
| 91 | 3:29:07.93 | 31:22:51.56 | II | 100 | 61 |
| 97 | 3:29:10.40 | 31:21:59.29 | II | 84 | 64 |
| 103 | 3:29:11.87 | 31:21:27.09 | FS | 78 | 69 |
| 106 | 3:29:13.12 | 31:22:52.88 | II | 101 | 72 |
| 109 | 3:29:16.59 | 31:23:49.62 | II | 109 | 77 |
| 111 | 3:29:17.66 | 31:22:45.15 | II | 98 | 79 |
| 114 | 3:29:18.72 | 31:23:25.54 | FS | 106 | 81 |
| 115 | 3:29:20.04 | 31:24:07.57 | FS | 111 | 84 |
| 116 | 3:29:20.42 | 31:18:34.29 | II | 37 | 86 |
| 118 | 3:29:21.55 | 31:21:10.52 | II | 76 | 88 |
| 119 | 3:29:21.87 | 31:15:36.39 | II | 165 | 90 |
| 120 | 3:29:23.14 | 31:20:30.46 | II | 135 | |
| 123 | 3:29:25.92 | 31:26:40.12 | FS | 175 | |
| 125 | 3:29:29.78 | 31:21:02.79 | II | 72 | 103 |
| 126 | 3:29:30.39 | 31:19:03.45 | II | 132 | |
| 128 | 3:29:32.86 | 31:27:12.68 | II | 183 | 106 |
| 136 | 3:29:26.78 | 31:26:47.72 | TD | 176 | 100 |
| 137 | 3:29:29.26 | 31:18:34.85 | TD | 38 | 102 |
| 138 | 3:28:36.51 | 31:19:29.07 | III | 47 | 4 |
| 139 | 3:28:36.92 | 31:17:35.49 | III | 25 | 6 |
| 140 | 3:28:36.94 | 31:23:12.13 | III | 104 | 5 |
| 141 | 3:28:46.87 | 31:20:27.66 | III | 61 | |
| 142 | 3:28:48.17 | 31:19:23.49 | III | 45 | |
| 143 | 3:28:50.95 | 31:23:48.00 | III | 108 | |
| 144 | 3:28:54.96 | 31:18:15.35 | III | 35 | |
| 145 | 3:28:55.06 | 31:14:16.49 | III | 162 | |
| 146 | 3:28:55.25 | 31:17:35.42 | III | 129 | |
| 147 | 3:28:56.22 | 31:17:45.75 | III | 28 | |
| 148 | 3:28:57.04 | 31:15:02.85 | III | 123 | |
| 149 | 3:29:00.31 | 31:13:38.60 | III | 161 | 43 |
| 150 | 3:29:00.37 | 31:20:45.71 | III | 68 | 44 |
| 151 | 3:29:00.70 | 31:22:00.82 | III | 85 | 45 |
| 152 | 3:29:02.97 | 31:15:16.73 | III | 1 | 49 |
| 153 | 3:29:04.05 | 31:17:07.58 | III | 20 | 53 |
| 154 | 3:29:04.16 | 31:25:15.16 | III | 149 | 54 |
| 155 | 3:29:04.62 | 31:20:29.03 | III | 62 | |
| 156 | 3:29:08.32 | 31:20:20.45 | III | 60 | |
| 157 | 3:29:12.78 | 31:20:07.60 | III | 56 | 70 |
| 158 | 3:29:13.61 | 31:17:43.55 | III | 27 | |
| 159 | 3:29:16.55 | 31:21:02.49 | III | 71 | |
| 160 | 3:29:16.68 | 31:16:18.24 | III | 8 | 78 |
| 161 | 3:29:19.76 | 31:24:57.17 | III | 116 | |
| 162 | 3:29:22.04 | 31:24:15.41 | III | 112 | 91 |
| 163 | 3:29:23.49 | 31:23:30.94 | III | 107 | 93 |
| 164 | 3:29:28.15 | 31:16:28.64 | III | 166 | 101 |
| 165 | 3:29:34.30 | 31:17:43.42 | III | 169 | 107 |
| 171 | 3:29:11.30 | 31:17:17.67 | III | 22 | 67 |
| 173 | 3:29:30.54 | 31:27:28.02 | III | 188 | |
| 174 | 3:29:46.39 | 31:20:39.52 | III | 171 | |
| 177 | 3:29:24.82 | 31:24:06.23 | III | 143 | |
| 178 | 3:28:58.10 | 31:18:03.79 | III | 30 | 36 |
| 179 | 3:29:02.88 | 31:16:01.16 | III | 4 | 48 |
| 180 | 3:28:57.41 | 31:19:50.63 | III | 52 | 34 |
| 181 | 3:28:57.20 | 31:14:19.08 | III | 163 | 33 |
| 182 | 3:28:59.34 | 31:16:31.51 | III | 12 | |
| 183 | 3:29:09.16 | 31:21:44.56 | III | 79 | |
| 184 | 3:29:10.79 | 31:22:30.27 | III | 94 | 66 |
| 185 | 3:29:14.43 | 31:22:36.35 | III | 95 | 75 |
| 186 | 3:29:23.69 | 31:25:09.62 | III | 148 |
| Sp ID aaSp: Spitzer, Ch Chandra. See Tables 6 & 4 of Winston et al. (2009) for coordinates and magnitudes associated with spectra. | SpT | Class bbEvolutionary classification modified from that of Gutermuth et al. (2008b) based on Winston et al. (2007). I: Class I, FS: Flat Spectrum, II: Class II, TD: Transition Disk, III: Class III. | Ch ID | log() | log() | kT | ccA value of zero indicates that the source was blueward of the CTTS locus, a null value indicates a value could not be calculated. | Age ddIsochronal Age and Mass are determined by interpolation from the Baraffe (1998) tracks. Age of 0.2 indicates the source is very young but on edge of isochrone grid. | Mass ddIsochronal Age and Mass are determined by interpolation from the Baraffe (1998) tracks. Age of 0.2 indicates the source is very young but on edge of isochrone grid. | |||
|---|---|---|---|---|---|---|---|---|---|---|---|---|
| [K] | [] | [keV] | [] | [mag.] | [Myr] | [] | ||||||
| 9 | K8.01.5 | 0/I | 67 | -0.179 | 3892 | 3.22 | 28.57 | 1.30 | 0.86 | 1.5 | 1.01 | |
| 27 | K7.03.5 | FS | 74 | 0.265 | 3997 | 8.09 | 29.40 | 2.01 | 0.65 | 0.94 | 0.2 | 1.20 |
| 33 | M4.51.0 | FS | -0.867 | 3197 | 1.45 | 0.11 | 1.4 | 0.23 | ||||
| 36 | K6.52.5 | FS | 9 | 0.853 | 4147 | 27.1 | 0.95 | 0.2 | 1.13 | |||
| 40 | M0.01.5 | FS | 44 | -0.090 | 3821 | 4.26 | 29.02 | 1.80 | 0.86 | 0.94 | 0.9 | 0.95 |
| 53 | M4.02.0 | II | -1.281 | 3299 | 0.49 | 0.21 | 9.0 | 0.25 | ||||
| 54 | M9.05.0 | II | -1.778 | 2400 | 0.56 | 0.27 | 0.2 | 0.02 | ||||
| 59 | K7.51.5 | II | 77 | 0.356 | 3955 | 10.4 | 29.35 | 4.22 | 0.38 | 0.57 | 0.2 | 1.18 |
| 65 | K7.01.5 | II | -0.384 | 4060 | 1.70 | 0.68 | 6.2 | 1.01 | ||||
| 66 | M5.05.0 | II | -1.952 | 3154 | 0.12 | 12.9 | 0.13 | |||||
| 67 | M4.51.5 | II | -1.219 | 3226 | 0.62 | 0.53 | 5.6 | 0.22 | ||||
| 68 | M8.75.0 | II | -1.673 | 2493 | 0.61 | 0.98 | 0.2 | 0.02 | ||||
| 71 | M9.02.5 | II | 2.069 | 2400 | 3962 | 1.23 | ||||||
| 73 | M2.51.5 | II | 86 | 0.175 | 3487.5 | 11.3 | 29.70 | 2.41 | 0.51 | 0.70 | 0.2 | 0.75 |
| 74 | M4.01.5 | II | -0.878 | 3241 | 1.34 | 0.29 | 1.8 | 0.25 | ||||
| 78 | M0.01.5 | II | 84 | 0.018 | 3850 | 5.32 | 29.57 | 2.92 | 0.42 | 0.79 | 0.6 | 1.01 |
| 79 | M2.01.5 | II | -0.685 | 3560 | 1.43 | 0.23 | 5.1 | 0.52 | ||||
| 81 | M2.01.5 | II | 60 | -0.039 | 3560 | 6.36 | 30.03 | 3.53 | 0.78 | 0.58 | 0.2 | 0.70 |
| 82 | A7.02.5 | II | 1.129 | 7850 | 3.96 | 0. | 5.4 | |||||
| 83 | K2.01.5 | II | 71 | 0.926 | 4900 | 16.4 | 29.50 | 3.53 | 0.90 | 2.76 | 0.2 | 1.37 |
| 84 | M1.01.5 | II | 42 | -0.383 | 3705 | 2.45 | 29.51 | 1.25 | 0.69 | 0.37 | 2.0 | 0.75 |
| 85 | M3.01.5 | II | 68 | 0.406 | 3270 | 24.9 | 29.91 | 6.00 | 1.54 | 0.27 | 0.2 | 0.55 |
| 87 | M8.01.5 | II | 61 | -1.382 | 2710 | 0.85 | 0.02 | 0.2 | 0.05 | |||
| 88 | M7.51.5 | II | -1.551 | 2778 | 0.53 | 0. | 0.2 | 0.05 | ||||
| 91 | M5.51.5 | II | -1.691 | 3098 | 0.24 | 0.11 | 8.0 | 0.11 | ||||
| 94 | M1.51.0 | II | 57 | -0.430 | 3647 | 2.34 | 29.02 | 2.87 | 0.36 | 0.95 | 2.1 | 0.67 |
| 96 | M4.52.5 | II | -0.701 | 3226.5 | 2.05 | 0.76 | 1.1 | 0.26 | ||||
| 98 | M5.01.5 | II | 85 | -0.908 | 3125 | 1.44 | 0.24 | 1.1 | 0.19 | |||
| 100 | M4.51.5 | II | 59 | -0.608 | 3415.5 | 2.03 | 29.20 | 1.62 | 0.09 | 0.36 | 1.9 | 0.40 |
| 101 | M4.01.0 | II | 87 | -0.861 | 3255 | 1.37 | 30.65 | 4.07 | 0.49 | 0.13 | 1.8 | 0.26 |
| 102 | M5.05.0 | II | -2.102 | 3111 | 0.09 | 0. | 13.8 | 0.11 | ||||
| 103 | K2.51.5 | II | 0.421 | 4832 | 5.42 | 0.42 | 2.4 | 1.37 | ||||
| 104 | M0.51.5 | II | 0.137 | 3763 | 7.65 | 0.83 | 0.2 | 0.97 | ||||
| 105 | K1.01.5 | II | 73 | 1.646 | 5080 | 74.5 | 31.12 | 3.23 | 3.10 | 3.69 | 0.2 | |
| 122 | M3.51.5 | TD | 1.694 | 3342.5 | 443. | 0.89 | ||||||
| 124 | K6.54.5 | TD | 0.090 | 4161 | 4.59 | 0. | 1.0 | 1.31 | ||||
| 127 | M2.01.5 | TD | 1.091 | 3560 | 85.9 | 1.33 | ||||||
| 128 | M3.51.5 | TD | 46 | -0.934 | 3371 | 1.01 | 29.05 | 0.98 | 0.38 | 0.06 | 4.9 | 0.33 |
| 134 | M2.01.5 | TD | 1.203 | 3560 | 111. | 1.35 | ||||||
| 156 | M2.05.0 | TD | -0.421 | 3589 | 2.56 | 0.90 | 1.8 | 0.60 | ||||
| 157 | M1.03.5 | TD | 45 | -0.989 | 3690 | 0.618 | 29.27 | 0.87 | 0.53 | 0.24 | 14.6 | 0.61 |
| 158 | M1.01.5 | TD | 2.949 | 3705 | 5290. | 6.26 | ||||||
| 166 | M5.01.0 | TD | -0.779 | 3125 | 1.94 | 0.46 | 0.8 | 0.22 | ||||
| 170 | M3.51.5 | TD | 1.131 | 3342.5 | 121. | 1.06 | ||||||
| 176 | M4.01.5 | TD | 0.433 | 3270 | 26.5 | 1.32 | 0.2 | 0.56 | ||||
| 190 | M2.01.5 | III | 88 | 0.101 | 3560 | 8.80 | 29.14 | 1.84 | 0.37 | 1.08 | 0.2 | 0.78 |
| 192 | A0.0 | III | 69 | 1.884 | 9520 | 10.4 | 29.47 | 0.80 | 0.01 | 0. | 0.2 | |
| 193 | A0.0 | III | 50 | 1.480 | 9520 | 4.11 | 2.76 | 1.6 | ||||
| 196 | M5.01.5 | III | 76 | -0.309 | 3125 | 5.75 | 29.01 | 10.2 | 0.010 | 1.10 | 0.2 | 0.29 |
| 199 | M2.51.5 | III | 40 | 0.308 | 3487.5 | 15.4 | 29.63 | 2.48 | 0.45 | 2.71 | 0.2 | 0.76 |
| 201 | M5.01.0 | III | 62 | -1.309 | 3125 | 0.57 | 28.62 | 1.01 | 0.01 | 0. | 3.7 | 0.15 |
| 203 | M5.01.5 | III | 51 | -1.715 | 3125 | 0.22 | 0.02 | 9.2 | 0.12 | |||
| 204 | M8.55.0 | III | 65 | -1.581 | 2524 | 0.72 | 0.29 | 0.2 | 0.02 | |||
| 205 | K5.01.5 | III | 64 | -0.374 | 4350 | 1.32 | 29.75 | 2.34 | 0.17 | 0.16 | 11.0 | 1.01 |
| 209 | M4.51.5 | III | 41 | -0.672 | 3197.5 | 2.27 | 29.11 | 1.91 | 0.45 | 0.79 | 0.9 | 0.26 |
| 215 | M7.01.5 | III | 58 | -0.345 | 2880 | 7.34 | 29.36 | 4.25 | 0.80 | 0.11 | 0.2 | 0.22 |
| 216 | M0.51.5 | III | 80 | 0.698 | 3777.5 | 27.4 | 30.03 | 2.94 | 1.09 | 1.68 | 0.2 | 0.96 |
| 220 | A3.0 | III | 36 | 0.223 | 8720 | 0.32 | 0. | 17.5 | 1.33 | |||
| 221 | K7.51.5 | III | 37 | -0.007 | 3955 | 4.50 | 29.70 | 1.35 | 0.34 | 0.47 | 0.9 | 1.09 |
| 225 | G2.51.0 | III | 56 | 0.688 | 5851 | 4.66 | 30.31 | 2.25 | 0.37 | 0.47 | 8.1 | |
| 230 | K5.02.5 | [III] | -0.037 | 4321 | 2.94 | 0.69 | 2.7 | 1.26 | ||||
| 232 | M1.05.0 | [III] | -0.240 | 3705 | 3.41 | 0.59 | 1.2 | 0.78 | ||||
| 233 | M4.52.0 | [III] | -1.285 | 3197 | 0.55 | 0.47 | 5.6 | 0.19 | ||||
| 235 | K6.54.0 | [III] | -0.417 | 4161 | 1.42 | 0.62 | 8.8 | 0.98 |
| Sp ID aaSp: Spitzer, Ch Chandra. See Table 2 & Tables 2 & 3 of Gutermuth et al. (2008b) for coordinates and magnitudes associated with spectra. | SpT | Class bb0/I: Class 0/I, FS: flat spectrum, II: Class II, TD: Transition Disk, III: X-ray Detected Class III. The [III] are the new candidate Class IIIs with detected absorption. | Ch ID bb0/I: Class 0/I, FS: flat spectrum, II: Class II, TD: Transition Disk, III: X-ray Detected Class III. The [III] are the new candidate Class IIIs with detected absorption. | log() | log() | kT | ccA value of zero indicates that the source was blueward of the CTTS locus, a null value indicates a value could not be calculated. | Age ddIsochronal Age and Mass are determined by interpolation from the Baraffe (1998) tracks. Age of 0.2 indicates the source is very young but on edge of isochrone grid. | Mass ddIsochronal Age and Mass are determined by interpolation from the Baraffe (1998) tracks. Age of 0.2 indicates the source is very young but on edge of isochrone grid. | |||
|---|---|---|---|---|---|---|---|---|---|---|---|---|
| [K] | [] | [keV] | [] | [mag.] | [Myr] | [] | ||||||
| 18 | K7.01.0 | 0/I | 23 | 0.066 | 4089 | 4.670 | 29.93 | 3.95 | 2.78 | 0.9 | 1.23 | |
| 45 | M5.01.0 | II | 26 | -0.420 | 3125 | 4.461 | 29.71 | 3.73 | 0.35 | 0.41 | 0.2 | 0.23 |
| 46 | M7.51.0 | II | 137 | -1.533 | 2829 | 0.511 | 27.88 | 1.29 | 0.22 | 0.6 | 0.06 | |
| 47 | M3.01.5 | II | 13 | -0.101 | 3415 | 6.514 | 29.65 | 1.04 | 0.11 | 0.26 | 0.2 | 0.58 |
| 48 | M4.01.5 | II | 110 | -0.793 | 3270 | 1.576 | 28.88 | 2.22 | 0.89 | 0.83 | 1.6 | 0.28 |
| 49 | M8.01.0 | II | 17 | -0.918 | 2710 | 2.504 | 28.85 | 2.32 | 0.18 | 0.27 | 0.2 | 0.05 |
| 50 | M4.51.0 | II | 36 | -0.051 | 3197.5 | 9.516 | 29.12 | 6.11 | 0.17 | 0.41 | 0.2 | 0.44 |
| 51 | M4.01.0 | II | 128 | -1.250 | 3255.5 | 0.560 | 27.85 | 3.25 | 0.04 | 7.0 | 0.23 | |
| 52 | K7.01.0 | II | 53 | 0.005 | 4039 | 4.262 | 30.05 | 1.72 | 0.32 | 0.57 | 1.1 | 1.17 |
| 53 | M7.02.0 | II | 2 | -1.361 | 2846 | 0.742 | 28.11 | 0.96 | 0.10 | 0. | 0.2 | 0.07 |
| 54 | M2.51.5 | II | 99 | -0.467 | 3473 | 2.623 | 29.54 | 2.44 | 0.13 | 0.29 | 1.8 | 0.48 |
| 55 | M5.01.0 | II | -1.440 | 3154 | 0.410 | 0. | 6.2 | 0.16 | ||||
| 57 | K7.01.5 | II | 32 | 0.156 | 4060 | 5.903 | 29.90 | 2.19 | 1.29 | 1.94 | 0.5 | 1.22 |
| 58 | M5.01.0 | II | -0.910 | 3098 | 1.492 | 0.29 | 0.9 | 0.18 | ||||
| 59 | M1.02.5 | II | 16 | -0.096 | 3734 | 4.614 | 29.72 | 2.90 | 0.52 | 0.93 | 0.8 | 0.85 |
| 61 | M3.01.5 | II | 11 | -0.200 | 3415 | 5.193 | 28.36 | 2.37 | 0.81 | 1.20 | 0.6 | 0.54 |
| 62 | M0.51.5 | II | 10 | -0.453 | 3792 | 1.905 | 29.03 | 5.17 | 0.28 | 0.65 | 3.9 | 0.83 |
| 64 | M2.01.5 | II | 92 | -0.129 | 3560 | 5.171 | 28.51 | 1.83 | 0.96 | 2.18 | 0.5 | 0.66 |
| 65 | M1.51.5 | II | 39 | 0.011 | 3632.5 | 6.598 | 29.56 | 2.41 | 0.75 | 0.80 | 0.2 | 0.78 |
| 67 | M2.51.5 | II | 9 | -0.204 | 3487.5 | 4.733 | 28.20 | 2.37 | 0.41 | 1.30 | 0.7 | 0.58 |
| 69 | M3.51.5 | II | 51 | -0.854 | 3371.5 | 1.211 | 29.79 | 2.85 | 0.24 | 0.32 | 3.6 | 0.33 |
| 71 | M6.01.5 | II | -1.473 | 2990 | 0.471 | 0.42 | 2.4 | 0.09 | ||||
| 73 | K2.01.5 | II | 3 | 1.195 | 4900 | 30.44 | 30.48 | 2.39 | 1.46 | 3.53 | 0.2 | 1.37 |
| 76 | M3.51.0 | II | 5 | -1.811 | 3371.5 | 0.133 | 28.48 | 0.84 | 0.02 | 0. | 17.6 | 0.26 |
| 78 | M2.51.0 | II | 96 | -0.970 | 3458.5 | 0.838 | 28.49 | 0.74 | 0.36 | 8.4 | 0.41 | |
| 82 | K6.01.5 | II | 81 | 0.161 | 4234 | 5.057 | 30.08 | 2.40 | 0.54 | 0.54 | 0.9 | 1.38 |
| 88 | A3 | II | 14 | 1.394 | 8720 | 4.799 | 29.89 | 3.40 | 1.36 | 2.18 | 2.5 | |
| 91 | M2.51.5 | II | 100 | -0.283 | 3487.5 | 3.948 | 29.81 | 2.21 | 1.34 | 1.16 | 1.1 | 0.34 |
| 94 | M5.01.0 | II | -1.410 | 3098 | 0.473 | 0.26 | 4.1 | 0.14 | ||||
| 101 | M4.01.5 | II | -0.913 | 3270 | 1.196 | 1.27 | 2.4 | 0.26 | ||||
| 104 | M4.51.5 | II | -1.265 | 3154 | 0.613 | 0.07 | 4.0 | 0.17 | ||||
| 105 | M8.01.0 | II | -2.212 | 2710 | 0.127 | 0. | 6.3 | 0.04 | ||||
| 106 | M3.01.5 | II | 101 | -0.076 | 3415 | 6.899 | 28.92 | 2.41 | 1.10 | 1.02 | 0.2 | 0.59 |
| 109 | M3.01.0 | II | 109 | -0.492 | 3444 | 2.562 | 29.48 | 2.69 | 0.66 | 0.81 | 1.7 | 0.45 |
| 111 | M0.01.5 | II | 98 | 0.432 | 3821 | 14.21 | 30.72 | 2.46 | 0.28 | 0.31 | 0.2 | 1.00 |
| 114 | M0.01.5 | II | 106 | -0.404 | 3892 | 1.923 | 29.65 | 1.03 | 0.20 | 0.08 | 4.4 | 0.93 |
| 116 | K6.01.5 | II | 37 | 0.035 | 4205 | 3.885 | 29.47 | 4.05 | 2.07 | 1.55 | 1.4 | 1.31 |
| 118 | M4.51.5 | II | 76 | -0.967 | 3197.5 | 1.155 | 29.13 | 1.28 | 0.17 | 1.9 | 0.22 | |
| 119 | K4.03.0 | II | 165 | -0.026 | 4566 | 2.423 | 29.51 | 3.21 | 3.38 | 0.21 | 5.5 | 1.28 |
| 120 | M4.51.5 | II | 135 | -0.939 | 3197.5 | 1.230 | 28.26 | 0.84 | 0.34 | 1.8 | 0.22 | |
| 121 | M4.51.5 | II | -1.257 | 3197.5 | 0.591 | 0.16 | 5.2 | 0.19 | ||||
| 125 | M4.51.5 | II | 72 | -0.687 | 3197.5 | 2.201 | 28.73 | 2.10 | 0.09 | 0.38 | 0.9 | 0.26 |
| 127 | M3.01.0 | II | -0.994 | 3429.5 | 0.819 | 0.38 | 8.0 | 0.38 | ||||
| 128 | M4.51.5 | II | 183 | -1.260 | 3226.5 | 0.567 | 28.69 | 3.32 | 0.08 | 6.2 | 0.21 | |
| 131 | M7.01.5 | II | -1.723 | 2891 | 0.302 | 0. | 3.8 | 0.06 | ||||
| 133 | M4.51.5 | II | -0.733 | 3197.5 | 1.978 | 0. | 1.1 | 0.25 | ||||
| 136 | K7.51.5 | TD | 176 | -0.019 | 3997 | 4.197 | 30.45 | 1.34 | 0.15 | 0.22 | 1.1 | 1.13 |
| 137 | K7.51.5 | III | 38 | -0.308 | 3997 | 2.158 | 30.28 | 5.18 | 0.44 | 0.64 | 3.5 | 1.02 |
| 138 | M4.01.5 | III | 47 | -1.076 | 3299 | 0.793 | 28.73 | 0.86 | 0.11 | 0.07 | 5.5 | 0.27 |
| 139 | M0.01.5 | III | 25 | 0.009 | 3850 | 5.213 | 29.81 | 2.04 | 0.29 | 0.74 | 0.7 | 1.01 |
| 140 | M1.01.0 | III | 104 | -0.294 | 3690.5 | 3.064 | 29.81 | 1.35 | 0.20 | 0.38 | 1.4 | 0.75 |
| 143 | M4.01.5 | III | 108 | -0.139 | 3270 | 7.100 | 29.80 | 2.58 | 1.59 | 1.74 | 0.2 | 0.48 |
| 149 | M3.01.5 | III | 161 | -0.707 | 3415 | 1.614 | 29.96 | 2.28 | 0.32 | 0.54 | 2.6 | 0.38 |
| 150 | M4.51.5 | III | 68 | -0.890 | 3226.5 | 1.331 | 28.39 | 1.14 | 0.34 | 0.54 | 1.7 | 0.24 |
| 151 | M1.51.5 | III | 85 | -0.017 | 3632.5 | 6.172 | 29.09 | 1.44 | 1.24 | 2.43 | 0.2 | 0.77 |
| 154 | M2.01.5 | III | 149 | -0.169 | 3560 | 4.719 | 29.05 | 2.54 | 0.76 | 1.25 | 0.7 | 0.65 |
| 156 | M4.01.5 | III | 60 | -0.703 | 3270 | 1.938 | 29.00 | 0.71 | 1.88 | 1.17 | 1.3 | 0.29 |
| 157 | M7.51.5 | III | 56 | -1.796 | 2812 | 0.285 | 29.16 | 0.34 | 0.87 | 0.15 | 3.3 | 0.05 |
| 159 | M2.01.5 | III | 71 | -0.911 | 3560 | 0.854 | 28.34 | 1.72 | 0.96 | 1.02 | 10.3 | 0.51 |
| 160 | M3.51.5 | III | 8 | -0.565 | 3342.5 | 2.441 | 29.26 | 1.08 | 0. | 1.3 | 0.36 | |
| 161 | A0 | III | 116 | 1.404 | 9520 | 3.462 | 29.31 | 0.95 | 0.74 | 0. | 2.4 | |
| 162 | M3.51.0 | III | 112 | -0.713 | 3386 | 1.648 | 29.01 | 1.05 | 0.09 | 2.1 | 0.36 | |
| 163 | M3.51.5 | III | 107 | -0.654 | 3342.5 | 1.987 | 29.94 | 2.24 | 0.29 | 0.51 | 1.5 | 0.34 |
| 164 | M7.51.0 | III | 166 | -1.377 | 2761 | 0.807 | 29.22 | 1.12 | 0.06 | 0. | 0.2 | 0.06 |
| 165 | M3.01.5 | III | 169 | -0.730 | 3444 | 1.481 | 29.99 | 2.46 | 0.04 | 0.08 | 3.3 | 0.41 |
| 167 | M3.01.5 | [III] | -0.626 | 3444 | 1.880 | 0.34 | 2.4 | 0.42 | ||||
| 170 | M3.51.0 | [III] | -2.116 | 3313.5 | 0.071 | 0. | 19.3 | 0.17 | ||||
| 174 | M4.51.5 | III | 171 | -0.968 | 3226.5 | 1.110 | 29.04 | 0.86 | 0.18 | 0. | 2.3 | 0.24 |
| 175 | M3.01.0 | [III] | -1.783 | 3386 | 0.140 | 0. | 17.8 | 0.27 | ||||
| 176 | M3.01.5 | [III] | -0.696 | 3429.5 | 1.627 | 0.26 | 2.7 | 0.39 | ||||
| 177 | M6.51.5 | III | 143 | -1.856 | 2957 | 0.204 | 28.10 | 0.94 | 0. | 6.9 | 0.07 | |
| 178 | M0.51.0 | III | 30 | -0.552 | 3748.5 | 1.588 | 29.31 | 1.00 | 0.53 | 0.53 | 5.3 | 0.76 |
| 179 | M1.51.0 | III | 4 | -1.077 | 3618 | 0.546 | 29.08 | 1.00 | 0.01 | 14.9 | 0.56 | |
| 180 | M4.01.5 | III | 52 | -0.379 | 3284.5 | 4.020 | 29.55 | 0.77 | 0.70 | 0.50 | 0.6 | 0.36 |