Stripe order in superconducting for
Abstract
The correlations between stripe order, superconductivity, and crystal structure in single crystals have been studied by means of x-ray and neutron diffraction as well as static magnetization measurements. The derived phase diagram shows that charge stripe order (CO) coexists with bulk superconductivity in a broad range of doping around , although the CO order parameter falls off quickly for . Except for , the onset of CO always coincides with the transition between the orthorhombic and the tetragonal low temperature structures. The CO transition evolves from a sharp drop at low to a more gradual transition at higher , eventually falling below the structural phase boundary for optimum doping. With respect to the interlayer CO correlations, we find no qualitative change of the stripe stacking order as a function of doping, and in-plane and out-of-plane correlations disappear simultaneously at the transition. Similarly to the CO, the spin stripe order (SO) is also most pronounced at . Truly static SO sets in below the CO and coincides with the first appearance of in-plane superconducting correlations at temperatures significantly above the bulk transition to superconductivity (SC). Indications that bulk SC causes a reduction of the spin or charge stripe order could not be identified. We argue that CO is the dominant order that is compatible with SC pairing but competes with SC phase coherence. Comparing our results with data from the literature, we find good agreement if all results are plotted as a function of instead of the nominal , where represents an estimate of the actual Ba content, extracted from the doping dependence of the structural transition between the orthorhombic phase and the tetragonal high-temperature phase.
pacs:
74.72.Dn, 74.25.Ha, 61.12.-qI Introduction
The prototypical high-temperature superconductorBednorz and Müller (1986) is particularly well known for its unique doping dependence of the bulk superconducting (SC) phase. Moodenbaugh et al. (1988) While its sister compound , like most other high temperature superconductors, displays a dome shaped SC phase boundary , Takagi et al. (1989); Broun (2008) in the Ba-based compound shows a deep depression centered at . Moodenbaugh et al. (1988); Yamada and Ido (1992) It was discovered early on that the so-called 1/8-anomaly is accompanied by a structural transition from low-temperature orthorhombic (LTO) to low-temperature tetragonal (LTT) symmetry,Axe et al. (1989); Billinge et al. (1993) not observed in pure , and that bulk SC is replaced by some kind of antiferromagnetic (AF) order. Kumagai et al. (1991); Luke et al. (1991); Sera et al. (1989); Arai et al. (2003) The complex nature of the magnetic phase was first identified by neutron and x-ray diffraction experiments for an analogous phase in , Tranquada et al. (1995); Niemöller et al. (1999); von Zimmermann et al. (1998); Ichikawa et al. (2000) and later on confirmed in , Fujita et al. (2002a); Kimura et al. (2003) , Fujita et al. (2004); Abbamonte et al. (2005); Kim et al. (2008a) and . Hücker et al. (2007); Fink et al. (2009) Undoped (), all of these compounds are quasi two-dimensional commensurate spin Heisenberg antiferromagnets. Thio et al. (1988); Crawford et al. (1993); Hücker et al. (2004)
But doped with sufficient charge carriers, they exhibit incommensurate nuclear and magnetic superstructure reflections (which we will describe below). Among the debated interpretations is the so-called stripe model in which the charge carriers in the planes segregate into hole rich stripes, thus forming antiphase boundaries between intermediate spin stripes with locally AF correlations. Tranquada et al. (1995); Zaanen and Gunnarsson (1989); Kivelson et al. (2003); Vojta (2009) In the LTT phase, which breaks the four-fold rotational symmetry of the planes, the electron-lattice coupling is believed to play a central role in the pinning of stripes, Crawford et al. (1991); Büchner et al. (1994); Tranquada et al. (1996); Pickett et al. (1991); Kivelson et al. (1998) although recent experiments under pressure revealed that stripes can break the symmetry even in the absence of long range LTT order. Hücker et al. (2010)
So far, is the only system with stripe-ordered LTT phase where magnetic and charge order have been studied with diffraction on both sides of . Ichikawa et al. (2000) The results were interpreted as indicating that local magnetic order (rather than charge stripe order) is responsible for the suppression of bulk SC, and that charge stripes are compatible with SC as long as the magnetic correlations remain dynamic. More recent experimental and theoretical results on support the revised view that, in principle, static spin and charge stripes are compatible with SC pairing, but, due to their orthogonal arrangement in adjacent planes, they compete with superconducting phase order. Li et al. (2007); Tranquada et al. (2008); Berg et al. (2007, 2009)
It is desirable to analyze in a broader range of doping to test the generality of the observations. This system has two advantages over rare-earth-doped : First, only one element is substituted for La. Second, the Ba2+ ions are non-magnetic, in contrast to, e.g., the Nd3+ ions whose large magnetic moments interact with the spins of the Cu2+ ions in the planes. Wakimoto et al. (2003); Nachumi et al. (1998) Recent progress in the synthesis of single crystals with has triggered numerous studies on the stripe order in the underdoped regime. Abe et al. (1999); Adachi et al. (2001); Fujita et al. (2004); Adachi et al. (2005); Abbamonte et al. (2005); Valla et al. (2006); Xu et al. (2007); Zhao et al. (2007); Kim et al. (2008a); Dunsiger et al. (2008a, b); Kim et al. (2009); Adachi et al. (2009)
Despite previous work, however, the doping dependence of many properties requires further clarification, such as the absolute intensities of CO and SO satellite reflections, the stripe correlations between the planes, the melting of the stripe order, and the compatibility with the generic stripe phase diagram. Furthermore, there is a great lack of information for because crystal growth becomes progressively more challenging with increasing .
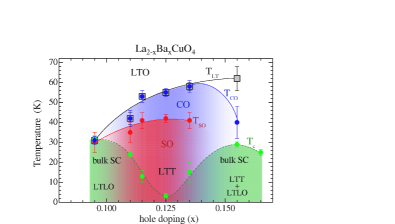
These are the issues addressed in the present study on single crystals with . We have characterized the charge stripe order with high-energy single-crystal x-ray diffraction (XRD), by probing the associated lattice modulation. von Zimmermann et al. (1998); Niemöller et al. (1999); Kimura et al. (2003) That a modulation of the electron density truly exists, has previously been demonstrated in Ref. Abbamonte et al., 2005 for by means of resonant soft x-ray scattering. We have investigated the spin stripe order both in the traditional way, with neutron diffraction (ND), as well as in a less conventional way by tracing a recently identified weak ferromagnetic contribution to the normal state magnetic susceptibility. Hücker et al. (2008) The various structural phases have been studied mostly with XRD, and to some extent with ND, and the SC phase with shielding and Meissner fraction measurements. As a result, we obtain the temperature versus Ba-concentration phase diagram displayed in Fig. 1. One of the key features is that charge stripe order exists over the entire range of that we have studied, including the two bulk SC crystals with the lowest and highest and maximum on the order of 30 K. According to our quantitative analysis, the stripe order for these end compositions is already extremely weak, while it is most pronounced at . In the underdoped regime the CO always disappears at the low temperature structural transition, and for three crystals we can show that it melts isotropically. On the other hand, the onset of bulk SC left no noticeable mark in our CO and SO data.
The rest of the paper is organized as follows: In Sec. II we describe the experimental methods and the choice of reciprocal lattice used to index the reflections. In Sec. III we present four subsections dedicated to our results on crystal structure, charge stripe order, spin stripe order, and superconductivity. In Sec. IV we summarize the doping dependence of the various properties as a function of the nominal and an estimated actual Ba content, compare our results with the literature, and in Sec. V finish with a short conclusion.
II Experimental
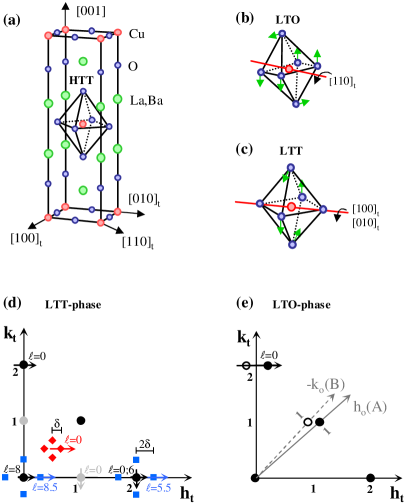
A series of six single crystals with has been grown at Brookhaven with the traveling-solvent floating-zone method. Previously reported results on some of the compositions, in particular on the crystal, have demonstrated a very high sample quality. Tranquada et al. (2004); Valla et al. (2006); Homes et al. (2006); Li et al. (2007); Kim et al. (2008a, b); Hücker et al. (2008); Tranquada et al. (2008); He et al. (2009); Hücker et al. (2010) Since the composition of single crystals can deviate from their nominal stoichiometry, it has been vital to measure structure, stripe order, and SC on pieces of the same crystal. In Fig. 2(a) we show the unit cell of the high-temperature tetragonal (HTT) phase, with space group . Although the supercells of the low temperature phases LTO (space group ) and LTT (space group ) have a larger basal plane rotated by 45∘ degrees, we nevertheless specify the scattering vectors in all phases in units of of the HTT cell with lattice parameters and . Maeno et al. (1991a) In order to express the orthorhombic strain in the LTO phase, we will refer to the lattice constants and of the LTO supercell, which are larger than by a factor of .
The XRD experiments were performed with the triple-axis diffractometer at wiggler beamline BW5 at DESY. Bouchard et al. (1998) To create optimum conditions for studying the bulk properties in transmission geometry, most samples were disk shaped with a diameter ( mm) significantly larger than the beam size of mm2, and a thickness ( mm) close to the penetration depth of the 100 keV photons ( ). Count rates are normalized to a storage ring current of 100 mA. To evaluate the -dependence of a superstructure reflection relative to , we have normalized its intensity with an integrated intensity ratio of a nearby fundamental Bragg reflection. For example, to normalize the (1,0,0) and (2+2,0,5.5) reflections, we have applied the factors and of the (2,0,0) and (2,0,6) Bragg reflections, respectively.
The ND data for , 0.125 and 0.135 were collected with the triple-axis spectrometer SPINS located at the NIST Center for Neutron Research using beam collimations of --S--open (S = sample) with fixed final energy meV. The crystal was studied at triple-axis spectrometer HB-1 at the High Flux Isotope Reactor, Oak Ridge National Laboratory, using beam collimations of --S-- with meV. The cylindrical crystals, with a typical weight between 5 g and 10 g, were mounted with their -zone parallel to the scattering plane. Doping dependencies of intensities were obtained by normalizing the data with the irradiated sample volume.
The static magnetic susceptibility () measurements, used to study the spin stripe phase and the SC phase, were performed with a superconducting quantum interference device (SQUID) magnetometer for and . For these experiments crystal pieces, with a typical weight of 0.5 g, were used.
III Results
III.1 Crystal Structure
Since the discovery of superconductivity in in the late eighties,Bednorz and Müller (1986) the crystal structure, displayed in Fig. 2, has been studied intensively. Axe et al. (1989) So far most diffraction results were obtained on polycrystals, Axe et al. (1989); Maeno et al. (1991a); Billinge et al. (1993) and only recently have single-crystal data been reported. Fujita et al. (2004); Wakimoto et al. (2006); Zhao et al. (2007)
In the doping range considered here, undergoes two structural transitions with decreasing temperature: a second-order transition from HTT to LTO, and a first-order transition from LTO to another low temperature phase which can either be LTT or the low-temperature less-orthorhombic (LTLO) phase (space group ) which is a possible intermediate phase between LTO and LTT. Crawford et al. (1991) While the HTT phase is characterized by untilted octahedra forming flat planes, all low-temperature phases can be described by different patterns of tilted octahedra; see Fig. 2(a-c). Büchner et al. (1991); Crawford et al. (1991); Maeno et al. (1991a) In the LTO phase,the octahedra tilt by an angle about the tetragonal [1,1,0]t axis which is diagonal to the square lattice and defines the orthorhombic [1,0,0]o axis [Fig. 2(b)]. In the LTT phase, the tilt axis runs parallel to the square lattice, but its direction alternates between [1,0,0]t and [0,1,0]t in adjacent planes. Axe et al. (1989); Maeno et al. (1991a); Tranquada et al. (1995) In the LTLO phase, the tilt axis points along an intermediate in-plane direction. Crawford et al. (1991)
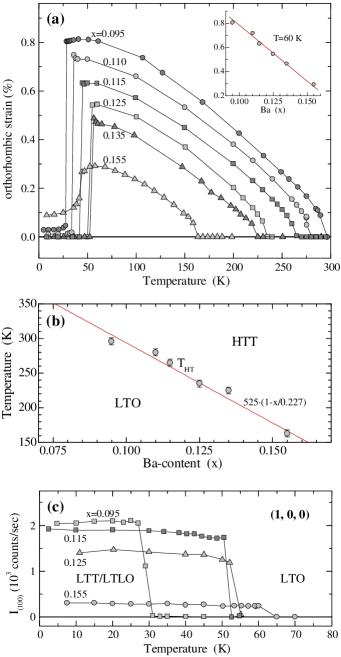
The structural properties in this section were obtained with XRD, while data from ND are presented in Sec. III.3.1. In Fig. 3(a) we show, for all , the temperature dependence of the orthorhombic strain , from which we have extracted the HTTLTO transition temperature, , as a function of doping. The maximum strain the lattice reaches at low temperatures is directly, although nonlinearly, related to . Büchner et al. (1994) Both quantities show a monotonic decrease with increasing , as shown in the inset to Fig. 3(a) and in Fig. 3(b). In particular, we observe that decreases at a rate of of 23.1 K/0.01 Ba [solid line in Fig. 3(b)], which is very similar to published polycrystal data. Axe et al. (1989); Adachi et al. (2001); Zhao et al. (2007) The difference between a crystal’s value and this line can be used to estimate the deviation of its actual Ba concentration from the nominal . Overall the data in Fig. 3(b) show that is a fairly good representation of . Nevertheless, in the discussion in Sec. IV we will show that small discrepancies between our results and data in the literature can be reconciled in terms of .
The second transition, at , from LTO to either LTT or LTLO, causes a sudden drop of the orthorhombic strain at low temperatures, as one can see in Fig. 3(a). In particular, for , 0.125 and 0.135 we observe discontinuous LTOLTT transitions. The crystals with and 0.095 show discontinuous LTOLTLO transitions with very weak strain remaining below ; the strain continues to decrease at low temperatures and, for , eventually becomes zero. The crystal with shows a discontinuous transition that results in a mixed LTLO/LTT phase, as is discussed in more detail in Sec. III.4.1. (That crystal also consisted of several domains, but we were able to isolate the diffracted signal from a single domain region.)
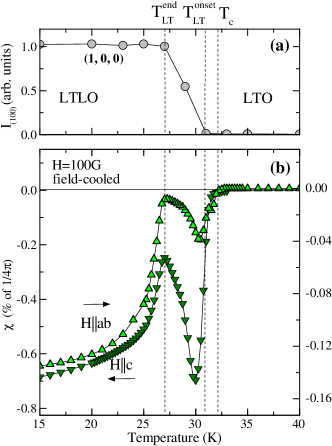
To examine the low-temperature transition in more detail, we have followed the temperature dependence of the (1,0,0) superstructure reflection, which is allowed in the LTT and LTLO phases, but not in the LTO phase. In Fig. 3(c) we show integrated intensities normalized with the (2,0,0) Bragg reflection as previously explained. As increases, one can see that drops while grows. This behavior indicates that local structural parameters are involved in the mechanism that drives the transition, as will be discussed further in Sec. IV.
III.2 Charge Stripe Order
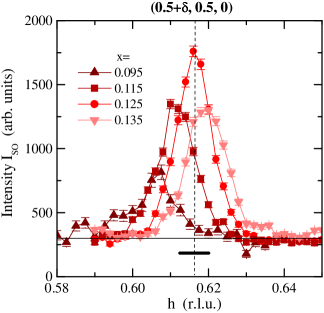
The charge stripe order, studied with XRD, leads to weak reflections with ordering wave vectors and , where increases with hole concentration; see Fig. 2(d). Tranquada et al. (1997); Yamada et al. (1998). In Fig. 4 we show -scans through the (2+2,0,5.5) CO-peak for different at base temperature. To accurately determine the position and intensity, we used the (2,0,6) Bragg reflection as a reference. All these scans were performed with identical scattering geometry, for which we kept the [0,1,0]t direction in the scattering plane. This guaranties the same relative orientation in -space of the CO-peak and the resolution ellipsoid, which has been determined at the (2,0,6) Bragg peak; in Fig. 4, the resolution limited peak shape along is indicated for .
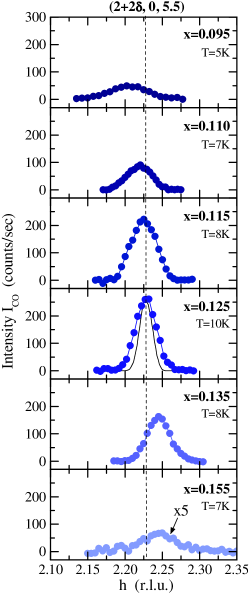
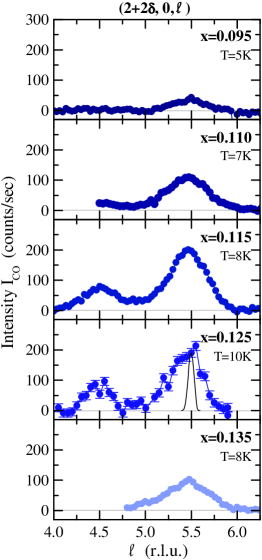
As one can see in Fig. 4, the peak intensity is maximum at and falls off rapidly for . To our surprise, we still find weak CO-peaks for dopings as low as and as high as . The incommensurability extracted from the peak position shifts monotonically from 0.205 for to 0.245 for . The empirical relationshipYamada et al. (1998) for would predict at , but the experimental value clearly stays below, as has been noticed by other groups, as well. Kim et al. (2009)
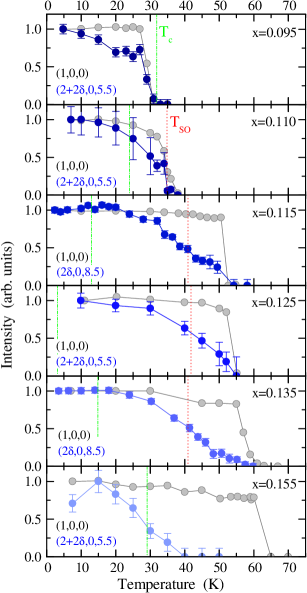
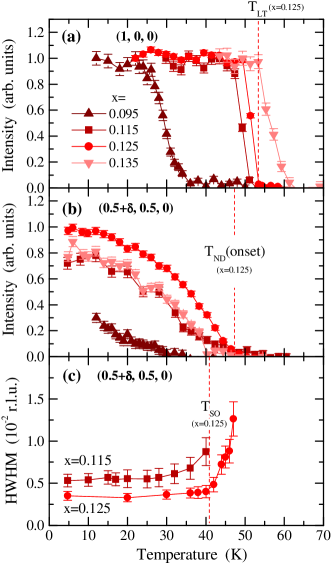
In Fig. 5 we compare the temperature dependence of the CO and the (1,0,0) peak intensities for the different dopings. This time we show normalized integrated intensities since not all data sets do correspond to identical reflections, scattering geometry, or sample thickness. One important finding is that for the onset of charge order always coincides with the LTOLTT/LTLO transition, i.e., . Only for does drop below . The temperature dependence of the CO and (1,0,0) peak intensities evolve differently. Independent of , the (1,0,0) peak shows very sharp transitions, and is nearly constant below . This is indicative of the transition’s first order nature and shows that barely increases at low . In the case of the CO peak, we see an evolution from a sharp transition at to one at where CO fades away on warming, until finally at we find . For in particular, the data suggest that CO could persist at higher temperatures if it were not cut off by the structural transition.
III.2.1 Charge stripe stacking order
An important question concerns the doping dependence of the stripe correlations perpendicular to the planes. For , the stacking arrangement in and is well known. Stripes run parallel to the Cu-O bonds but in orthogonal directions in adjacent planes. Thus, only in every other layer do stripes run parallel, but in addition they are shifted by half the charge period, which results in a body-centered type of stacking, with a repeat of four planes (two unit cells). Tranquada et al. (1995); von Zimmermann et al. (1998); Kimura et al. (2003); Kim et al. (2008a) Therefore, CO-peaks occur at half integer positions. To test the robustness of this stacking pattern as a function of hole concentration, we performed the -scans shown in Fig. 6. Similar to Fig. 4, the data show absolute intensities obtained in identical scattering geometry. It is obvious that, in spite of the dramatic variation of the intensity, all scans show the same modulation in . This clearly demonstrates that the stacking order type is the same in the studied range , and rules out a dramatic change of the correlation length perpendicular to the planes. Note that for the intensity was too weak to identify the dependence.
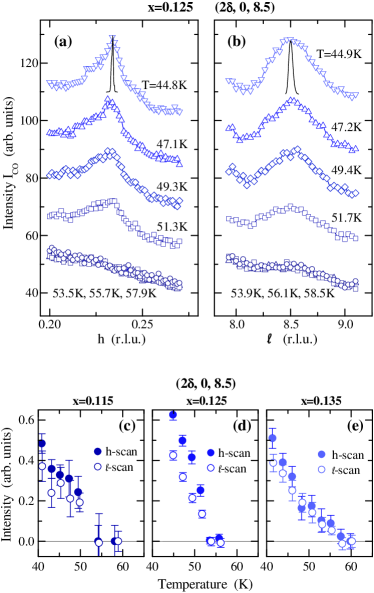
Another question concerns the way the charge stripe order melts as the temperature approaches . There is evidence for , as well as for isostructural nickelates such as , that the stacking order melts well before the in-plane order disappears at . Kim et al. (2008a); Hücker et al. (2006) To check if our crystals show this effect, we performed scans through the (2,0,8.5) CO-peak along and for , 0.125 and 0.135; see Fig. 7. The data in Fig. 7(a) and (b) for clearly show that the peak in remains well defined until it disappears simultaneously with the peak in . In Fig. 7(c-e) we show the integrated intensities of the and scans for three dopings, normalized at a base temperature of K. One can see that in all cases the extracted intensities for and disappear simultaneously. Thus, we conclude that the stacking order persists up to , and that the CO melts isotropically. We mention that the measurements in Fig. 7 were performed with the zone parallel to the scattering plane, which gives a very good resolution, indicated by scans through the (0,0,8) Bragg peak.
III.3 Spin Stripe Order
III.3.1 Neutron diffraction
The spin stripe order was studied by means of neutron diffraction and static magnetization measurements. Neutron diffraction allows one to directly probe the incommensurate spin structure of the SO and thus provides crucial complementary information to the x-ray diffraction data on the incommensurate CO. The magnetic ordering wave vectors are and , i.e., they are displaced by from the position of the magnetic Bragg peak in the AF parent compound , as indicated in Fig. 2(d). In Fig. 8 we show -scans through the SO-peak for the different dopings. The data for was taken at SPINS with identical configuration and is normalized to the crystal volume in the beam, thus allowing a direct comparison of the intensities. One can see that the SO-peak is maximum for , just as for the CO-peak. The data for were taken with the HB-1 spectrometer; they show a SO-peak that is definitely much weaker, although the available data is insufficient to draw a precise quantitative comparison to the other dopings. No SO-peak was detected for , which could be because stripe order has become very weak. On the other hand, this crystal is a good bulk superconductor with K, so it could be that there is a spin gap below in place of a SO-peak. Kofu et al. (2009) As one can see in Fig. 8, the SO-peak shifts to higher with increasing , reflecting a similar increase of as for the CO-peak; details will be discussed in Sec. IV.
Next, in Fig. 9 we compare the temperature dependence of the peak intensity of the (1,0,0) peak and the SO-peak as measured with ND. The first thing to note is the good agreement of the (1,0,0) data in Fig. 9(a) with corresponding XRD data in Fig. 5 regarding and the sharpness of the LTOLTT/LTLO transitions, considering the experimental errors resulting from the use of different instruments, and from the fact that the neutron beam averages over a sample volume that is three orders of magnitude larger than for XRD. This indicates a high homogeneity of the crystals’ stoichiometry and quality.
Figure 9(b) shows the SO-peak intensity as a function of temperature. One can see that for , intensity sets in at a temperature below . The gap to is particularly wide for , but also clearly visible for and 0.125. For , the onset is about 30 K, but the low statistics of the weak signal prevent a precise correlation with the other transitions.
It is known from, e.g., SR measurements Savici et al. (2005); Tranquada (1999) that truly static SO sets in below the onset temperature seen by neutron diffraction. The difference is due to the coarser energy resolution of neutron diffraction, which can sample critical fluctuations at . In Ref. Tranquada et al., 2008 we have argued, for the case of , that coincides with the temperature above which the SO-peak starts to broaden; see corresponding data for two dopings in Fig. 9(c). Furthermore, we have shown in Refs. Li et al., 2007; Hücker et al., 2008 for that is also marked by a weak ferromagnetic transition in the static magnetic susceptibility for magnetic fields , which we discuss next. wea
III.3.2 Static magnetic susceptibility
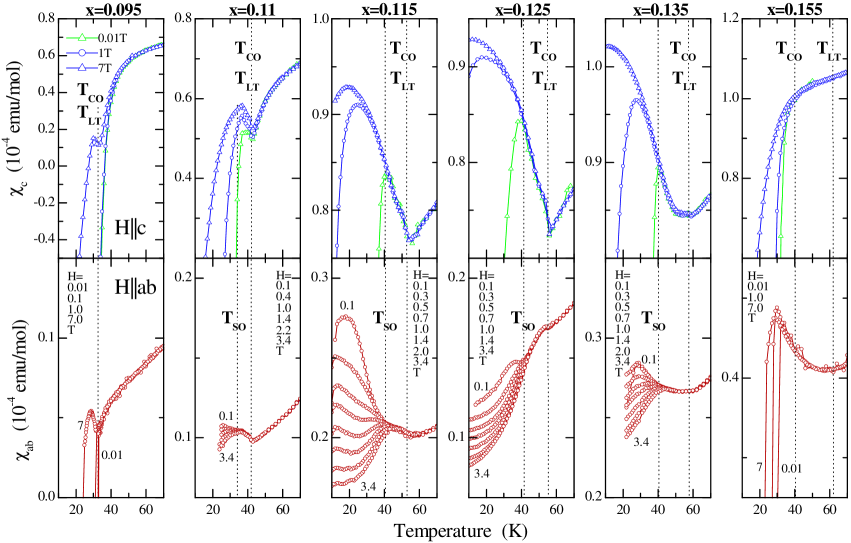
In Fig. 10 we compare the static susceptibility for dopings . A detailed description of in has been given in Ref. Hücker et al., 2008. The top panels of Fig. 10 are for and display the suppression of diamagnetic contributions to the normal state susceptibility from SC, which leads to an increase of with field. In contrast, the bottom panels for display the weak ferromagnetic behavior, which is visible for and characterized by a decrease of with field for . For and and the static susceptibility reveals no information on SO, simply because the onset of bulk SC has shifted to higher temperatures and obscures any signature of the normal state weak ferromagnetism.
It is remarkable to see in Fig. 10 that for those displaying weak ferromagnetism for , coincides with the temperature of first appearance of superconductivity for in the limit of small magnetic fields; see dashed lines denoted . Note that in Fig. 10 we are looking at an extremely fine scale. For comparison, emu/mol equals only of the full Meissner response. In Refs. Li et al., 2007; Tranquada et al., 2008 we have discussed the idea that in this weak diamagnetism in the LTT phase emerges from two-dimensional (2D) superconducting fluctuations below , rather than three-dimensional (3D) bulk superconductivity which sets in at a lower temperature and will be discussed in Sec. III.4. Here we have shown that in a broader range of doping around .
III.3.3 Comparison of critical temperatures
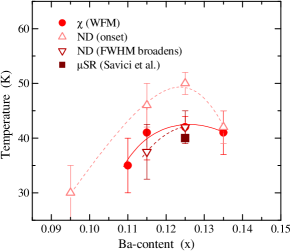
In Fig. 11 we compare the various critical temperatures of the SO phase, extracted by ND and measurements as well as by SR in Ref. Savici et al., 2005. There is good agreement for from and SR as well as from the SO-peak broadening in ND, whereas the onset temperatures of finite SO-peak intensity are higher. For the phase diagram in Fig. 1 we decided to show from , since this is the most complete set of values. Only for did we take the onset temperature from ND, knowing that truly static SO most likely occurs at a lower temperature. For , where we are more confident of the determination, one can see from Fig. 1 that is always lower than .
Returning to Fig. 10, we mention that also shows anomalies at which are particularly pronounced for and ; see dashed lines. For these dopings we know that . In contrast, the anomaly is quite small in the case of , where starts to increase significantly only for K. This is consistent with the sample’s CO in Fig. 5 which becomes already weak at K before it eventually disappears at . Since the structural changes at for and are not so dramatically different, this tells us that the anomaly in must be sensitive to the CO. Finally, for with its extremely weak CO, there is no anomaly at either or .
III.4 Superconductivity
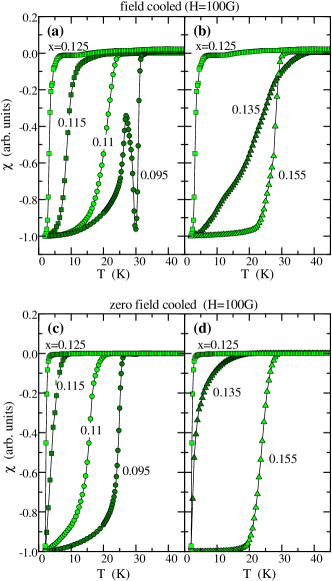
The bulk SC phase was analyzed by magnetic susceptibility measurements. In Fig. 12 we show a selection of normalized field cooled (FC) and zero field cooled (ZFC) measurements for a magnetic field of G (0.01 T) applied parallel to the -axis. pin Similar data sets for 2 G and 20 G reveal no additional information. The left panels in Fig. 12 show how the bulk decreases for , reaching a minimum at 1/8-doping, while the right panels show how increases again for . The bulk SC transition temperatures shown in Fig. 1 were each determined from the intercept of the tangent to the steepest part of the FC curve with , for all except . The latter crystal has a very broad transition, as one can see best in Fig. 12(d), which may originate from a very steep phase boundary in that region, i.e., large , or sample inhomogeneity. In addition, the crystal has a very small Meissner signal, so that the normalization overemphasizes its diamagnetic signal with respect to the other FC curves in Fig. 12(b). Therefore, we decided to identify the for with the onset temperature in the ZFC curve.
III.4.1 Special cases x=0.095 and x=0.155
To properly judge the bulk SC properties of the crystals with and , we emphasize some unique features not observed for the other samples. The crystal with is interesting, because it is the only crystal where the LTOLTLO transition occurs just below the SC transition. As one can see in Fig. 13, after the initial onset of bulk SC in the LTO phase at K, SC collapses below 30 K when both the LTOLTLO and the CO transition occur. Once the transformation is complete, bulk SC reappears.
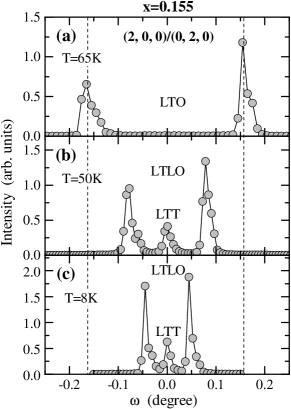
The crystal with is special because it is the only one which does not show a clean structural transition to single phase LTT or LTLO. Instead, the LTO phase transforms into a phase mixture of LTT and LTLO with a volume ratio of 1:4; see Fig. 14. Between and base temperature, the orthorhombic strain of the LTLO phase continues to decrease monotonically; see also Fig. 3. It remains unclear whether CO exists only in the LTT phase or also in the LTLO phase. In a study on , static CO was observed in crystals with LTLO phase with significantly larger remanent strain Fujita et al. (2002b); however, the situation could be different for . For these reasons the contributions of the LTT and LTLO phase fractions to both bulk SC below , and CO below remain unquantifiable for the crystal.
IV Discussion and Conclusions
The successful growth of single crystals with Ba concentrations as high as has given us the opportunity to study the stripe phase beyond the magic 1/8-anomaly and even up to optimal doping, a region which has so far only been accessible with polycrystalline materials. Moodenbaugh et al. (1988); Axe et al. (1989); Maeno et al. (1991b); Arai et al. (2003); Vojta (2009) The detection of CO in bulk SC crystals with far below and far above is certainly the most significant finding. The full picture, however, becomes clear only when considering the relationship between the various properties and transition temperatures.
IV.0.1 Variation of parameters with nominal Ba content
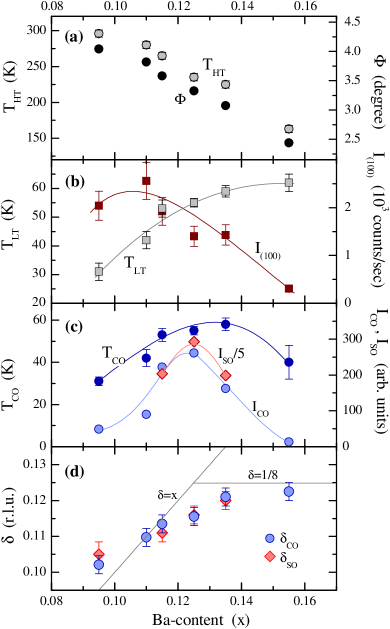
A summary of important parameters versus Ba doping is given in Fig. 15. In panel (a) we compare with the octahedral tilt angle of the average structure calculated from the orthorhombic strain just above . Besides the monotonic variation of and , one can see that stripe order occurs for tilt angles ranging at least from 4.0∘ to 2.4∘, with stripes being most stable at where . For a critical tilt angle of 3.6∘ has been identified to mark a phase boundary between SC and non-SC in the LTT phase. Büchner et al. (1994) This boundary is not very sharp and there are no reports yet on how deep charge stripe order persists into the SC LTT region with . The existence of such a critical angle is reasonable, since the symmetry breaking potential of the LTT phase should scale with . However, in our recent high pressure experiments on at we have found that static charge stripes form even for , where the average structure has flat planes. Hücker et al. (2010) We believe that in this latter case the interactions between dynamic short range charge stripe correlations and local octahedral tilts trigger a spontaneous symmetry breaking by stripes. This mechanism may be particularly strong for commensurate doping. It is possible that the strength of the coupling to local displacements also depends on the local variance Attfield et al. (1998); McAllister and Attfield (2002) of the ionic radii at the lanthanum site; that is, the critical of the average LTT structure may be smaller for compounds with a larger variance. In fact, has a larger variance than , which may explain our observation of CO for with only .
Further signatures of the influence of local properties of Ba are evident from Fig. 15(b), where we focus on the LTOLTT/LTLO transition. In the LTT phase, the intensity of the (1,0,0) peak scales with . decreases with increasing Ba content, and becomes zero in the HTT phase. Yamada and Ido (1992) In the LTLO phase, the (1,0,0) intensity also decreases with increasing orthorhombic strain. For , strain at base temperature is either zero or negligible. Hence, the observed decrease of the (1,0,0) peak towards high doping can be naturally explained in terms of for the average structure. On the other hand, we see that increases with Ba doping in spite of the decrease of and , thus requiring a different explanation. Here, local distortions around an increasing number of Ba defects must be the driving force for the transition, as has been discussed in Ref. Attfield et al., 1998; McAllister and Attfield, 2002. Towards low doping, the LTT (or LTLO) phase and, thus, the (1,0,0) peak eventually have to disappear, since there are just not enough Ba defects to stabilize these phases. The relatively low and (1,0,0) intensity for are evidence of this.
In Fig. 15(c) we compare with the peak intensities of the CO-peak and the SO-peak. (For , see Fig 11). The similarity in trends for the CO and SO phases is apparent. Both peak intensities show a maximum at and drop off quickly for . In contrast, and describe broad domes, which do not necessarily peak symmetrically at . For example, coincides with and increases up to at least . In the case of , our data indeed suggest a weak maximum at . This is consistent with polycrystal data from SR in Ref. Arai et al., 2003, which show a clear peak at , although the values are about 10 K lower than in our single crystals. With SO transition temperatures as high as 42 K, the crystals’ are reminiscent of the highest of reached under pressure when the planes become flat. Yamada and Ido (1992)
Finally, we present the incommensurability in Fig. 15(d), for which we find good agreement between the values determined with XRD from the CO-peak and with ND from the SO-peak. In the phenomenological stripe model, one expects that follows the solid line for and saturates, or increases less steeply, for . Tranquada et al. (1997); Yamada et al. (1998); Fujita et al. (2002b) Our data for match that line at , stay below for higher , and seem to stay above towards lower . Similar deviations have been reported in Ref. Dunsiger et al., 2008a for low and in Ref. Kim et al., 2009 for .
IV.0.2 Estimated actual Ba content; comparison with literature
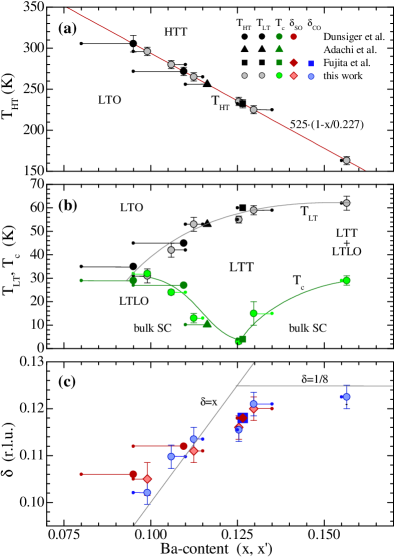
In this section, we will make the case that small discrepancies among different studies can be reconciled to a large extent by accounting for deviations of the actual Ba content from the nominal value. The structural transition temperature is sensitive to the Ba concentration. To use for calibrating , we assume that it follows the linear dependence as shown in Fig. 16(a) [same as in Fig. 3(b)]. At this curve assumes the experimental value K for and it goes through 235 K at , which is the most accurately known value for Ba-doped compounds. In Fig. 16 we compare our data with data from literature for both nominal (small dots) and calculated (large symbols). In Fig. 16(b) and (c) one can recognize a significantly improved agreement between the various data sets for , , and when plotted versus . In particular, for we find a much better agreement with the trend for as shown in Fig. 16(c). Nevertheless, still falls below for , which remains to be understood.
IV.0.3 Superconductivity and stripe order
A key question concerns the relationship between stripe order and SC. Are stripe correlations an essential and universal ingredient of SC in the cuprates, or just an interesting but not crucial feature? This multifaceted problem has attracted a lot of attention. Angle resolved photoemission spectroscopy studies show that in the stripe ordered state develops a gapped Fermi surface similar to that in bulk SC , with the antinodal gap energy of both groups of samples describing a dome with a maximum at . Valla et al. (2006); He et al. (2009) This motivated the idea that static stripe order does not suppress SC pairing correlations per se, but prevents phase coherence. Li et al. (2007) In our recent work on we obtained further evidence for this picture. It seems that stripe order causes an electronic decoupling of the planes and destroys the 3D SC phase coherence, while some kind of 2D SC fluctuations survive. Li et al. (2007); Tranquada et al. (2008) Similar conclusions have been reached in recent theoretical work in which the specific stacking arrangement of stripes in was considered. Berg et al. (2007, 2009)
If the CO and SO happened to compete with the amplitude of the SC order, then we might expect to see a decrease in CO and SO peak intensities at the onset of bulk SC. First we focus on the CO data in Fig. 5, where we have indicated by vertical dash-dotted lines. The best cases to examine are , 0.115, and 0.135, where is well below but not too far below. As one can see, there is no significant change of the CO-peak intensity at . Note that the crystal with is not well suited for this test because of the low statistics of the CO data as well as the presence of the LTT/LTLO phase mixture.
In the case of SO, the best candidates are the crystals with and 0.135. As can be seen in Fig. 9(b), no significant changes of SO at are apparent. [This is in contrast to Ba(Fe1-xCox)2As2, where the spin-density-wave order decreases with the onset of superconductivity.Fernandes et al. (2010)] We mention that published work by other groups for also bears no evidence for changes of SO or CO across . Dunsiger et al. (2008a); Kim et al. (2009) Another question is whether the onset of SO has any effect on the CO. It is thinkable that the onset of SO enhances the CO. However, in Ref. Tranquada et al., 2008 we could show for that neither the intensity nor the width of the CO-peak are affected by the SO transition. The two other dopings where the current data allow conclusions are and 0.135 with K, but also here no change of the CO at is observed; see Fig. 5.
Overall, we find no evidence that CO and SO are affected by the onset of bulk 3D SC, nor seems CO to be affected by the simultaneous onset of SO and weak in-plane 2D SC correlations. Thus the coexistence of CO and SC pairing is not altered by the development of 2D and 3D SC coherence. It seems that the defining moment for the ultimate ground state is the CO transition itself, where depending on the hole concentration and the discussed average and local structure parameters, the balance between the order parameters of CO, SO, and bulk SC is determined.
IV.0.4 Comparison with LBCO, Nd-LSCO, and Eu-LSCO
With few exceptions, our results agree well with published work on single crystals and polycrystals, and have significantly expanded our knowledge on charge and spin stripe order. As for the various critical temperatures, the largest differences are observed between data from single crystals and polycrystals. For example, polycrystals have significantly lower values of and for a given . Arai et al. (2003); Yamada and Ido (1992); Nachumi et al. (1998); Vojta (2009) Early reports on polycrystals also show somewhat lower and higher values. Axe et al. (1989) Among the available single crystal data sets, we find good agreement when plotted versus the estimated actual Ba content. One exception concerns the relationship between and . In a recent XRD study on a crystal, CO sets in significantly below , and shows a melting of the stripe stacking order before the in-plane order disappears. Kim et al. (2008a) Here we find that for Ba doping up to . Only for do our XRD and magnetization data indicate . An early melting of the stacking order was not observed for .
Another difference concerns the extent of the SO phase. In Ref. Arai et al., 2003, magnetic order, together with bulk SC, was detected by SR in a polycrystal with ; however, we find no evidence for SO in our crystal. As long as SR detects static order, ND should as well, independent of a concomitant opening of a spin gap. Kofu et al. (2009) However, the weak CO-peak for already suggests that any SO-peak will be extremely difficult to identify.
A comparison of Fig. 1 with the phase diagram of in Ref. Ichikawa et al., 2000 shows striking similarities but also important differences. There is obviously a qualitatively similar arrangement of structural and electronic phases, with maximum CO and SO temperatures at around . The similarity continues down to such details as dropping below only for , the low-temperature structure changing to LTLO at low , and a tendency towards mixed structural phases at higher , where and, thus, the energetic differences between the various possible symmetries become small. Note that for identical , is smaller in , which may explain why the mixed LTT/LTLO phase for survives down to base temperature.
A significant difference concerns the relationship between and . The SO transition temperatures for the single crystals in Ref. Ichikawa et al., 2000 determined by ND are several times higher than the maximum bulk , with the caveat that truly static SO occurs at much lower temperatures, as confirmed by a number of SR studies. Wagener et al. (1997); Nachumi et al. (1998); Tranquada et al. (1999); Klauss et al. (2000); Savici et al. (2005) The relatively low values, on the other hand, follow from a stronger suppression in the Nd-doped system. This corresponds with a broader range of over which stripe order is detectable. Furthermore, Nd-doping causes to go down even in the LTO phase, most likely as a consequence of the larger . Büchner et al. (1994); Wagener et al. (1997); Schäfer et al. (1994) For comparison, in and the corresponding at low are even smaller than in Nd-free .
Currently, with K is the only system where for . In a recent resonant soft x-ray scattering study,
K and 65 K have been reported for and 0.15,
respectively. Fink et al. (2009) The fact that these values are significantly
higher than in implies that they do not solely depend on the hole
concentration, but on and the local structure as well. Simovic̆ et al. (2003) It
also suggests that in all crystals with , CO would
likely persist to higher temperatures if it were
not limited by the LTOLTT/LTLO transition.
V Summary
Experimental evidence for the existence of static stripe order in single crystals with has been presented. Both the magnetic and the charge order parameters are maximum at , where bulk superconductivity is most strongly suppressed. The competition likely involves the phase coherence of the SC state rather than the local pairing amplitude. Neither charge order nor spin order have shown any noticeable decrease upon the onset of bulk superconductivity. Furthermore, charge stripe order always appears at a higher temperature than the spin stripe order, and the charge order does not change its behavior at the onset of spin order. Thus, charge order appears to be the leading order that both competes and coexists with the bulk superconductivity.
Acknowledgments
Work at Brookhaven is supported by the Office of Basic Energy Sciences, Division of Materials Science and Engineering, U.S. Department of Energy, under Contract No. DE-AC02-98CH10886. JSW and ZJX are supported by the Center for Emergent Superconductivity, an Energy Frontier Research Center funded by the US DOE, Office of Basic Energy Sciences. SPINS at NCNR is supported by the National Science Foundation under Agreement No. DMR-0454672. M.H. thanks B. Büchner for the warm hospitality at the IFW-Dresden where parts of the manuscript were written.
References
- Bednorz and Müller (1986) J. G. Bednorz and K. A. Müller, Z. Phys. B 64, 189 (1986).
- Moodenbaugh et al. (1988) A. R. Moodenbaugh, Y. Xu, M. Suenaga, T. J. Folkerts, and R. N. Shelton, Phys. Rev. B 38, 4596 (1988).
- Takagi et al. (1989) H. Takagi, T. Ido, S. Ishibashi, M. Uota, S. Uchida, and Y. Tokura, Phys. Rev. B 40, 2254 (1989).
- Broun (2008) D. M. Broun, Nature Physics 4, 170 (2008).
- Yamada and Ido (1992) N. Yamada and M. Ido, Physica C 203, 240 (1992).
- Axe et al. (1989) J. D. Axe, A. H. Moudden, D. Hohlwein, D. E. Cox, K. M. Mohanty, A. R. Moodenbaugh, and Y. Xu, Phys. Rev. Lett. 62, 2751 (1989).
- Billinge et al. (1993) S. J. L. Billinge, G. H. Kwei, A. C. Lawson, and J. D. Thompson, Phys. Rev. Lett. 71, 1903 (1993).
- Kumagai et al. (1991) K. Kumagai, H. Matoba, N. Wada, M. Okaji, and K. Nara, J. Phys. Soc. Japan 60, 1448 (1991).
- Luke et al. (1991) G. M. Luke, L. P. Le, B. J. Sternlieb, W. D. Wu, Y. J. Uemura, J. H. Brewer, T. M. Riseman, S. Ishibashi, and S. Uchida, Physica C 185, 1175 (1991).
- Sera et al. (1989) M. Sera, Y. Ando, S. Kondoh, K. Fukuda, M. Sato, I. Watanabe, S. Nakashima, and K. Kumagai, Sol. State Commun. 69, 851 (1989).
- Arai et al. (2003) J. Arai, T. Ishiguro, T. Goko, S. Iigaya, K. Nishiyama, I. Watanabe, and K. Nagamine, J. Low Temp. Phys. 131, 375 (2003).
- Tranquada et al. (1995) J. M. Tranquada, B. J. Sternlieb, J. D. Axe, Y. Nakamura, and S. Uchida, Nature 375, 561 (1995).
- Niemöller et al. (1999) T. Niemöller, N. Ichikawa, T. Frello, H. Hünnefeld, N. H. Andersen, S. Uchida, J. R. Schneider, and J. M. Tranquada, Eur. Phys. J. B 12, 509 (1999).
- von Zimmermann et al. (1998) M. von Zimmermann, A. Vigliante, T. Niemöller, N. Ichikawa, T. Frello, J. Madsen, P. Wochner, S. Uchida, N. H. Andersen, J. M. Tranquada, et al., Europhys. Lett. 41, 629 (1998).
- Ichikawa et al. (2000) N. Ichikawa, S. Uchida, J. M. Tranquada, T. Niemöller, P. M. Gehring, S.-H. Lee, and J. R. Schneider, Phys. Rev. Lett. 85, 1738 (2000).
- Fujita et al. (2002a) M. Fujita, H. Goka, K. Yamada, and M. Matsuda, Phys. Rev. B 66, 184503 (2002a).
- Kimura et al. (2003) H. Kimura, H. Goka, M. Fujita, Y. Noda, K. Yamada, and N. Ikeda, Phys. Rev. B 67, 140503 (2003).
- Fujita et al. (2004) M. Fujita, H. Goka, K. Yamada, J. M. Tranquada, and L. P. Regnault, Phys. Rev. B 70, 104517 (2004).
- Abbamonte et al. (2005) P. Abbamonte, A. Rusydi, S. Smadici, G. D. Gu, G. A. Sawatzky, and D. L. Feng, Nature Physics 1, 155 (2005).
- Kim et al. (2008a) Y.-J. Kim, G. D. Gu, T. Gog, and D. Casa, Phys. Rev. B 77, 064520 (2008a).
- Hücker et al. (2007) M. Hücker, G. D. Gu, J. Tranquada, M. v. Zimmermann, H.-H. Klauss, N. J. Curro, M. Braden, and B. Büchner, Physica C 460-462, 170 (2007).
- Fink et al. (2009) J. Fink, E. Schierle, E. Weschke, J. Geck, D. Hawthorn, V. Soltwisch, H. Wadati, H.-H. Wu, H. A. Dürr, N. Wizent, et al., Phys. Rev. B 79, R100502 (2009).
- Thio et al. (1988) T. Thio, T. R. Thurston, N. W. Preyer, P. J. Picone, M. A. Kastner, H. P. Jenssen, D. R. Gabbe, C. Y. Chen, R. J. Birgeneau, and A. Aharony, Phys. Rev. B 38, 905 (1988).
- Crawford et al. (1993) M. K. Crawford, R. L. Harlow, E. M. McCarron, W. E. Farneth, N. Herron, H. Chou, and D. E. Cox, Phys. Rev. B 47, 11623 (1993).
- Hücker et al. (2004) M. Hücker, V. Kataev, J. Pommer, U. Ammerahl, A. Revcolevschi, J. M. Tranquada, and B. Büchner, Phys. Rev. B 70, 214515 (2004).
- Zaanen and Gunnarsson (1989) J. Zaanen and O. Gunnarsson, Phys. Rev. B 40, 7391 (1989).
- Kivelson et al. (2003) S. A. Kivelson, I. P. Bindloss, E. Fradkin, V. Oganesyan, J. M. Tranquada, A. Kapitulnik, and C. Howald, Rev. Mod. Phys. 75, 1201 (2003).
- Vojta (2009) M. Vojta, Advances in Physics 58, 699 (2009).
- Crawford et al. (1991) M. K. Crawford, R. L. Harlow, E. M. McCarron, W. E. Farneth, J. D. Axe, H. Chou, and Q. Huang, Phys. Rev. B 44, 7749 (1991).
- Büchner et al. (1994) B. Büchner, M. Breuer, A. Freimuth, and A. P. Kampf, Phys. Rev. Lett. 73, 1841 (1994).
- Tranquada et al. (1996) J. M. Tranquada, J. D. Axe, N. Ichikawa, Y. Nakamura, S. Uchida, and B. Nachumi, Phys. Rev. B 54, 7489 (1996).
- Pickett et al. (1991) W. E. Pickett, R. E. Cohen, and H. Krakauer, Phys. Rev. Lett. 67, 228 (1991).
- Kivelson et al. (1998) S. A. Kivelson, E. Fradkin, and V. J. Emery, Nature 393, 550 (1998).
- Hücker et al. (2010) M. Hücker, M. v. Zimmermann, M. Debessai, J. S. Schilling, J. M. Tranquada, and G. D. Gu, Phys. Rev. Lett. 104, 057004 (2010).
- Li et al. (2007) Q. Li, M. Hücker, G. D. Gu, A. M. Tsvelik, and J. M. Tranquada, Phys. Rev. Lett. 99, 67001 (2007).
- Tranquada et al. (2008) J. M. Tranquada, G. D. Gu, M. Hücker, H.-J. Kang, R. Klingeler, Q. Li, J. S. Wen, G. Y. Xu, Z. J. Xu, and M. v. Zimmermann, Phys. Rev. B 78, 174529 (2008).
- Berg et al. (2007) E. Berg, E. Fradkin, E.-A. Kim, S. A. Kivelson, V. Oganesyan, J. M. Tranquada, and S. C. Zhang, Phys. Rev. Lett. 99, 127003 (2007).
- Berg et al. (2009) E. Berg, E. Fradkin, and S. A. Kivelson, Phys. Rev. B 70, 064515 (2009).
- Wakimoto et al. (2003) S. Wakimoto, R. J. Birgeneau, Y. Fujimaki, N. Ichikawa, T. Kasuga, Y. J. Kim, K. M. Kojima, S.-H. Lee, H. Niko, J. M. Tranquada, et al., Phys. Rev. B 67, 184419 (2003).
- Nachumi et al. (1998) B. Nachumi, Y. Fudamoto, A. Keren, K. Kojima, M. Larkin, G. M. Luke, J. Merrin, O. Tchernyshyov, Y. J. Uemura, N. Ichikawa, et al., Phys. Rev. B 58, 8760 (1998).
- Abe et al. (1999) Y. Abe, Y. Ando, J. Takeya, H. Tanabe, T. Watauchi, I. Tanaka, and H. Kojima, Phys. Rev. B 59, 14753 (1999).
- Adachi et al. (2001) T. Adachi, T. Noji, and Y. Koike, Phys. Rev. B 64, 144524 (2001).
- Adachi et al. (2005) T. Adachi, N. Kitajima, T. Manabe, Y. Koike, K. Kudo, T. Sasaki, and N. Kobayashi, Phys. Rev. B 71, 104516 (2005).
- Valla et al. (2006) T. Valla, A. V. Federov, J. Lee, J. C. Davis, and G. D. Gu, Science 314, 1914 (2006).
- Xu et al. (2007) G. Xu, J. M. Tranquada, T. G. Perring, G. D. Gu, M. Fujita, and K. Yamada, Phys. Rev. B 76, 014508 (2007).
- Zhao et al. (2007) Y. Zhao, B. D. Gaulin, J. P. Castellan, J. P. C. Ruff, S. R. Dunsiger, G. D. Gu, and H. A. Dabkowska, Phys. Rev. B 76, 184121 (2007).
- Dunsiger et al. (2008a) S. R. Dunsiger, Y. Zhao, Z. Yamani, W. J. L. Buyers, H. A. Dabkowska, and B. D. Gaulin, Phys. Rev. B 77, 224410 (2008a).
- Dunsiger et al. (2008b) S. R. Dunsiger, Y. Zhao, B. D. Gaulin, Y. Qiu, P. Bourges, Y. Sidis, J. R. D. Copley, A. Kallin, E. M. Mazurek, and H. A. Dabkowska, Phys. Rev. B 78, 092507 (2008b).
- Kim et al. (2009) J. Kim, H. Zhang, G. D. Gu, and Y.-J. Kim, J. Supercond. Nov. Magn. 22, 251 (2009).
- Adachi et al. (2009) T. Adachi, N. Kitajima, and Y. Koike, arXive: 0909.3452 (2009).
- Hücker et al. (2008) M. Hücker, G. D. Gu, and J. M. Tranquada, Phys. Rev. B 78, 214507 (2008).
- Tranquada et al. (2004) J. M. Tranquada, H. Woo, T. G. Perring, H. Goka, G. D. Gu, G. Xu, M. Fujita, and K. Yamada, Nature 429, 534 (2004).
- Homes et al. (2006) C. C. Homes, S. V. Dordevic, G. D. Gu, Q. Li, T. Valla, and J. M. Tranquada, Phys. Rev. Lett. 96, 257002 (2006).
- Kim et al. (2008b) J. Kim, A. Kagedan, G. D. Gu, C. S. Nelson, and Y.-J. Kim, Phys. Rev. B 77, 180513 (2008b).
- He et al. (2009) R.-H. He, K. Tanaka, S.-K. Mo, T. Sasagawa, M. Fujita, T. Adachi, N. Mannella, K. Yamada, Y. Koike, Z. Hussain, et al., Nature Physics 5, 119 (2009).
- Maeno et al. (1991a) Y. Maeno, A. Odagawa, N. Kakehi, T. Suzuki, and T. Fujita, Physica C 173, 322 (1991a).
- Bouchard et al. (1998) R. Bouchard, D. Hupfeld, T. Lippmann, J. Neuefeind, H.-B. Neumann, H. Poulsen, U. Rütt, T. Schmidt, J. Schneider, J. Süssenbach, et al., J. Synch. Rad. 5, 90 (1998).
- Wakimoto et al. (2006) S. Wakimoto, H. Kimura, M. Fujita, K. Yamada, Y. Noda, G. Shirane, G. Gu, H. Kim, and R. J. Birgeneau, J. Phys. Soc. Japan 75, 074714 (2006).
- Büchner et al. (1991) B. Büchner, M. Braden, M. Cramm, W. Schlabitz, W. Schnelle, O. Hoffels, W. Braunisch, R. Müller, G. Heger, and D. Wohlleben, Physica C 185, 903 (1991).
- (60) We mention that over time we have used three displex cryostats and a magnet cryostat for the XRD experiments, with approximate base temperatures of 10 K, 7 K, 4 K, and 2.5 K, respectively. Furthermore, two displex cryostats have been used for the ND experiments. Although the temperature calibration of these instruments has been fair, we emphasize that the most reliable doping dependence of has been obtained from SQUID measurements.
- Tranquada et al. (1997) J. M. Tranquada, J. D. Axe, N. Ichikawa, A. R. Moodenbaugh, Y. Nakamura, and S. Uchida, Phys. Rev. Lett. 78, 338 (1997).
- Yamada et al. (1998) K. Yamada, C. H. Lee, K. Kurahashi, J. Wada, S. Wakimoto, S. Ueki, H. Kimura, Y. Endoh, S. Hosoya, G. Shirane, et al., Phys. Rev. B 57, 6165 (1998).
- Hücker et al. (2006) M. Hücker, M. v. Zimmermann, R. Klingeler, S. Kiele, J. Geck, S. Bakehe, J. P. Hill, A. Revcolevschi, D. J. Buttrey, B. Büchner, et al., Phys. Rev. B 74, 85112 (2006).
- Kofu et al. (2009) M. Kofu, S.-H. Lee, M. Fujita, H.-J. Kang, H. Eisaki, and K. Yamada, Phys. Rev. Lett. 102, 047001 (2009).
- Savici et al. (2005) A. T. Savici, A. Fukaya, I. M. Gat-Malureanu, T. Ito, P. L. Russo, Y. J. Uemura, C. R. Wiebe, P. P. Kyriakou, G. J. MacDougall, M. T. Rovers, et al., Phys. Rev. Lett. 95, 157001 (2005).
- Tranquada (1999) J. M. Tranquada, Phys. Rev. B 59, 14712 (1999).
- (67) The microscopic origin of the weak in-plane ferromagnetism is still unclear, but we mention that a similar observation has been made in stripe ordered in Ref. Klingeler et al., 2005.
- (68) In 214-cuprates a strong pinning of magnetic flux is very common, and leads to small FC and large ZFC signals, misrepresenting the true SC volume, in particular in large polycrystalline samples and single crystals. In single crystals flux pinning depends also on microstructural defects and, therefore, varies with the crystal quality. For a quantitative comparison samples should also have identical shape and size. Since it was beyond the scope of the present work to achieve this for our crystals, we decided to normalize the FC and ZFC data.
- Fujita et al. (2002b) M. Fujita, K. Yamada, H. Hiraka, P. M. Gehring, S. H. Lee, S. Wakimoto, and G. Shirane, Phys. Rev. B 65, 64505 (2002b).
- Maeno et al. (1991b) Y. Maeno, N. Kakehi, M. Kato, and T. Fujita, Phys. Rev. B 44, 7753 (1991b).
- Crawford et al. (2005) M. K. Crawford, R. L. Harlow, S. Deemyad, V. Tissen, J. S. Schilling, E. M. McCarron, S. W. Tozerm, D. E. Cox, N. Ichikawa, S. Uchida, et al., Phys. Rev. B 71, 104513 (2005).
- Attfield et al. (1998) J. P. Attfield, A. L. Kharlanov, and J. A. McAllister, Nature 394, 157 (1998).
- McAllister and Attfield (2002) J. A. McAllister and J. P. Attfield, Phys. Rev. B 66, 014514 (2002).
- Fernandes et al. (2010) R. M. Fernandes, D. K. Pratt, W. Tian, J. Zarestky, A. Kreyssig, S. Nandi, M. G. Kim, A. Thaler, N. Ni, P. C. Canfield, et al., Phys. Rev. B 81, 140501 (2010).
- Wagener et al. (1997) W. Wagener, H.-H. Klauss, M. H. M. A. C. de Melo, M. Birke, F. J. Litterst, B. Büchner, and H. Micklitz, Phys. Rev. B 55, R14761 (1997).
- Tranquada et al. (1999) J. M. Tranquada, N. Ichikawa, K. Kakurai, and S. Uchida, J. Phys. Chem. Solids 60, 1019 (1999).
- Klauss et al. (2000) H.-H. Klauss, W. Wagener, M. Hillberg, W. Kopmann, H. Walf, F. J. Litterst, M. Hücker, and B. Büchner, Phys. Rev. Lett. 85, 4590 (2000).
- Schäfer et al. (1994) W. Schäfer, M. Breuer, A. Freimuth, N. Knauf, B. Roden, W. Schlabitz, and B. Büchner, Phys. Rev. B 49, R9248 (1994).
- Simovic̆ et al. (2003) B. Simovic̆, M. Hücker, P. C. Hammel, B. Büchner, U. Ammerahl, and A. Revcolevschi, Phys. Rev. B 67, 224508 (2003).
- Klingeler et al. (2005) R. Klingeler, B. Büchner, S.-W. Cheong, and M. Hücker, Phys. Rev. B 72, 104424 (2005).