An Observed Lack of Substructure in Starless Cores
Abstract
In this paper we present the results of a high resolution (5″) CARMA and SZA survey of the 3 mm continuum emission from 11 of the brightest (at 1.1 mm) starless cores in the Perseus molecular cloud. We detect 2 of the 11 cores, both of which are composed of single structures, and the median 3 upper limit for the non-detections is 0.2 in a 5″ beam. These results are consisent with, and as stringent as, the low detection rate of compact 3 mm continuum emission in dense cores in Perseus reported by Olmi et al. (2005). From the non-detection of multiple components in any of the eleven cores we conclude that starless core mass functions derived from bolometer maps at resolutions from 10″–30″ (e.g. with MAMBO, SCUBA or Bolocam) are unlikely to be significantly biased by the blending of lower mass cores with small separations. These observations provide additional evidence that the majority of starless cores in Perseus have inner density profiles shallower than .
Subject headings:
stars: formation; ISM: dust, extinction1. Introduction
Surveys of starless cores in nearby molecular clouds have shown that the starless core mass function (CMF) looks very similar to the stellar initial mass function (IMF), but translated towards higher masses by a factor of a few (e.g. Motte et al., 1998; Nutter & Ward-Thompson, 2007; Enoch et al., 2008; Simpson et al., 2008). If each starless core collapses into a single star, then the apparent shift between the IMF and the CMF implies that the formation process is inefficient and most of the mass in each core never makes it into any star. Models have shown that 25%-70% of the mass in a protostellar core will be converted into a star with the remaining material being ejected by outflows (Matzner & McKee, 2000). A second reason for the shift between the CMF and the IMF is likely to be fragmentation, in which a single starless core will eventually form multiple stars. Since many stars are found in binary or higher-order systems (e.g. Duquennoy & Mayor, 1991), to some extent the fragmentation of a starless core into multiple bound objects is to be expected. However, lower mass stars are less frequently found in gravitationally bound systems (Lada, 2006).
Although the shape of the IMF can be reproduced from the CMF with a variety of assumptions about the multiplicity, fragmentation, and efficiency of the process (Swift & Williams, 2008; Hachell08), recent work by Goodwin et al. (2008) has shown that models in which every starless core eventually forms multiple stars reproduces the stellar IMF more successfully than models in which low-mass cores are more likely to form a single star than a binary. That each core fragments into only two or three components, and not many more, is suggested by the relatively small number of close binaries and high velocity single stars that would result from the dynamical ejection of protostars from higher order systems (Goodwin & Kroupa, 2005). Therefore, high angular resolution observations of starless cores might be expected to show that what appears to be a single object at low resolution is in fact composed of multiple fragments, depending on whether or not the fragmentation takes place before an embedded protostar forms and on what physical scale fragmentation occurs.
The binary fraction of young stellar objects and protostars has been studied in detail, and it has been found that these objects are commonly found in multiple systems. For example, near-infrared observations of Class-I and flat-spectrum objects in nearby molecular clouds show that in the range 300-2000 AU the multiplicity is 18%, with a median separation between companions of 900 AU (Haisch et al., 2004). Sub-arcsecond Berkeley-Illinois-Maryland Array (BIMA) observations of the 3 mm continuum emission from 20 Class 0 and Class I protostars found that all of the embedded objects are in small groupings, with separations ranging from 100 AU to 10000 AU (Looney et al., 2000). Recent simulations of fragmentation in magnetically supported dense cores typically start with small cores (6000 AU or 24″ at the distance of Perseus) that fragment into multiple protostellar systems with separations on the order of 10–1000 AU (e.g. Boss, 2002, 2007; Price & Bate, 2007).
Observations of starless cores have not often found evidence for fragmentation on the scale of 5–10″. In a survey of dense cores in the Perseus molecular cloud with the Owens Valley Radio Observatory (OVRO) interferometer, Olmi et al. (2005) found that five out of six cores had no compact continuum emission, and in the sixth core a single source was detected (at 5″ resolution, or 1200 AU in Perseus). Similarly, Harvey et al. (2003) mapped the 1.3 mm continuum emission from the starless core L694-2 with the IRAM Plateau de Bure Interferometer (PdBI) and BIMA and found that the PdBI observations resolved out the core entirely while the shorter baselines of the BIMA data can be adequately modelled by a single source, implying that no fragmentation has taken place. Other interferometric observations of starless cores, such as S68NW, L1544 and L694-2 show only single peaks in their integrated spectral line emission (Williams & Myers, 1999; Williams et al., 1999, 2006). However, BIMA mapping of the N2H+ emission from the starless core L183 shows that this core is composed of three components with a total mass of a few tenths of a solar mass that are distinct both spatially and kinematically (Kirk et al., 2009). Kirk et al. (2009) interpret this as evidence that L183 is fragmenting as it collapses and predict that this core will eventually form multiple protostars.
Here we present the results of a search for substructure in a sample of 11 starless cores in the Perseus molecular cloud. We use Combined Array for Research in Millimeter-wave Astronomy (CARMA) and Sunyaev-Zel’dovich Array (SZA) interferometric observations to study the 3 mm continuum emission at 5″ resolution with sensivity up to scales of 30″- 80″. The source selection and observations are discussed in Section 2, followed by an analysis (Section 3), a discussion (Section 4), and summary (Section 5).
2. Observations
To search for substructure within starless cores, we mapped the 3 mm continuum emission with 5″ resolution towards a sample of 11 cores drawn from the 1.1 mm Bolocam survey of Enoch et al. (2008). Here we describe the sample of cores and their observations.
2.1. Source Selection
We drew our sample of starless cores from the 1.1 mm Bolocam survey of Enoch et al. (2006, 2008), which has 31″ resolution. Enoch et al. (2008) uses Spitzer near- to mid-infrared data to determine the starless/protostellar status of each millimeter core. We chose starless cores in the Perseus molecular cloud on the basis of having high peak fluxes (200 mJy beam-1). There are 15 starless cores in the Bolocam survey of Perseus with peak fluxes 200 mJy beam-1, of which we were only allocated enough time to observe 11, chosen arbitrarily. The selected cores have a median mass of 1.47 and a median density of cm-3, as derived from the Bolocam data (Enoch et al., 2008). The 1.1 mm-derived properties of the starless cores in this sample are presented in Table 1.
Protostars in Enoch et al. (2008) are identified by the shape of their near-infrared to far-infrared spectral energy distributions (SEDs), minimum flux at 24 µm and presence of 70 µm point sources not classified as galaxy candidates. In Enoch et al. (2008), if a protostar is found within one FWHM of the center of the 1.1 mm Bolocam core, then it is classified as protostellar, otherwise the Bolocam core is classified as starless. Searches for protostars in the Perseus molecular cloud have also been performed by Jørgensen et al. (2007), Hatchell et al. (2007), and Sadavoy et al. (2010). Jørgensen et al. (2007) identify protostellar cores from their mid-infrared colors and magnitudes, distance to the nearest 850 µm SCUBA core and concentration of the 850 µm emission. Hatchell et al. (2007) identify protostellar cores by the presence of 12CO outflows and the presence of near-infrared (2MASS) or mid-infrared (Spitzer) sources within an 850 µm SCUBA core. Sadavoy et al. (2010) find protostars based on mid-infrared and far-infrared (Spitzer) magnitudes and colors cross-referenced with a list of 850 µm SCUBA cores. A detailed comparison between these methods of classifying a core as either starless or protostellar is given in Sadavoy et al. (2010); here we note that the classifications according to the various criteria are broadly consistent.
All of the cores in our sample are classified as starless by Enoch et al. (2008) and none of these cores are identified as protostellar by Jørgensen et al. (2007), but Perbo45 and Perbo50 are identified as Class 0 protostars by Hatchell et al. (2007) and Perbo44 and Perbo107 are identified as protostars by Sadavoy et al. (2010). More recent deep 70 µm observations of one starless core in our sample, Perbo58, indicate that it may contain a very weak internal luminosity source (Enoch et al., in prep). Thus, Perbo58 may not be truly prestellar, although even if a central protostar has formed, it is likely very young and not far evolved from the prestellar phase. We keep Perbo44, Perbo45, Perbo50, Perbo58 and Perbo107 in the starless sample based on the original selection criteria and note that out of the four surveys to identify starless cores and/or protostars in the Perseus molecular cloud none of our targets are classified as protostellar in more than one paper.
2.2. CARMA and SZA
Continuum observations in the 3 mm window were obtained with CARMA, a 15 element interferometer consisting of nine 6.1 meter antennas and six 10.4 meter antennas. The CARMA correlator records signals in three separate bands, each with an upper and lower sideband. We configured all three bands for maximum bandwidth (468 MHz with 15 channels per band) to observe continuum emission, providing a total continuum bandwidth of 2.8 GHz. The observations were centered around 102 GHz, and range from 100 GHz to 104 GHz. The half-power beam width of the 10.4 m antennas is 66″ at the observed frequencies. Single pointings towards all 11 starless cores were taken in the CARMA D-array configuration, with projected baselines that range from 11 m to 150 m. Follow-up observations of six of the eleven cores were made in the CARMA E-array cofiguration with projected baselines that range from 8 m to 66 m, also with single pointings. Two cores (Perbo45 and Perbo58) were then re-observed in D and E-array configurations with 7-point mosaics to improve the signal-to-noise in the maps and enlarge the area of uniform gain to 66″. A summary of the CARMA configurations, the synthesized beam size, the largest angular scale to which the observations are sensitive, and the noise in the maps are presented in Table 2.
The SZA is an 8 element interferometer equipped with 3 mm band (80–115 GHz) receivers. The instantaneous field of view of the SZA is given by the primary beam of the 3.5 m antennas, approximately 3.3′ (FWHM) at 95 GHz. Six of the SZA antennas are arranged in a close-packed configuration with baselines ranging from 4.5 to 11.5 m and two outer telescopes yield baselines of up to 65 m, resulting in a synthesized beam size of 38″. Sixteen 500 MHz wide analog bands provide 8 GHz bandwidth, though for the observations in this study only 7 GHz bandwidth (from 92–98 GHz) was available. A more detailed description of the SZA is given in Muchovej et al. (2007).
The observing sequence for the CARMA observations was to integrate on a phase calibrator (3C84, 0237+288 or 0336+323) for 4–5 minutes and science targets for 14–28 minutes. In each set of observations 3C84 was observed for passband calibration, and observations of a planet (Mars or Uranus) or 3C84 were used for absolute flux calibration. Although 3C84 has a variable brightness, it is monitored on a weekly basis at CARMA. Based on the repeatability of the quasar fluxes, the estimated random uncertainty in the measured source fluxes is %. Radio pointing was done at the beginning of each track and pointing constants were updated at least every two hours thereafter, using either radio or optical pointing routines. Calibration and imaging were done using the MIRIAD data reduction package (Sault et al., 1995).
The observing sequence for the SZA observations was to integrate on the phase calibrator, 3C84, for 5 minutes and the starless core Perbo58 for 10 minutes. The observations of 3C84 were also used for bandpass and absolute flux calibration. Because the SZA data are at a somewhat lower frequency than the CARMA data (95 GHz vs. 102 GHz), we use the flux of 3C84 derived at the higher frequency to set the absolute flux calibration of the SZA data before combining the CARMA and SZA maps. Calibration and imaging were done using the MIRIAD data reduction package (Sault et al., 1995).
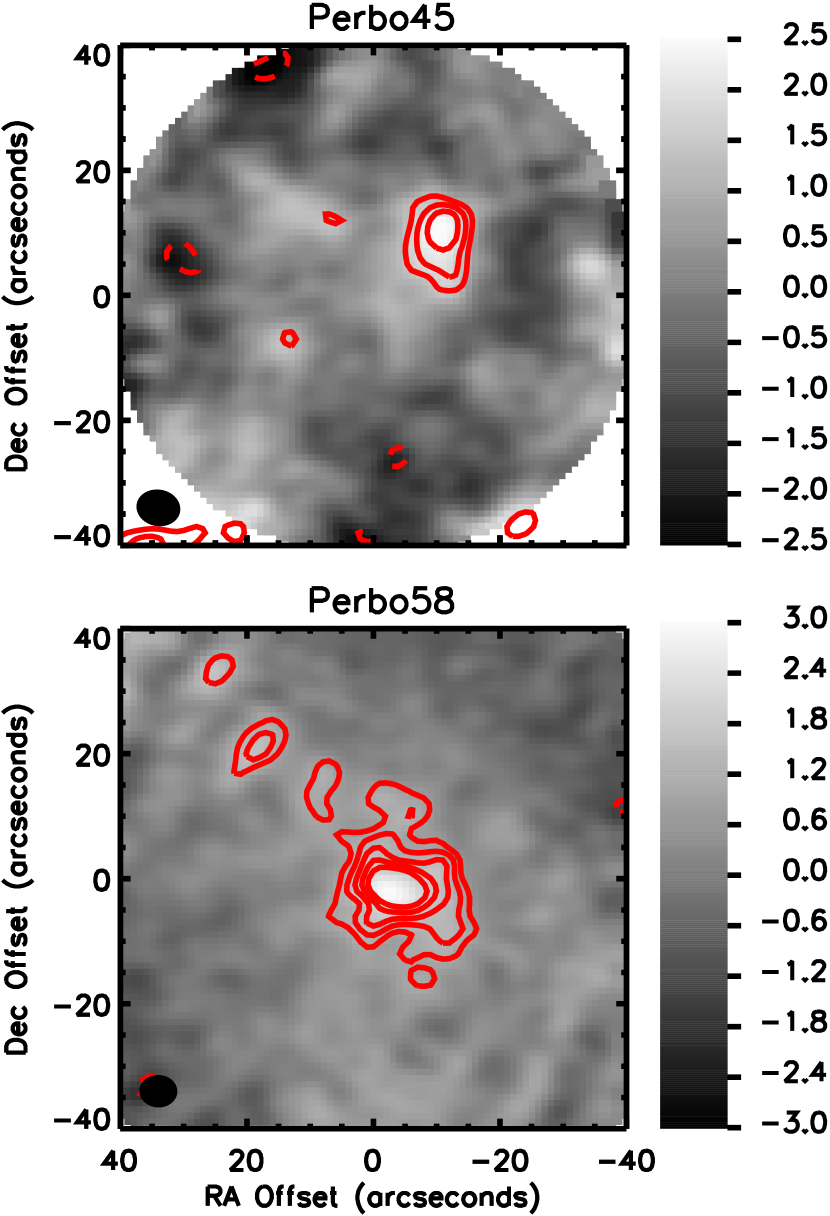
The 3 mm continuum maps of Perbo45 and Perbo58 are presented in Figure 1. The other starless cores were not detected.
2.3. Bolometer Maps
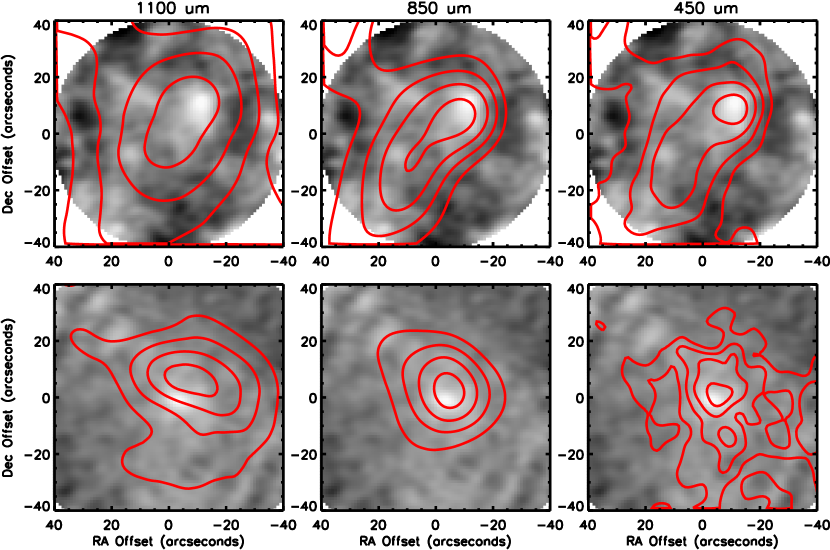
In addition to the 31″ Bolocam map at 1100 µm (Enoch et al., 2006), the Perseus molecular cloud has also been mapped with SCUBA at 450 and 850 µm at 9″ and 14″ resolution, respectively (Hatchell et al., 2005; Kirk et al., 2006). We downloaded the submillimeter maps from the SCUBA Legacy Catalogues (Di Francesco et al., 2008), which includes all of the data taken with SCUBA and uses the most current calibration and reduction methods. The absolute calibration of the bolometer maps is good to 15%, 20% and 50% at 1100, 850 and 450 µm, respectively. The 450, 850 and 1100 µm bolometer maps of Perbo45 and Perbo58 are overlayed on the 3 mm interferometric maps in Figure 2.
3. Analysis
We detected, at the 5 level, continuum emission from 2 out of 11 starless cores in our survey. Here we present an analysis of the properties of the detected cores and the implications of this detection rate.
3.1. Core Properties
Both of the detected cores in this survey (Perbo45 and Perbo58) are seen to contain one main component (see Figure 1). A few lower significance (3-4) peaks are present in the 3 mm map of Perbo58 along an extended ridge seen in the bolometer maps. Note that the map of Perbo58 includes data taken with the SZA, so it is sensitive to angular scales smaller than 80″. Given that the FWHM sizes of Perbo58 as measured by Bolocam (26″) is smaller than this scale, we believe that we have not resolved out any of the 3 mm emission from Perbo58, but given that the map of Perbo45 only includes CARMA D+E array data and not SZA data we are likely resolving out some of the 3 mm emission from Perbo45.
3.1.1 Mass
We calculate the mass of the detected cores from the total 3 mm flux and upper limits to the non-detections using the equation:
| (1) |
where is the distance to Perseus, is the total flux from each detection or three times the noise for the non-detections, is the Planck function at dust temperature , and cm2g-1 is the dust opacity, extrapolated from the opacity at 1300 µm given in Ossenkopf & Henning (1994) Table 1, column (5) for dust grains with thin ice mantles, assuming a gas-to-dust ratio of 100 and an emissivity given by . This value of the emissivity spectral index is consistent with the measured in TMC-1C (Schnee et al., 2010) and L1498 (Shirley et al., 2005). For comparison with the core properties derived in Enoch et al. (2008), we assume that the distance to Perseus is 250 pc and that the dust temperature is 10 K for all of the cores in this sample, which is a typical gas temperature of starless cores in Perseus (Schnee et al., 2009). The derived masses and upper limits are presented in Table 3.
The mass of Perbo45 derived from our 3 mm data is about a factor of 4 lower than the mass derived from the 1.1 mm Bolocam data. The mass of Perbo58 derived from our 3 mm observations is a factor of 3 higher than the mass derived from the 1.1 mm Bolocam data. Four possibilities for explaining these discrepancies are 1) uncertainties in the dust properties 2) variations in the temperature within the cores, 3) errors in the measurement of the 1.1 mm and/or 3 mm fluxes, and 4) in the case of Perbo45, we are likely to have resolved out some of the 3 mm continuum emission. Note that the deconvolved size of Perbo45 in the Bolocam surveys is roughly 53″, so the amount of flux resolved out by our CARMA observations is likely to be substantial.
The masses of Perbo58 derived from the 1.1 mm and 3 mm data could be brought into agreement if the emissivity spectral index were given by instead of , as we assumed. Although the two best measurements of the emissivity spectral index in starless cores suggest that is a much better fit than (Shirley et al., 2005; Schnee et al., 2010), it is possible that grain growth leads to a shallower emissivity spectral index at the high densities likely to be found at the centers of prestellar cores. For instance, the emissivity spectral index in a sample of nearby protostars has been measured to be in the range (Arce & Sargent, 2006), and values in this range might be plausible for starless cores given the recent evidence for grain growth in starless cores (Steinacker et al., 2009). Because the masses in Table 3 are derived from the 1.3 mm opacity (Ossenkopf & Henning, 1994) extrapolated out to 3 mm, an incorrect assumption about the emissivity spectral index would lead to masses off by a factor of a few. If the emissivity spectral index in starless cores is closer to than , then the expected fluxes at 3 mm as extrapolated from the 1.1 mm Bolocam observations would be a factor of 3 larger than we have assumed. In this case the non-detection of 3 mm continuum emission towards nine of the eleven cores in our sample becomes an even more significant result (see Section 3.2).
Alternatively, if Perbo58 were significantly warmer at the center than its average temperature, the higher resolution 3 mm observations would be more biased towards high masses and densities than the low resolution 1.1 mm data. It is generally observed that starless cores are colder at their centers due to self-shielding (e.g. Crapsi et al., 2007; Schnee et al., 2007). Heating due to contraction can result in a temperatures a few degrees higher in the center of a starless core (Keto & Caselli, 2009), but this on its own cannot account for the large difference in masses derived from the 1.1 mm and 3 mm continuum data. If there were a weak internal luminosity source in Perbo58 (as discussed in Section 2.1), then one would expect some central heating that could bring the 1.1 mm and 3 mm-derived masses into agreement.
A third possible cause for the disagreement between the 1.1 mm and 3 mm derived masses is the uncertain absolute calibration of the emission maps. The two cores detected by CARMA/SZA are both in the dense and bright cluster NGC1333, which results in artifacts in the bolometer maps. However, detailed testing of the accuracy of the recovery of 1.1 mm flux from Bolocam has shown that the quoted fluxes are accurate to within 15% (Enoch et al., 2006). The absolute calibration of the 3 mm continuum maps is accurate to within 20%. Therefore, uncertainties in the absolute calibration of the emission maps alone cannot account for the factor of a few difference between the 1.1 mm and 3 mm derived masses.
Due to uncertainties in the dust emissivity and temperature profiles of Perbo45 and Perbo58, we will defer a more detailed analysis of their masses until more data are available and only note that the 3 mm fluxes of Perbo45 and Perbo58 are not what we expected based on their 1.1 mm fluxes as mapped by Bolocam.
3.1.2 Density
We calculate the density of the detected starless cores from the derived mass and effective radius using the equation:
| (2) |
where is the effective radius, is the mean molecular weight per particle and is the mass of hydrogen. The effective radius is the geometric mean of the deconvolved semi-major and semi-minor axes, derived from a Gaussian fit to the flux distribution. The density for each detected core is presented in Table 3.
The densities of Perbo45 and Perbo 58 derived from the 3 mm continuum data in this survey are larger than the values derived from the 1.1 mm Bolocam data. The densities derived from the 3 mm data (see Table 3) are roughly a few cm-3, while the mean density in a AU diameter aperature derived from the 1.1 mm data are on the order of a few cm-3. Since the 3 mm observations are higher resolution than the 1.1 mm observations, it is not surprising that the 3 mm-derived densities are larger. Though high, densities in the cm-3 range have been reported in L1544 (Crapsi et al., 2007) and in several starless cores in Orion (Nutter & Ward-Thompson, 2007). The densities in Table 3 would be lower if the assumed temperature were higher, as might be expected if the detected cores harbor low-luminosity protostars.
A simple model of the density profile of a starless core can be given by:
| (3) |
where , and are constants. This formulation with is a good approximation for the density profile of a Bonnor-Ebert sphere (Tafalla et al., 2004) and provides a qualitatively good fit to the observed density profiles of starless cores, which are fairly flat at small radii and are steeper at larger radii.
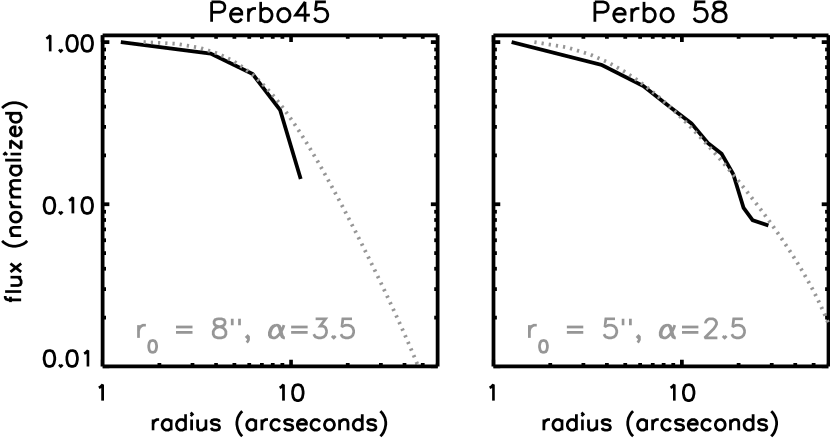
We investigate whether or not the density profiles of the cores in Perbo45 and Perbo58 are consistent with Equation 3. First we measure the flux profile in annuli centered on the positions of Perbo45 and Perbo58 given in Table 3. We then calculate the flux profile that would be observed for a spherical core with the density profile given by Equation 3 assuming that the cores are isothermal and have constant dust emissivities. We normalize the observed and model fluxes such that the flux at the center of the core is equal to unity, so the term in Equation 3 is not meaningful. We show in Figure 3 that under the stated assumptions of the dust properties and geometries that a density profile like that given in Equation 3 does predict flux profiles that are similar to those observed at 3 mm for values of in the range of 5″–8″and in the range 2.5–3.5.
The model density profile that we use to fit the observed flux profiles of Perbo45 and Perbo58 does not provide a unique solution to what the true density profiles of these core are, and other models that have a flat inner profile that steepens at larger radii can be consistent with our observations. If one uses different assumptions about the temperature profile and allows the emissivity to vary with radius, it might even be possible to fit the 3 mm flux profile with a power-law density profile. What we have shown here is that the density profiles of Perbo45 and Perbo58 are not necessarily different from typical starless cores, and the reason that they are detected in our survey while other cores are not is most likely due to their relatively large masses for their size.
3.2. Detection Rate
Of the 11 starless cores that were observed with CARMA, 2 were detected (Perbo45 and Perbo58) and 9 were not. Neither of the detected starless cores are seen to break into multiple components. The non-detection of the majority of the starless cores is not due to low sensitivity (the median upper limit for the non-detections is 0.2 - see Section 3.1.1 for details), but instead is likely the result of a lack of compact sub-structures within the cores. If all of the mass in each of the non-detected cores had been contained within a few compact structures, every core would have been detected in the CARMA observations (see Section 3.1.1 for an explanation of how the mass upper limits in Table 3 were derived). For example, the median 3 upper limit on the mass of the non-detected cores is a factor of 7 smaller than the core mass derived from the Bolocam map. Therefore, we argue that the non-detection of multiple components in all 11 cores in our sample is a significant result. Furthermore, given the high rate of multiplicity in Class 0 and Class I protostars (Looney et al., 2000) and the low rate of multiplicity in starless cores, we suggest that fragmentation into binaries takes place during the collapse of a prestellar core or during the Class 0 stage.
The density profiles of many starless cores have been measured from (sub)millimeter continuum emission maps and it has generally been found that the density profiles are consistent with an power-law at large radii that flattens towards the center of the core (e.g. Ward-Thompson et al., 1994, 1999; Shirley et al., 2000). To study the density profiles of the starless cores in our sample, we use the mass and radius derived from the 1.1 mm observations to predict the 3 mm flux at the center of each core with the assumptions that the density profile goes as , that the emissivity spectral index is given by , and that the cores are isothermal. We would have been able to detect (at the 3 level) all 11 cores in our sample if these assumptions were valid, but in fact we only detect two starless cores. As noted in Section 3.1.1, if then the detection rate of cores, and any substructure in them, would be easier than if . Because we expect starless cores to be colder in their centers than at the edges the flux profile of a “real” starless core will be somewhat flatter than our isothermal model would predict. Nevertheless, we conclude that the density profiles for the majority of the starless cores in our sample are flatter than an profile at their centers, in agreement with other surveys.
The low rate of 3 mm continuum detections towards 11 of the brightest (200 mJy beam-1 at 1.1 mm with Bolocam; Enoch et al., 2008) in this study is in agreement with the results of Olmi et al. (2005) who detect only 1 out of 6 dense cores in Perseus. The largest angular scale to which the interferometer was sensitive and the median noise in the maps in this study (30″–40″ and 0.7 mJy beam-1) are similar to that in Olmi et al. (20″–40″ and 1-1.5 mJy beam-1; 2005). There is no overlap in the sample of sources mapped in this study and in Olmi et al. (2005).
There are 67 starless cores detected by Enoch et al. (2008) in the Perseus molecular cloud, of which we observed 11. Because we selected our sample based on their high peak fluxes, there is no reason to expect that the other starless cores in Perseus would have a higher detection rate at 3 mm. The low rate (0/11) of finding mutiple 3 mm components at 5″ resolution within 1.1 mm cores observed with 30″ resolution is consistent with the 3 mm continuum OVRO observations of dense cores in Perseus carried out by Olmi et al. (2005), who found that none of the cores (out of six) were seen to be composed of multiple components. We argue that starless core mass functions generated from single dish bolometer maps of Perseus (e.g. Enoch et al., 2008; Hatchell & Fuller, 2008) are not strongly biased by the blending of compact, close cores into more massive single cores.
4. Discussion
Given that many stars are found in multiple systems (Duquennoy & Mayor, 1991) and that many protostars are also multiples (Looney et al., 2000; Haisch et al., 2004), it is worthwhile to examine when fragmentation takes place. If starless cores fragment before formation of an embedded object, then we would expect to be able to detect these sub-cores. On the other hand, if fragmentation takes place after the first protostar has formed, then a survey of starless cores won’t find any evidence of fragmentation. In this study, we find that none of the eleven starless cores show any evidence of fragmentation. If these cores will eventually fragment, then this must happen during and/or after the collapse and formation of the first protostar. Late fragmentation on small scales, which is consistent with the results of this survey, is predicted by theories that create binaries from disk fragmentation (e.g. Bonnell & Bate, 1994; Kratter et al., 2010).
The observations described in this paper are in agreement with the results of other recent surveys in Perseus. Kirk et al. (2007) compared the line profiles of C18O (2-1) and N2H+(1-0) toward a sample of 150 candidate dense cores, both prestellar and protostellar. They found that the N2H+ lines, representing the densest gas within the core, display nearly thermal line widths, indicating little non-thermal activity at the core center. While the C18O gas shows significant non-thermal broadening, the velocity centroids of the two species are very similar, indicating that the connection between the cores and their environment is relatively calm. Interestingly, such quiescence across scales appears hard to reconcile with numerical simulations of turbulent clouds (Kirk et al., 2009) and may indicate a need for magnetic pressure support within the dense gas. Additionally, Jørgensen et al. (2007) compared the location of mid-infrared Spitzer sources and sub-millimeter cores in Perseus, finding excellent agreement between the deeply embedded protostars and their proto-stellar envelopes. Intriguingly, only 3 out of 40 cores were found to harbour multiple protostars, at the spatial resolution of Spitzer (MIPS 24 µm, 6″ or 1500 AU). Thus, it appears that within Perseus there is little evidence for fragmentation within cores, at least until the protostellar stage, where the fragmentation length scale is smaller. This may be due to the smooth and quiescent manner in which the cores themselves appear to be forming.
We only detected significant (5) emission from two of the eleven starless cores in our sample and we put tight upper limits on the masses of multiple components in the other nine cores, from which we conclude that there is no substructure on 5″ scales (1200 AU) in the majority of starless cores. A smooth column density profile is predicted by many models of isolated star formation, such as the inside-out collapse model (Shu, 1977) and ambipolar diffusion (Ciolek & Mouschovias, 1993). It is less clear if a smooth column density profile is consistent with cores created through turbulence, though some simulations show that turbulent molecular clouds do form quiescent cores with smooth column density profiles (Nakamura & Li, 2005; Ballesteros-Paredes et al., 2003).
5. Summary
We present a study of the 3 mm continuum emission from a sample of 11 of the brightest (at 1.1 mm) starless cores in the Perseus molecular cloud. The data were primarily taken with CARMA at 5″ resolution, with followup observations of one core taken with the SZA to improve the sensitivity to extended flux.
1) We detect two starless cores (Perbo45 and Perbo58), both of which are seen to contain a single, main component.
2) Based on the low detection rate (0/11 in this study and 0/6 in Olmi et al., 2005) of multiple components within starless cores, we conclude that starless core mass functions derived from bolometer maps of the Perseus molecular cloud (e.g. Enoch et al., 2008; Hatchell et al., 2007) are unlikely to be heavily biased by the blending of smaller, nearby cores into single sources at the coarser resolutions of single-dish maps.
3) Based on the low detection rate of any components within dense cores (2/11 in this study and 1/6 in Olmi et al., 2005), we conclude that the majority of starless cores lack compact structures. More specifically, we find that density profiles in the inner portions of starless cores of the form are inconsistent with our obervations for the majority of the starless cores in our survey. This agrees with the results of previous surveys, which find that the density profiles of starless cores are flatter than at small radii (e.g. Ward-Thompson et al., 1994, 1999; Shirley et al., 2000).
References
- Arce & Sargent (2006) Arce, H. G., & Sargent, A. I. 2006, ApJ, 646, 1070
- Ballesteros-Paredes et al. (2003) Ballesteros-Paredes, J., Klessen, R. S., & Vázquez-Semadeni, E. 2003, ApJ, 592, 188
- Bonnell & Bate (1994) Bonnell, I. A., & Bate, M. R. 1994, MNRAS, 271, 999
- Boss (2002) Boss, A. P. 2002, ApJ, 568, 743
- Boss (2007) Boss, A. P. 2007, ApJ, 658, 1136
- Ciolek & Mouschovias (1993) Ciolek, G. E., & Mouschovias, T. C. 1993, ApJ, 418, 774
- Crapsi et al. (2007) Crapsi, A., Caselli, P., Walmsley, M. C., & Tafalla, M. 2007, A&A, 470, 221
- Di Francesco et al. (2008) Di Francesco, J., Johnstone, D., Kirk, H., MacKenzie, T., & Ledwosinska, E. 2008, ApJS, 175, 277
- Duquennoy & Mayor (1991) Duquennoy, A., & Mayor, M. 1991, A&A, 248, 485
- Enoch et al. (2008) Enoch, M. L., Evans, N. J., II, Sargent, A. I., Glenn, J., Rosolowsky, E., & Myers, P. 2008, ApJ, 684, 1240
- Enoch et al. (2006) Enoch, M. L., et al. 2006, ApJ, 638, 293
- Goodwin & Kroupa (2005) Goodwin, S. P., & Kroupa, P. 2005, A&A, 439, 565
- Goodwin et al. (2008) Goodwin, S. P., Nutter, D., Kroupa, P., Ward-Thompson, D., & Whitworth, A. P. 2008, A&A, 477, 823
- Haisch et al. (2004) Haisch, K. E., Jr., Greene, T. P., Barsony, M., & Stahler, S. W. 2004, AJ, 127, 1747
- Harvey et al. (2003) Harvey, D. W. A., Wilner, D. J., Myers, P. C., & Tafalla, M. 2003, ApJ, 597, 424
- Hatchell et al. (2005) Hatchell, J., Richer, J. S., Fuller, G. A., Qualtrough, C. J., Ladd, E. F., & Chandler, C. J. 2005, A&A, 440, 151
- Hatchell et al. (2007) Hatchell, J., Fuller, G. A., Richer, J. S., Harries, T. J., & Ladd, E. F. 2007, A&A, 468, 1009
- Hatchell & Fuller (2008) Hatchell, J., & Fuller, G. A. 2008, A&A, 482, 855
- Jørgensen et al. (2007) Jørgensen, J. K., Johnstone, D., Kirk, H., & Myers, P. C. 2007, ApJ, 656, 293
- Keto & Caselli (2009) Keto, E., & Caselli, P. 2009, arXiv:0908.2400
- Kirk et al. (2006) Kirk, H., Johnstone, D., & Di Francesco, J. 2006, ApJ, 646, 1009
- Kirk et al. (2007) Kirk, H., Johnstone, D., & Tafalla, M. 2007, ApJ, 668, 1042
- Kirk et al. (2009) Kirk, J. M., Crutcher, R. M., & Ward-Thompson, D. 2009, ApJ, 701, 1044
- Kirk et al. (2009) Kirk, H., Johnstone, D., & Basu, S. 2009, ApJ, 699, 1433
- Kratter et al. (2010) Kratter, K. M., Matzner, C. D., Krumholz, M. R., & Klein, R. I. 2010, ApJ, 708, 1585
- Lada (2006) Lada, C. J. 2006, ApJ, 640, L63
- Looney et al. (2000) Looney, L. W., Mundy, L. G., & Welch, W. J. 2000, ApJ, 529, 477
- Matzner & McKee (2000) Matzner, C. D., & McKee, C. F. 2000, ApJ, 545, 364
- Motte et al. (1998) Motte, F., Andre, P., & Neri, R. 1998, A&A, 336, 150
- Muchovej et al. (2007) Muchovej, S., et al. 2007, ApJ, 663, 708
- Nakamura & Li (2005) Nakamura, F., & Li, Z.-Y. 2005, ApJ, 631, 411
- Nutter & Ward-Thompson (2007) Nutter, D., & Ward-Thompson, D. 2007, MNRAS, 374, 1413
- Olmi et al. (2005) Olmi, L., Testi, L., & Sargent, A. I. 2005, A&A, 431, 253
- Ossenkopf & Henning (1994) Ossenkopf, V., & Henning, T. 1994, A&A, 291, 943
- Price & Bate (2007) Price, D. J., & Bate, M. R. 2007, MNRAS, 377, 77
- Sadavoy et al. (2010) Sadavoy, S. I., et al. 2010, ApJ, 710, 1247
- Sault et al. (1995) Sault, R. J., Teuben, P. J., & Wright, M. C. H. 1995, Astronomical Data Analysis Software and Systems IV, 77, 433
- Schnee et al. (2007) Schnee, S., Kauffmann, J., Goodman, A., & Bertoldi, F. 2007, ApJ, 657, 838
- Schnee et al. (2009) Schnee, S., Rosolowsky, E., Foster, J., Enoch, M., & Sargent, A. 2009, ApJ, 691, 1754
- Schnee et al. (2010) Schnee, Enoch, Noriega-Crespo, Sayers, Terebey, Caselli, Foster, Goodman, Kauffmann, Padgett, Rebull, Sargent & Shetty, 2010, ApJ, 708, 127
- Shirley et al. (2000) Shirley, Y. L., Evans, N. J., II, Rawlings, J. M. C., & Gregersen, E. M. 2000, ApJS, 131, 249
- Shirley et al. (2005) Shirley, Y. L., Nordhaus, M. K., Grcevich, J. M., Evans, N. J., II, Rawlings, J. M. C., & Tatematsu, K. 2005, ApJ, 632, 982
- Shu (1977) Shu, F. H. 1977, ApJ, 214, 488
- Simpson et al. (2008) Simpson, R. J., Nutter, D., & Ward-Thompson, D. 2008, MNRAS, 391, 205
- Steinacker et al. (2009) Steinacker, J., Pagani, L., Bacmann, A., & Guieu, S. 2009, arXiv:0912.0145
- Swift & Williams (2008) Swift, J. J., & Williams, J. P. 2008, ApJ, 679, 552
- Tafalla et al. (2004) Tafalla, M., Myers, P. C., Caselli, P., & Walmsley, C. M. 2004, A&A, 416, 191
- Ward-Thompson et al. (1994) Ward-Thompson, D., Scott, P. F., Hills, R. E., & Andre, P. 1994, MNRAS, 268, 276
- Ward-Thompson et al. (1999) Ward-Thompson, D., Motte, F., & Andre, P. 1999, MNRAS, 305, 143
- Williams & Myers (1999) Williams, J. P., & Myers, P. C. 1999, ApJ, 518, L37
- Williams et al. (1999) Williams, J. P., Myers, P. C., Wilner, D. J., & di Francesco, J. 1999, ApJ, 513, L61
- Williams et al. (2006) Williams, J. P., Lee, C. W., & Myers, P. C. 2006, ApJ, 636, 952
| Name | RA | Dec | Peak Flux | Total Flux | Total Mass | FWHM11Derived from an elliptical Gaussian fit, deconvolved by the 31″ beam | Density22Mean density calculated in a fixed linear aperture of diameter 104 AU |
|---|---|---|---|---|---|---|---|
| (J2000) | (J2000) | (mJy/beam) | (Jy) | ( ) | (″) | (105 cm-3) | |
| Perbo11 | 03:25:46.0 | +30:44:10 | 241 | 0.90 | 2.18 | 72.5 | 2.2 |
| Perbo13 | 03:25:48.8 | +30:42:24 | 407 | 0.47 | 1.14 | 38.2 | 3.9 |
| Perbo14 | 03:25:50.6 | +30:42:01 | 342 | 0.41 | 1.00 | 38.7 | 3.5 |
| Perbo44 | 03:29:04.5 | +31:18:42 | 274 | 0.72 | 1.73 | 47.0 | 2.7 |
| Perbo45 | 03:29:07.7 | +31:17:17 | 455 | 1.35 | 3.25 | 52.9 | 4.8 |
| Perbo50 | 03:29:14.5 | +31:20:30 | 313 | 1.31 | 3.15 | 68.0 | 3.2 |
| Perbo51 | 03:29:17.0 | +31:12:26 | 423 | 0.62 | 1.49 | 34.7 | 3.6 |
| Perbo58 | 03:29:25.7 | +31:28:16 | 273 | 0.33 | 0.78 | 25.9 | 1.8 |
| Perbo74 | 03:33:01.9 | +31:04:32 | 255 | 0.38 | 0.91 | 44.5 | 2.6 |
| Perbo105 | 03:43:57.8 | +32:04:06 | 283 | 0.61 | 1.47 | 46.6 | 2.8 |
| Perbo107 | 03:44:02.1 | +32:02:34 | 388 | 0.48 | 1.17 | 46.0 | 4.1 |
| Name | CARMA D | CARMA E | SZA | Beam Size11Geometric mean of the major and minor axes | LAS22Largest angular scale to which the map is sensitive | Noise |
|---|---|---|---|---|---|---|
| (″) | (″) | (mJy/beam) | ||||
| Perbo11 | Y | N | N | 4.5 | 30 | 0.5 |
| Perbo13 | Y | Y | N | 6.6 | 40 | 1.3 |
| Perbo14 | Y | Y | N | 6.2 | 40 | 0.9 |
| Perbo44 | Y | N | N | 4.2 | 30 | 0.6 |
| Perbo45 | Y | Y | N | 6.4 | 40 | 0.4 |
| Perbo50 | Y | N | N | 4.2 | 30 | 0.7 |
| Perbo5133The noise in the map of Perbo51 is larger than the other maps due to the bright source NGC 1333 IRAS4 located at the edge of the CARMA map | Y | Y | N | 5.4 | 40 | 2.8 |
| Perbo58 | Y | Y | Y | 5.6 | 80 | 0.3 |
| Perbo74 | Y | N | N | 4.6 | 30 | 0.3 |
| Perbo105 | Y | N | N | 4.3 | 30 | 0.9 |
| Perbo107 | Y | Y | N | 6.2 | 40 | 1.1 |
| Name | RA offset11Offset measured from pointing center, given in Table 1 | Dec offset11Offset measured from pointing center, given in Table 1 | Peak Flux22Errors derived from the random noise in the maps and do not include absolute flux calibration uncertainties | Total Flux22Errors derived from the random noise in the maps and do not include absolute flux calibration uncertainties | Axes33Deconvolved major and minor axes and position angle | 33Deconvolved major and minor axes and position angle | Mass44For non-detections, the 3 upper limit to a point source mass is given | density |
|---|---|---|---|---|---|---|---|---|
| (″) | (″) | (mJy/beam) | (mJy) | (″) | (degrees) | ( ) | (cm-3) | |
| Perbo11 | 0.11 | |||||||
| Perbo13 | 0.29 | |||||||
| Perbo14 | 0.20 | |||||||
| Perbo44 | 0.14 | |||||||
| Perbo4555Note that only CARMA D and E-array obserations have been taken for this source, so we are likely to have resolved out a larger fraction of the emission than for Perbo58 | -14 | 0.8 | ||||||
| Perbo50 | 0.16 | |||||||
| Perbo51 | 0.62 | |||||||
| Perbo58 | 35 | 2.4 | ||||||
| Perbo74 | 0.07 | |||||||
| Perbo105 | 0.20 | |||||||
| Perbo107 | 0.24 |