11email: brenda.matthews@nrc-cnrc.gc.ca 22institutetext: University of Victoria, Finnerty Road, Victoria, BC, V8W 3P6 Canada
33institutetext: UK Astronomy Technology Center, Royal Observatory, Blackford Hill, Edinburgh EH9 3HJ, UK
44institutetext: Institute of Astronomy, University of Cambridge, Madingley Road, Cambridge, CB3 0HA, UK
55institutetext: Institute for Astronomy, University of Edinburgh, Royal Observatory, Blackford Hill, Edinburgh EH9 3HJ, U.K.
66institutetext: Laboratoire d’Astrophysique, Observatoire de Grenoble, Université J. Fourier, CNRS, France
77institutetext: Department of Astronomy, University of California, 601 Campbell Hall, Berkeley, CA, U.S.A., 94720
88institutetext: School of Physics and Astronomy, University of St Andrews, North Haugh, St Andrews, Fife KY16 9SS, UK
99institutetext: Observatoire de Paris - CNRS, 77 Av. Denfert Rochereau, 75014 Paris, France
1010institutetext: Centro de Astrobiología (CSIC-INTA), 28850 Torrejón de Ardoz, Madrid, Spain
1111institutetext: Department of Astrophysical Sciences, Ivy Lane, Peyton Hall, Princeton University, Princeton NJ 08544 USA
1212institutetext: Département de physique et Observatoire du Mont-Mégantic, Université de Montréal, C. P. 6128, Succ. Centre-ville, Montréal, QC H3C 3J7, Canada
1313institutetext: Department of Physics and Astronomy, James Madison University, Harrisonburg, VA 22807, U.S.A
1414institutetext: ALMA JAO, Avda. Apoquindo 3846, Piso 19, Edificio Alsacia, Las Condes, Santiago, Chile
1515institutetext: Thüringer Landessternwarte, Sternwarte 5, D-07778 Tautenburg, Germany
1616institutetext: Astronomy Department, University of Texas at Austin, 1 University Station C1400, Austin, TX 78712-0259, U.S.A.
1717institutetext: Hamburger Sternwarte, Gojenbergsweg 112, 21029 Hamburg, Germany
1818institutetext: Department of Physics and Astronomy, The Open University, Milton Keynes MK7 6AA, U.K.
1919institutetext: Department of Physics, Science Laboratories, Durham University, South Road, Durham, DH1 3LE, U.K.
2020institutetext: Dept. of Physics & Astronomy, University of California, Los Angeles, 475 Portola Plaza, Los Angeles, CA 90095-1547, USA
2121institutetext: Geneva Observatory, Astronomy Department of the Geneva University, Switzerland
2222institutetext: Leiden Observatory, Leiden University, Postbus 9513, 2300 RA, Leiden, The Netherlands
2323institutetext: Harvard-Smithsonian Center for Astrophysics, 60 Garden Street, Cambridge, MA 02138
Resolving debris discs in the far-infrared: early highlights from the DEBRIS survey††thanks: Herschel is an ESA space observatory with science instruments provided by European-led Principal Investigator consortia and with important participation from NASA.
We present results from the earliest observations of DEBRIS, a Herschel Key Programme to conduct a volume- and flux-limited survey for debris discs in A-type through M-type stars. PACS images (from chop/nod or scan-mode observations) at 100 and 160 m are presented toward two A-type stars and one F-type star: Leo, UMa and Corvi. All three stars are known disc hosts. Herschel spatially resolves the dust emission around all three stars (marginally, in the case of UMa), providing new information about discs as close as 11 pc with sizes comparable to that of the Solar System. We have combined these data with existing flux density measurements of the discs to refine the SEDs and derive estimates of the fractional luminosities, temperatures and radii of the discs.
Key Words.:
stars: circumstellar matter — infrared, stars: circumstellar discs, stars: individual: Leo, UMa, Corvi1 Introduction
Debris discs are flattened distributions of planetesimals and dust located at radii of 1-1000 AU around main-sequence stars (see (see Wyatt 2008, for a recent review). The dust cannot be primordial since its lifetime in orbit is significantly less than the age of the host stars. Instead, dust is replenished from a population of colliding km-sized planetesimals (Wyatt & Dent 2002; Thébault & Augereau 2007). Over time, the dust distribution is shaped by any planetary-sized bodies in the system (e.g., Dominik & Decin 2003; Wyatt et al. 2007). Therefore, resolved images of discs constrain models of the structure and evolution of planetary systems.
Far-infrared and submillimetre observations are the best way to search for dust around nearby stars due to the favorable contrast of the disc relative to the star. At these wavelengths, the disc emission is optically thin and is sensitive to the large (up to mm), cold grains which dominate the disc’s dust mass.
The Herschel Space Observatory offers three major advantages for the detection and characterization of debris discs: far-infrared sensitivity, angular resolution and wavelength coverage. With its 3.5 m mirror, its sensitivity at far-infrared wavelengths is superior to any previous instrument. With its resolution of 67 at 100 m, Herschel has the potential to resolve many debris discs, particularly toward nearby stars. Finally, with detectors at 100, 160, 250, 350 and 500 m, Herschel has the means to sample the spectral energy distribution (SED) of disc emission across the peak, meaning models can be better constrained even for discs which are not resolved.
DEBRIS (Disc Emission via a Bias-free Reconnaissance in the Infrared/Submillimetre) is an Open Time Key Programme which uses PACS (Photodetector Array Camera & Spectrometer) and (for appropriate targets) SPIRE (Spectral and Photometric Imaging Receiver) to detect, resolve and characterize debris discs around a volume-limited sample of 446 A through M type stars. The goals of DEBRIS include establishing the incidence and evolution of debris discs as a function of stellar type, age, multiplicity, etc.; the characterization of discs in terms of size, temperature, dust mass and morphology (where the disc asymmetries could indicate the presence of planetary companions); and the understanding of our own Solar System in the context of the larger debris disc population. Full details of the DEBRIS survey and goals will be presented in a forthcoming paper (B. Matthews et al. 2010, in preparation). Here, we present PACS observations toward three of the first targets of the DEBRIS survey. We briefly summarize the observations and targets in Sect. 2, present the results in Sect. 3 and discuss three sources in detail in Sect. 4. We summarize the paper in Sect. 5.
2 Observations and data reduction
DEBRIS is a flux-limited survey and as such it observes each target to a uniform depth (1.2 mJy beam-1 at 100 m), resulting in different mass limits for targets at different distances and of different stellar spectral types. Here, we present 100 and 160 m photometry observations toward three nearby stars (see Table 1) performed with the ESA Herschel Space Observatory (Pilbratt et al. 2010) utilizing the PACS (Poglitsch, Waelkens & Geis 2010) instrument. The results presented here were taken during early testing phases or during the Science Demonstration Phase on Herschel (2009 Sept. - Dec.)
The images were obtained using two different observing strategies: point source chop/nod, and small scan-map modes (see the PACS Observers’ Manual111http://herschel.esac.esa.int/Docs/PACS/html/pacs_om.html). For point-source mode observations, seven contiguous repeat chop/nod observations were performed. Scan map observations had eight repeats in a single scan direction at a rate of 20″/s. Four 3′ scan legs were performed per map with a 2″ separation between legs. The total observing times were 1072 and 1220 seconds, respectively, for each chop/nod and scanning observation.
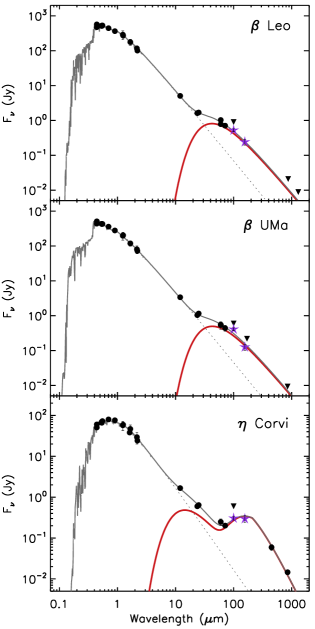
Table 1 shows the survey (“UNS”) identifier for each target as well as the source and observing details. Phillips et al. (2010) contains details of the development of the Unbiased Nearby Stars sample from which the DEBRIS targets are drawn.
These data were reduced using the Herschel interactive processing environment (HIPE Ott 2010). Maps were obtained via the default PACS naïve map-making methods photProject and photProjectPointSource in HIPE for the scanning and point source observing modes respectively. Scanned data were pre-filtered to remove low frequency (1/f) noise using a boxcar filter with width equal to 15. All bright sources in the map were masked prior to filtering to avoid filter ringing type artefacts. The chop/nod configuration meant that no equivalent filtering was required for the data obtained in point source mode.
All three targets presented in this paper are shared targets with the DUNES Herschel Key Programme (PI: C. Eiroa) which has science goals complementary to those of DEBRIS. Details on the distribution of targets will be discussed in a survey description paper (B. Matthews 2010, in preparation).
| Parameter | Leo | UMa | Corvi |
|---|---|---|---|
| UNS ID | A005 | A024 | F063 |
| HD number | HD 102647 | HD 95418 | HD 109085 |
| Spec. Type | A3 Va | A1 V | F2 V |
| PACS OM | scan | point-source | scan |
| D [pc] | 11.0 | 24.3 | 18.2 |
| rms100 [mJy/beam] | 1.4 | 3.1 | 1.2 |
| rms160 [mJy/beam] | 3.9 | 7.6 | 5.0 |
| Aperture [arcsec] | 20 | 15 | 20 |
| [mJy] | |||
| [mJy] | |||
| [″] | |||
| [″] | |||
| [∘] | |||
| [] | 13.5 | 60 | 5.0 |
| [K] | 8380 | 9340 | 6950 |
| [K] | 112 | 109 | 31, 354 |
| [AU] | 23 | 51 | 174, 1.4 |
| a𝑎aa𝑎aEstimates of radius are deconvolved from the beam, assuming sqrt(FWHM FWHM ). [AU] |
3 Results
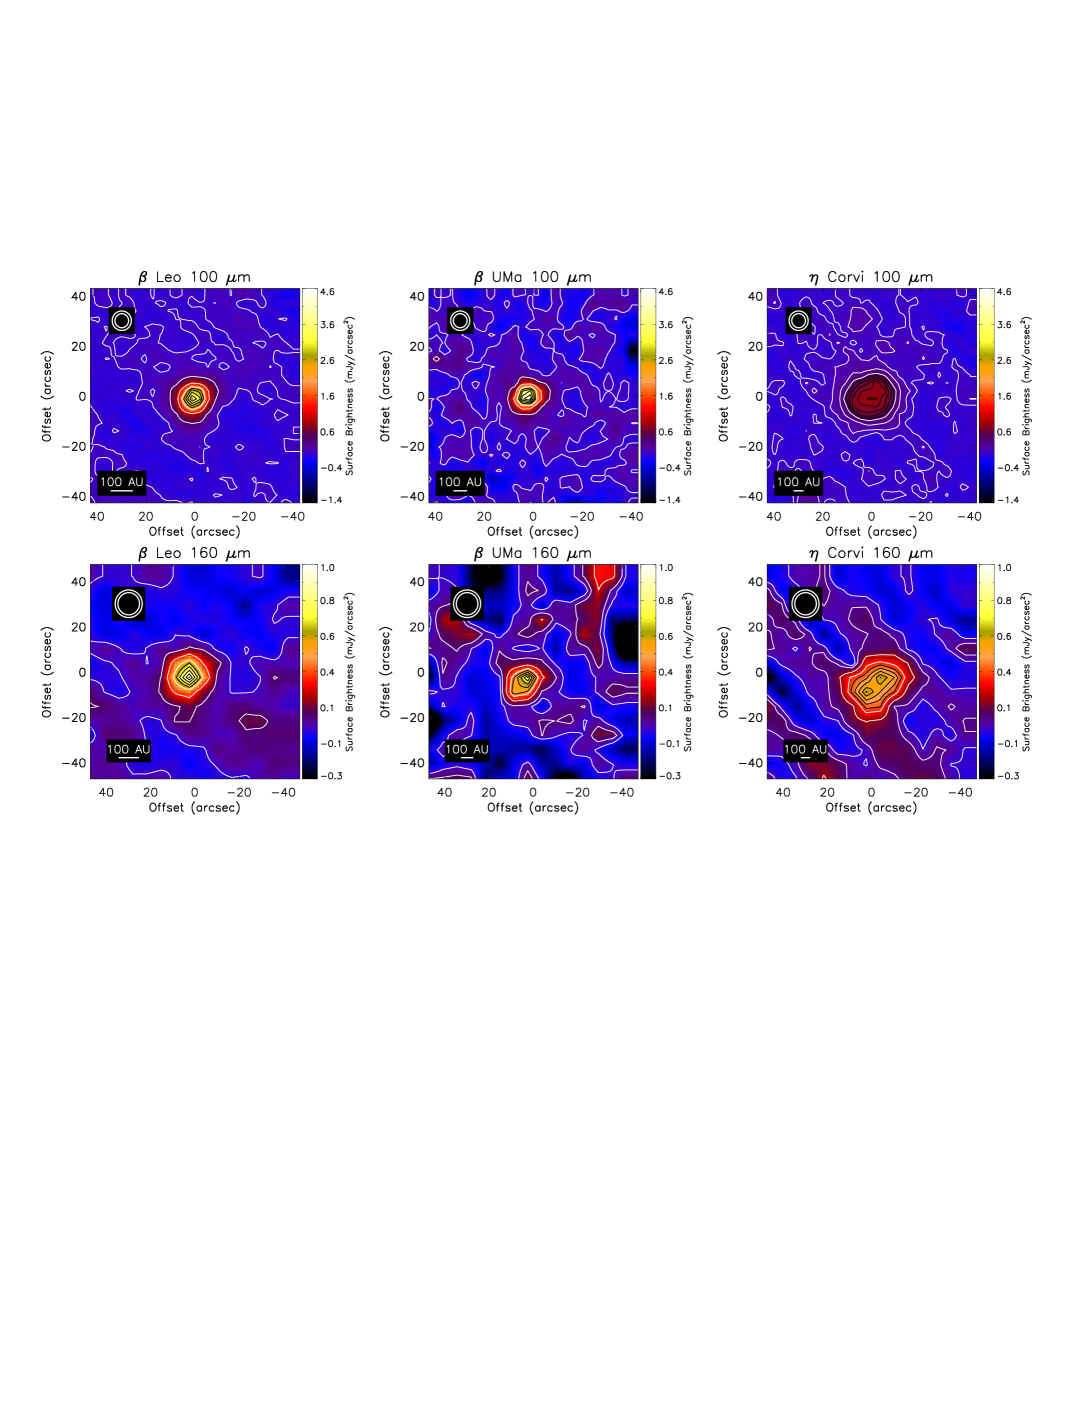
Figure 1 shows the 100 and 160 m images for the three targets. The rms levels achieved in each observation are summarized in Table 1. The higher noise levels associated with the point-source mode are evident. The scan map noise levels were significantly lower for comparable observing times and, for Corvi, meet the DEBRIS rms specifications. For Leo, the rms is higher by 15%.
The integrated flux densities are estimated for each image (star + disc). This is done with simple aperture photometry using apertures (see Table 1) centred on the peak emission. Poglitsch, Waelkens & Geis (2010) detail the flux calibration of PACS data and estimate the calibration uncertainties in the measured flux densities to be 10% and 20% for 100 and 160 m, respectively. The dominant flux calibration uncertainties have been combined in quadrature with statistical uncertainties from the rms levels in the maps. These combined uncertainties are applied to the fluxes in Table 1.
The flux densities reported in Table 1 are plotted on spectral energy distributions in Fig. 2. The disc components of Leo and UMa are well fit by a simple blackbody in the absence of submillimetre detections, but Corvi requires a two component fit to its disc emission: a warmer blackbody and a modified blackbody for the cold component to fit the submillimetre flux densities. The temperature, radius () and fractional luminosity of these fits are reported in Table 1.
Fitting of 2D Gaussians to each source at 100 m yields FWHM values (see Table 1) larger than the nominal PACS PSF of 67. Analysis of an observation of Vesta yields a PSF of 66 69. Vesta is a cool blackbody for which the response within the 100 m filter should be very similar to our dust discs. It has a temperature measured in the submillimetre at 130-160 K (Chamberlain, Lovell & Sykes 2007), slightly warmer than our two A-star dist discs at 110 K. Taking into account the spectral response theoretically, the range of FWHM varies by less than 5%, for slopes from to in . Larger PSFs have been measured yielding maxiumum dimensions as high as 73. Since only the long axis of the UMa disc exceeds this size, we claim this disc is marginally resolved. The Leo and Corvi discs are well resolved at 100 m. Estimates of deconvolved disc radius have been made from the FWHM. We call this radius estimate (Table 1).
4 Discussion
4.1 Leo
Figure 1 shows the first resolved images of the disc around Leo. The blackbody temperature and dust luminosity results given in Table 1 are consistent with the values found in previous works (Su et al. 2006; Holmes et al. 2003). The fractional dust luminosity of is 15% higher than the estimate from Su et al. (2006). The increase is due to a slight increase in dust to match the PACS flux densities.
The radius estimates found for Leo are comparable to that of the Kuiper Belt ( AU). This makes the Leo disc one of the smallest disc radii yet resolved at any wavelength (see, for instance, the ’Circumstellar Disks Database’222cirumstellardisks.org) although smaller characteristic orbital radii have been derived based on single temperature blackbody fits to the dust components (e.g., Rhee et al. 2007).
The difference between and provides an opportunity to learn about the grains within this disc. Because differently sized grains can have the same temperature at different distances from a star, the SED models in Fig. 2 are degenerate. This degeneracy is broken by the resolved imaging. For example, the 40 AU radius for the Leo disc is larger than the 23 AU suggested by the blackbody fit. Therefore, the grains do not emit as blackbodies, but maintain a 112 K temperature at a greater distance from the star as expected for small grains that emit inefficiently at far-IR wavelengths. The inferred characteristic particle radius is m. Future modeling work that combines Spitzer IRS spectra and submillimetre images with the Herschel data will constrain these grain properties and the spatial dust distribution (L. Churcher et al. 2010, in preparation).
4.2 UMa
Figure 1 shows that the disc emission around UMa is very compact at 100 and 160 m. The disc is marginally resolved at 100 m and not resolved at 160 m. The apparent asymmetry in the 160 m disc image is likely artificial; it is an effect of interpolation applied to the image at native (Nyquist sampled) resolution. The flux densities measured for UMa confirm the earlier 100 and 160 m detections.
The disc component of the UMa SED is well fit by blackbody grains with a temperature comparable to that of Leo, requiring a bigger disc around the more luminous star. Therefore, assuming black body grains the radial estimate is 51AU, equivalent to the deconvolved disc radius from the 2D Gaussian fit to the 100 m image. The resolved size thus suggests an absence of small grains such as that inferred for beta Leo in Sect. 4.1. More detailed modeling will be forthcoming in a future paper.
4.3 Corvi
The new Herschel images in Fig. 1 show that Corvi is resolved at both 100 and 160 m, as expected based on the AU submillimeter size derived by Wyatt et al. (2005). The variation in morphology from centrally peaked emission at 100 m to a double-peaked limb brightened ring at 160 m (as observed at 450 m) is consistent with an outer cool ring filled in by warmer dust which dominates the emission at 100 m. This could be evidence of the third temperature component proposed by Chen et al. (2006) and observed in Eri by Backman et al. (2009), although this was tentatively ruled out in mid-IR imaging by Smith, Wyatt & Dent (2008), and more generally suggests the radial distribution of material is broader than the two ring system originally envisaged by Wyatt et al. (2005).
The estimate from Table 1 is equivalent to the submillimetre size. The two intensity maxima in the 160 m image are roughly a beamwidth (11″) apart, identical to the 450 m SCUBA imaging of Wyatt et al. (2005) who inferred that the emission arises from a ring at moderate inclination. Fitting a 2D Gaussian to the 100 m image of Fig. 1 gives a position angle of 102°°and an inclination of 50° from the line of sight. The position angle of the two peaks at 160 m is °. These inclinations are consistent with the 450 m measurement of ° °.
A two component model of the SED of Fig. 2 shows similar results to Wyatt et al. (2005) who found disc components of 40 K and 370 K. The warm component (Smith, Wyatt & Haniff 2009; Smith, Wyatt & Dent 2008; Chen et al. 2006) shown in Fig. 2 has a blackbody temperature of 346 K, corresponding to a radial distance of 1.4 AU from the star. The cold component has a temperature of 33 K, corresponding to a radial separation of 160 AU from the star, consistent with . As for UMa, the resolved size suggests an absence of the small grains implied for Leo in Sect. 4.1.
Most importantly, the images in Fig. 1 provide an estimate of the disk size at wavelengths intermediate between the submillimetre (which shows emission at AU) and mid-IR (which shows emission at 3.5 AU). This will be crucial for modeling the origin of the far-infrared morphology, which most resembles the submillimetre emission. Simultaneously modeling these several images will constrain in more detail the dust properties of the disc system.
5 Summary
These early images of known debris disc hosts highlight the resolving power of Herschel. For Corvi, the addition of resolved images in the FIR provides important constraints on the outer disc grain properties, and our data support the presence of a warmer inner component to the cool outer ring. We have resolved the discs around Leo and (marginally) UMa for the first time and find that both have sizes on the order of the Kuiper Belt. Both are among the smallest discs yet resolved.
The DEBRIS project will push the detection limits for debris discs around nearby stars towards Kuiper-Belt levels. Spitzer volume-limited surveys achieved an rms of about 5 mJy at 70 m (e.g., Trilling et al. 2008), compared to our 1.2 mJy rms at 100 m, where the contrast to the photosphere is generally also increased. This improved sensitivity, coupled with the improved resolution of Herschel and when applied to the large sample of discs that DEBRIS will ultimately observe, will satisfy the paucity of direct measurements of disc sizes that currently impedes modelling of debris discs.
Acknowledgements.
We thank our referee, K. Stapelfeldt, for a constructive and insightful report. Support for this work, part of the NASA Herschel Science Center Key Program Data Analysis Program, was provided by NASA through a contract (No. 1353184, PI: H. M. Butner) issued by the Jet Propulsion Laboratory, California Institute of Technology under contract with NASA. This project is supported by a Space Science Enhancement Program grant from the Canadian Space Agency.References
- Backman et al. (2009) Backman, D., et al. 2009, ApJ, 690, 1522
- Beichman et al. (2006) Beichman, C. A., et al. 2006, ApJ, 652, 1674
- Chamberlain, Lovell & Sykes (2007) Chamberlain, M. A., Lovell, A. J., & Sykes, M. V. 2007, Icarus, 192, 448
- Chen et al. (2006) Chen, C. H., et al. 2006, ApJS, 166, 351
- Dominik & Decin (2003) Dominik, C., & Decin, G. 2003, ApJ, 598, 626
- Habing et al. (2001) Habing, H. J., et al. 2001, A&A, 365, 545
- Holmes et al. (2003) Holmes, E. K., Butner, H. M., Fajardo-Acosta, S. B., & Rebull, L. M. 2003, AJ, 125, 3334
- Ott (2010) Ott, S., 2010, in ASP Conference Series, Astronomical Data Analysis Software and Systems XIX, eds., Y. Mizumoto, K.-I. Morita, & M. Ohishi
- Phillips et al. (2010) Phillips, N. M., et al. 2010, MNRAS, 375
- Pilbratt et al. (2010) Pilbratt, G., et al. 2010, this volume
- Poglitsch, Waelkens & Geis (2010) Poglitsch, A., Waelkens, C., & Geis, N. 2010, this volume
- Rhee et al. (2007) Rhee, J. H., Song, I., Zuckerman, B., & McElwain, M. 2007, ApJ, 660, 1556
- Rhee, Song & Zuckerman (2008) Rhee, J. H., Song. I., & Zuckerman, B., 2008, ApJ, 675, 777
- Sheret, Dent & Wyatt (2004) Sheret, I., Dent, W. R. F., & Wyatt, M. C. 2004, MNRAS, 348, 1282
- Smith, Wyatt & Haniff (2009) Smith, R., Wyatt, M. C., & Haniff, C. A. 2009, A&A, 503, 265
- Smith, Wyatt & Dent (2008) Smith, R., Wyatt, M. C., & Dent, W. R. F. 2008, A&A, 485, 897
- Su et al. (2006) Su, K. Y. L., et al. 2006, ApJ, 653, 675
- Thébault & Augereau (2007) Thébault, P., & Augereau, J.-C. 2007, A&A, 472, 169
- Trilling et al. (2008) Trilling, D. E., et al. 2008, ApJ, 674, 1086
- Wyatt (2008) Wyatt, M. C. 2008, ARA&A, 46, 339
- Wyatt & Dent (2002) Wyatt, M. C., & Dent, W. R. F. 2002, MNRAS, 334, 589
- Wyatt et al. (2005) Wyatt, M. C., Greaves, J. S., Dent, W. R. F., & Coulson, I. M. 2005, ApJ, 620, 492
- Wyatt et al. (2007) Wyatt, M. C., et al. 2007, ApJ, 663, 365