Reversal of Fortune: Confirmation of an
Increasing Star
Formation-Density Relation in a Cluster at 11affiliation: This work is based in part on observations made with
the Spitzer Space Telescope, which is operated by the Jet Propulsion
laboratory, California Institute of Technology, under NASA contract
1407. This paper also includes data gathered with the 6.5 meter
Magellan Telescopes located at Las Campanas Observatory, Chile. This
work is based in part on data collected at Subaru Telescope, which is
operated by the National Astronomical Observatory of Japan.
Abstract
We measure the rest-frame colors (dust-corrected), infrared luminosities, star formation rates, and stellar masses of 92 galaxies in a Spitzer-selected cluster at . By fitting spectral energy distributions (SEDs) to 10-band photometry (mm) and measuring m fluxes for the 12 spectroscopically confirmed and 80 photometrically selected members, we discover an exceptionally high level of star formation in the cluster core of M⊙ yr-1 Mpc-2. The cluster galaxies define a strong blue sequence in color and span a range in color. We identify 17 members with L L⊙, and these IR luminous members follow the same trend of increasing star formation with stellar mass that is observed in the field at . Using rates derived from both the m imaging and SED fitting, we find that the relative fraction of star-forming members triples from the lowest to highest galaxy density regions, e.g. the IR luminous fraction increases from % at gal Mpc-2 to % at gal Mpc-2. The observed increase is a reversal of the well-documented trend at and signals that we have reached the epoch when massive cluster galaxies are still forming a substantial fraction of their stars.
Subject headings:
galaxies: evolution – galaxies: starburst – galaxies: clusters: individual (ClG J0218.3-0510) – infrared: galaxies1. Introduction
A well-established observational hallmark of how galaxies evolve as a function of environment is the star formation-galaxy density relation. A plethora of studies utilizing multi-wavelength tracers of activity have shown that star formation universally decreases with increasing galaxy density at (e.g. Hashimoto et al. 1998; Ellingson et al. 2001; Gómez et al. 2003; Patel et al. 2009). In particular, the cores of massive galaxy clusters are galaxy graveyards full of massive spheroidal systems that are dominated by old stellar populations. However, as we approach the epoch when these quiescent behemoths should be forming the bulk of their stars (; van Dokkum et al. 1998; Jørgensen et al. 2006; Rettura et al. 2010), the star formation-density relation should weaken and possibly reverse. Identifying when star formation is quenched as a function of galaxy mass and environment provides strong constraints on galaxy models (e.g. Kauffmann et al. 1993; Hopkins et al. 2008), i.e. is individual galaxy mass or the larger scale environment the primary driver of evolution?
Observations of field galaxies at indicate that the star formation-density relation turns over at this epoch such that there is an enhancement of activity in the highest density regions of the field (Elbaz et al. 2007; Cooper et al. 2008). Studies also find an excess of dust-obscured star formation in group environments at (Koyama et al. 2008; Tran et al. 2009; Gallazzi et al. 2009), and very recent results suggest that star formation may be enhanced in the significantly richer core of a galaxy cluster at (Hilton et al. 2010). As cluster surveys push to higher redshifts () and thus closer to the epoch when massive galaxies are forming their stars, variations in age will become evident in, e.g. a larger scatter in color, and robust star formation rates should reveal increasing levels of activity even in the cluster cores.
We report here the first confirmation of increasing star formation activity with increasing galaxy density observed in cluster ClG J0218.3-05101, a Spitzer-selected galaxy cluster at (Papovich et al. 2010, hereafter Pap10). We use cosmological parameters , , and km s-1 Mpc-1 throughout the paper; at , this corresponds to an angular scale Mpc arcmin-1. All magnitudes are in the AB system.
2. Multi-wavelength Data
ClG J0218.3-0510 has a wealth of multi-wavelength imaging data that includes imaging from the Subaru-XMM Deep Survey (Furusawa et al. 2008) and imaging from the UKIRT IR Deep Sky Survey (UKIDSS, Lawrence et al. 2007); for these data, we utilized the –selected catalog from Williams et al. (2009). The cluster field also has deep Spitzer imaging available in the four IRAC bands (3.6–8.0m) and MIPS m as part of the Spitzer public legacy survey of the UKIDSS Ultra Deep Survey (SpUDS, PI: J. Dunlop)111http://ssc.spitzer.caltech.edu/spitzermission/observingprograms/legacy/spuds/. We matched the –band selected catalog to the IRAC data following Papovich et al. (2006).
ClG J0218.3-05101 was originally detected as a strong overdensity of galaxies at with a mean surface density higher than that of galaxies in the same redshift range in the UKIDSS Ultra-Deep Survey (Lawrence et al. 2007). Follow-up spectroscopy confirmed 10 members that define a narrow redshift peak at with additional members at and (Pap10; Tanaka et al. 2010). In our analysis, we include 80 more members that are selected from photometric redshifts determined with EAZY (Brammer et al. 2008); we use the limit for the integrated redshift probability defined by the spectroscopically confirmed members (; see Pap10 for a detailed description of the photometric selection).
Analysis of XMM-Newton data in this field also reveals a weak detection consistent with extended emission from the cluster. The cluster mass estimated from its X-ray luminosity is M⊙ and consistent with its estimated dynamical mass of M⊙. To define the cluster center, we select the massive (spectroscopically confirmed) member located at the peak of the X-ray emission: its J2000 coordinates are (2:18:21.07, -5:10:32.84), and all of the cluster galaxies lie within Mpc of this member.
2.1. Spectral Energy Distributions
We fit the 10–band galaxy photometry (mm)222At , this corresponds to a rest-frame wavelength range of mm. with the 2007 version of the Bruzual & Charlot (2003) stellar population synthesis models using a Chabrier initial mass function (for more details, see Papovich et al. 2006). We find that models with Solar metallicity best reproduce the rest-frame colors and scatter of the cluster red sequence galaxies (Pap10), and we allow the models to range in age from to yr; we also include dust attenuation using the Calzetti et al. (2000) law with color excess values ranging from . We allow for a range of star formation histories parameterized as a decaying exponential with an –folding time , where at any age the star formation rate is and ranges from 1 Myr to 100 Gyr (corresponding approximately to instantaneous bursts to constant star formation, respectively). In the model fitting, we add a % error in quadrature to the photometric uncertainties on each band to account for mismatches in the multi-band photometry, and for the fact that the models do not continuously sample the model parameter space. Our sample of 92 cluster members has an average best-fit age of Myr and an average best-fit of Myr; 35 members have SED-derived star formation rates 5 M⊙ yr-1.
2.2. MIPS m Fluxes
The cluster field was imaged with Spitzer MIPS as part of the legacy UKIDSS Ultra Deep Survey (SpUDS PI: J. Dunlop). We extracted sources from the public SpUDS m map using StarFinder (Diolaiti et al. 2000), an IDL-based PSF-fitting code designed for crowded fields. The m image has 1.245″pixel-1, and we derived a model PSF and aperture corrections from the brightest isolated sources from the SpUDS image. The catalog includes all sources detected with ; this corresponds to a flux of Jy. Using simulated sources based on the PSF and injected into the map, we determine that the catalog is 80% complete at this flux level.
The measured m fluxes are converted into total infrared luminosities (LIR) using the Chary & Elbaz (2001) templates. Recent Herschel studies indicate that while this technique is very accurate at , extrapolations from monochromatic m fluxes overestimate the true by factors of at (e.g. Nordon et al. 2010). Finally, star formation rates are calculated from using the prescription of Kennicutt (1998), adjusted to the Chabrier IMF.
3. Stellar Masses, Star Formation Rates, and Environment
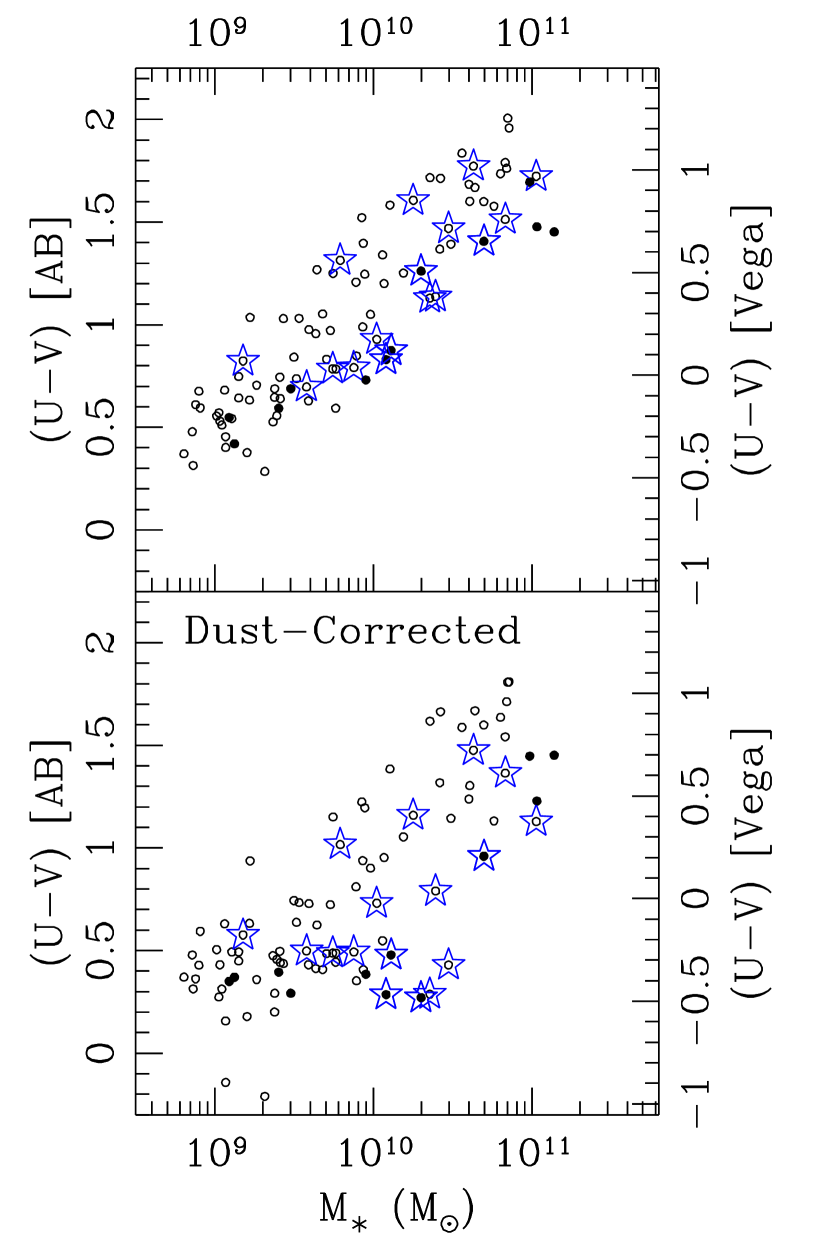
By fitting SEDs to the 10-band photometry (mm), we are able to measure accurate rest-frame colors (AB system) and stellar masses as well as correct for dust extinction. Figure 1 shows the measured and dust-corrected rest-frame color versus stellar mass for the 92 cluster galaxies within Mpc of the BCG. As demonstrated by, e.g. Wyder et al. (2007), the galaxies begin to separate into the well-known bimodal distribution only when the colors are corrected for extinction.
The ClG J0218.3-0510 members differ from their counterparts in clusters at (e.g. Holden et al. 2006; Rettura et al. 2010) in that they have a color-stellar mass distribution that is surprisingly similar to that observed in the field at (Brammer et al. 2009): the ClG J0218.3-0510 members define a strong blue sequence and span a range in (dust-corrected) color (Fig. 2, bottom panel). While these members populate a red sequence in the color-magnitude diagram (Pap10), the correlation between rest-frame color and stellar mass is visibly weaker333The astute reader will notice that the red sequence is tighter in color because these filters correspond approximately to rest-frame at .. However, the most massive galaxies (M M⊙) are still the reddest, i.e. they have the oldest stellar populations.
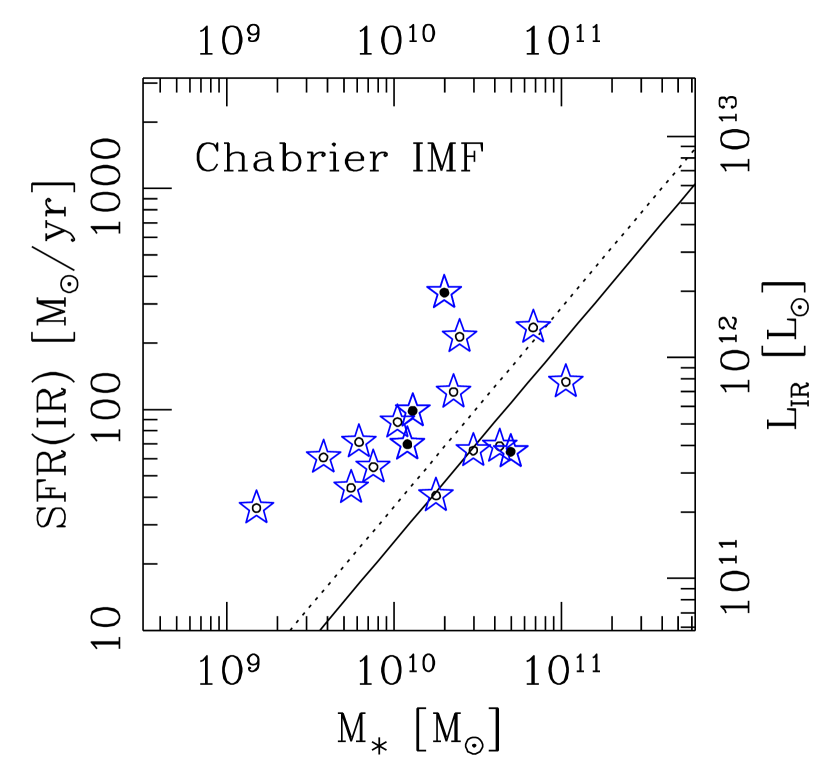
Seventeen of the members are detected at m (Fig. 1), and the most IR luminous members include some of the most massive cluster galaxies (Fig. 2). Figure 2 shows that these IR luminous members follow the same trend of increasing star formation with stellar mass that is observed in the field at by Daddi et al. (2007). Note that because we can only detect members that are IR-bright (L L⊙), we are sensitive only to the upper envelope of the trend observed at .
Three of the ClG J0218.3-0510 members are Ultra-Luminous Infrared Galaxies (ULIRGs; L L⊙; see Fig. 2) and the remaining 14 are LIRGs (L L⊙). In stark contrast, of the galaxies in clusters at studied with wide-field ( Mpc) mid-IR imaging (e.g. Geach et al. 2006; Saintonge et al. 2008; Smith et al. 2010), only one is a ULIRG and it lies outside the core of the Bullet Cluster, a well-known cluster-cluster merger at (Chung et al. 2010). The higher fraction of IR luminous galaxies at is likely to be driven by the overall evolution of the IR luminosity function in clusters (e.g. Bai et al. 2009); however, more deep IR imaging of clusters at is needed to confirm this trend.
In our analysis, we assume that the m sources are dominated by star formation and do not harbor active galactic nuclei (AGN). From the SED fits, we find that two of the m detected members do have emission at m (IRAC channel 4) that deviates from the stellar fit, i.e. have a power-law component indicative of an AGN, and one of these galaxies is the most IR luminous member with L [L⊙] (see Fig. 2). However, studies find that most of the emission (%) in ULIRGs is due to star formation (Farrah et al. 2008), thus these members are likely to have both strong star formation and an AGN component. Note that at , the m PAH band lies partly in the m channel. Because part of the IR luminosity is due to star formation, we include both m members in our analysis; repeating our analysis without these two members confirms that our overall results do not change.
In the cluster core ( Mpc), the star formation rate density from the m photometry alone is M⊙ yr-1 Mpc-2; we stress that this is likely a lower limit given the m imaging cannot detect any members with SFR M⊙ yr-1, i.e. with star formation rates typical for IR-detected galaxies in clusters at . Only one other galaxy cluster at has a comparably high star formation rate in its core (Hayashi et al. 2010; Hilton et al. 2010). In comparison, studies of IR-detected galaxies in clusters at find that star-forming members are strongly segregated at Mpc (Geach et al. 2006; Saintonge et al. 2008; Koyama et al. 2008).
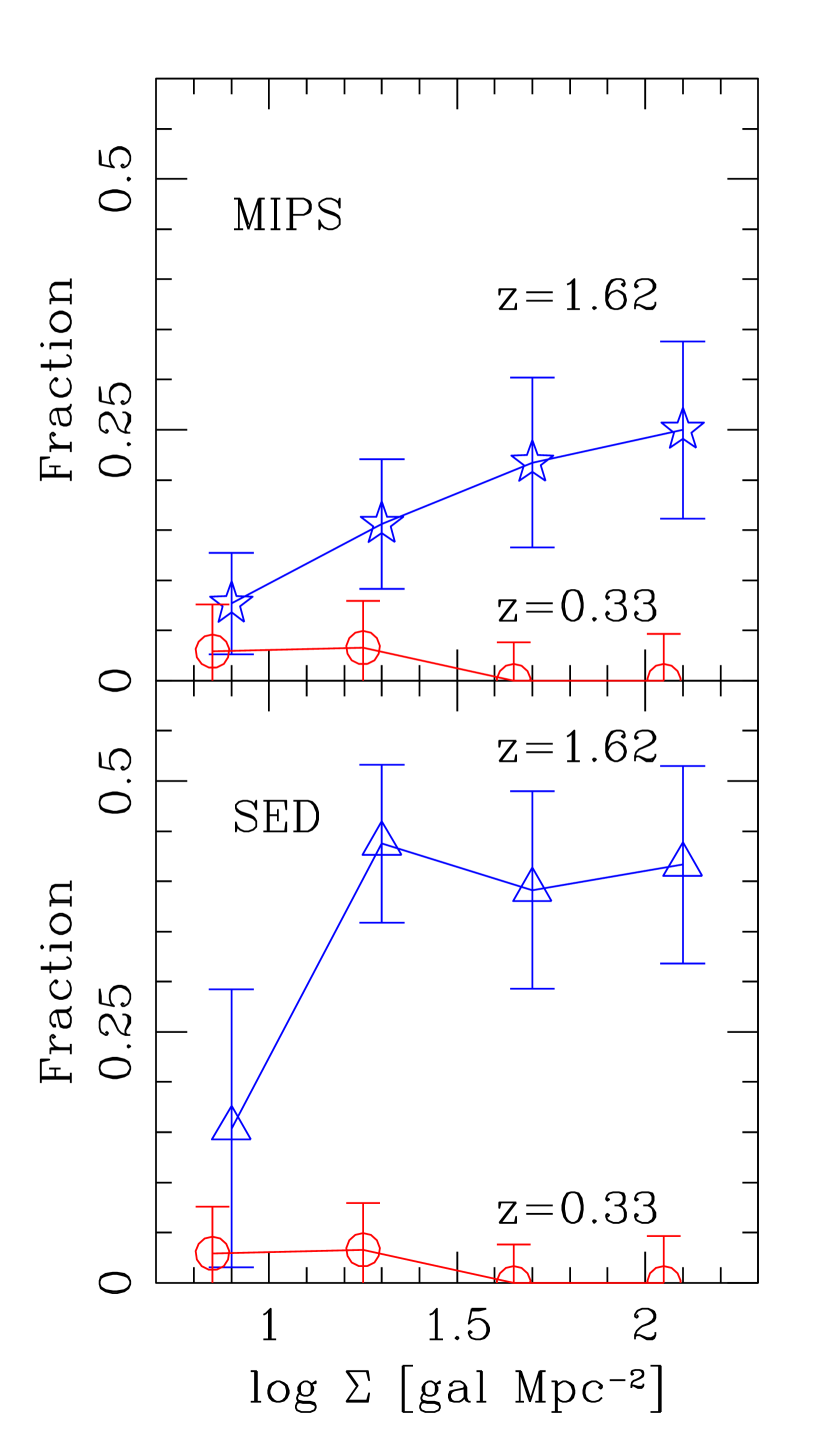
Given the high star formation rate in its core, does ClG J0218.3-0510 follow the well-established trend at of decreasing star-formation with increasing galaxy density (e.g. Hashimoto et al. 1998; Ellingson et al. 2001; Gómez et al. 2003)? Figure 3 compares the relative fraction of star-forming members to passive members as a function of local galaxy density () which is defined by distance to the 10th nearest neighbor (Dressler 1980). We use star-formation rates derived from the m imaging as well as from the SED fitting because the two independent star formation tracers complement each other and provide an important check of our results: The m imaging is a robust measure of the dust-obscured star formation but only detects the most active members ( M⊙ yr-1) while the SED fitting is sensitive to lower levels of unobscured activity (5 M⊙ yr-1).
Both star formation tracers confirm that the relative fraction of active members is highest in the regions of highest galaxy density (Fig. 3), i.e. exactly opposite to that observed in clusters at . A Spearman rank test supports with % confidence ( significance) that the relative fraction of IR luminous members increases with increasing galaxy density from % at gal Mpc-2 to % at gal Mpc-2. We stress that excluding the two candidate AGN does not change the trend, and the robustness of this result is underscored by the fact that we see the same trend using the SED-derived rates. While studies of galaxies in the field at ( gal Mpc-2) find that the star formation-density relation is beginning to turn over at this epoch (Elbaz et al. 2007; Cooper et al. 2008), this is the first confirmation of such a reversal in the significantly higher density environment of galaxy clusters.
The measured IR luminosities correspond to specific star formation rates (star formation rate divided by stellar mass; SSFR) per Gyr of : these active members can more than double their stellar masses in the next Gyr (by ). However, to reproduce the relatively homogeneous stellar ages measured in massive cluster galaxies at (e.g. Blakeslee et al. 2006; Tran et al. 2007; Mei et al. 2009), these IR luminous members cannot maintain such a high SSFR for even a Gyr. The current star formation must be quenched rapidly and any later bursts of activity cannot add a substantial amount of new stars, at least not in the massive members (M [M⊙]) that must populate a well-defined red sequence by .
4. Conclusions
We measure the rest-frame colors (dust-corrected), IR luminosities, star formation rates, and stellar masses of galaxies in ClG J0218.3-0510, a Spitzer-selected cluster at , by fitting spectral energy distributions to photometry in 10 bands (mm) and with deep m imaging. The cluster sample (Pap10; Tanaka et al. 2010) is composed of 12 spectroscopically confirmed members and 80 members selected from photometric redshifts measured using EAZY (Brammer et al. 2008); all members are within Mpc of the massive cluster galaxy located at the peak of the X-ray emission.
The 92 cluster members have a color-stellar mass distribution that is surprisingly similar to that observed in field galaxies at . When corrected for dust, the cluster members define a strong blue sequence and span a range in color, indicating a substantial amount of recent and ongoing star formation in the cluster core. This dramatic level of activity is underscored by the 17 members detected at m. In the cluster core ( Mpc), the star formation rate density from the IR luminous members alone is M⊙ yr-1 Mpc-2; the true value is likely to be higher given that we only include members with SFR M⊙ yr-1. These IR luminous members also follow the same trend of increasing star formation with stellar mass that is observed in the field at .
We discover the striking result that the the relative fraction of star-forming galaxies increases with increasing local galaxy density in ClG J0218.3-0510, a reversal of the well-established trend at lower redshifts and in line with recent work at that suggests enhanced star formation in cluster cores. Measurements using star formation rates derived from the m imaging and from the SED fitting provide independent confirmation that the relative fraction of star-forming galaxies triples from the lowest to highest density regions. By pushing into the redshift desert (), we are able to reach the epoch when massive cluster galaxies are still forming a significant number of their stars.
References
- Bai et al. (2009) Bai, L., Rieke, G. H., Rieke, M. J., Christlein, D., & Zabludoff, A. I. 2009, ApJ, 693, 1840
- Blakeslee et al. (2006) Blakeslee, J. P., Holden, B. P., Franx, M., Rosati, P., & et al. 2006, ApJ
- Brammer et al. (2008) Brammer, G. B., van Dokkum, P. G., & Coppi, P. 2008, ApJ, 686, 1503
- Brammer et al. (2009) Brammer, G. B., Whitaker, K. E., van Dokkum, P. G., Marchesini, D., Labbé, I., Franx, M., Kriek, M., Quadri, R. F., Illingworth, G., Lee, K., Muzzin, A., & Rudnick, G. 2009, ApJ, 706, L173
- Bruzual & Charlot (2003) Bruzual, G. & Charlot, S. 2003, MNRAS, 344, 1000
- Calzetti et al. (2000) Calzetti, D., Armus, L., Bohlin, R. C., Kinney, A. L., Koornneef, J., & Storchi-Bergmann, T. 2000, ApJ, 533, 682
- Chary & Elbaz (2001) Chary, R. & Elbaz, D. 2001, ApJ, 556, 562
- Chung et al. (2010) Chung, S. M., Gonzalez, A. H., Clowe, D., Markevitch, M., & Zaritsky, D. 2010, ArXiv e-prints
- Cooper et al. (2008) Cooper, M. C., Newman, J. A., Weiner, B. J., Yan, R., Willmer, C. N. A., Bundy, K., & et al. 2008, MNRAS, 383, 1058
- Daddi et al. (2007) Daddi, E., Dickinson, M., Morrison, G., Chary, R., & et al. 2007, ApJ, 670, 156
- Diolaiti et al. (2000) Diolaiti, E., Bendinelli, O., Bonaccini, D., Close, L., Currie, D., & Parmeggiani, G. 2000, A&AS, 147, 335
- Dressler (1980) Dressler, A. 1980, ApJ, 236, 351
- Elbaz et al. (2007) Elbaz, D., Daddi, E., Le Borgne, D., Dickinson, M., Alexander, D. M., Chary, R.-R., Starck, J.-L., & et al. 2007, A&A, 468, 33
- Ellingson et al. (2001) Ellingson, E., Lin, H., Yee, H. K. C., & Carlberg, R. G. 2001, ApJ, 547, 609
- Farrah et al. (2008) Farrah, D., Lonsdale, C. J., Weedman, D. W., Spoon, H. W. W., Rowan-Robinson, M., Polletta, M., Oliver, S., Houck, J. R., & Smith, H. E. 2008, ApJ, 677, 957
- Furusawa et al. (2008) Furusawa, H., Kosugi, G., Akiyama, M., Takata, T., Sekiguchi, K., Tanaka, I., Iwata, I., Kajisawa, M., & et al. 2008, ApJS, 176, 1
- Gómez et al. (2003) Gómez, P. L., Nichol, R. C., Miller, C. J., Balogh, M. L., Goto, T., Zabludoff, A. I., Romer, A. K., Bernardi, M., Sheth, R., Hopkins, A. M., Castander, F. J., Connolly, A. J., Schneider, D. P., Brinkmann, J., Lamb, D. Q., SubbaRao, M., & York, D. G. 2003, ApJ, 584, 210
- Gallazzi et al. (2009) Gallazzi, A., Bell, E. F., Wolf, C., Gray, M. E., Papovich, C., Barden, M., Peng, C. Y., Meisenheimer, K., & et al. 2009, ApJ, 690, 1883
- Geach et al. (2006) Geach, J. E., Smail, I., Ellis, R. S., Moran, S. M., Smith, G. P., Treu, T., Kneib, J., Edge, A. C., & Kodama, T. 2006, ApJ, 649, 661
- Hashimoto et al. (1998) Hashimoto, Y., Oemler, A. J., Lin, H., & Tucker, D. L. 1998, ApJ, 499, 589
- Hayashi et al. (2010) Hayashi, M., Kodama, T., Koyama, Y., Tanaka, I., Shimasaku, K., & Okamura, S. 2010, MNRAS, 402, 1980
- Hilton et al. (2010) Hilton, M., Lloyd-Davies, E., Stanford, S. A., Stott, J. P., Collins, C. A., Romer, A. K., Hosmer, M., & et al. 2010, ArXiv e-prints
- Holden et al. (2006) Holden, B. P., Franx, M., Illingworth, G. D., Postman, M., Blakeslee, J. P., Homeier, N., Demarco, R., Ford, H. C., Rosati, P., Kelson, D. D., & Tran, K.-V. H. 2006, ApJ, 642, L123
- Hopkins et al. (2008) Hopkins, P. F., Cox, T. J., Kereš, D., & Hernquist, L. 2008, ApJS, 175, 390
- Jørgensen et al. (2006) Jørgensen, I., Chiboucas, K., Flint, K., Bergmann, M., Barr, J., & Davies, R. 2006, ApJ, 639, L9
- Kauffmann et al. (1993) Kauffmann, G., White, S. D. M., & Guiderdoni, B. 1993, MNRAS, 264, 201
- Kennicutt (1998) Kennicutt, R. C. 1998, ARA&A, 36, 189
- Koyama et al. (2008) Koyama, Y., Kodama, T., Shimasaku, K., Okamura, S., & et al. 2008, MNRAS, 391, 1758
- Lawrence et al. (2007) Lawrence, A., Warren, S. J., Almaini, O., Edge, A. C., Hambly, N. C., Jameson, R. F., Lucas, P., & Casali, M. a. a. 2007, MNRAS, 379, 1599
- Mei et al. (2009) Mei, S., Holden, B. P., Blakeslee, J. P., Ford, H. C., Franx, M., Homeier, N. L., Illingworth, G. D., & et al. 2009, ApJ, 690, 42
- Nordon et al. (2010) Nordon, R., Lutz, D., Shao, L., Magnelli, B., Berta, S., Altieri, B., Andreani, P., Aussel, H., & et al. 2010, ArXiv e-prints
- Papovich et al. (2010) Papovich, C., Momcheva, I., Willmer, C. N. A., Finkelstein, K. D., Finkelstein, S. L., Tran, K., & et al. 2010, ApJ, 716, 1503
- Papovich et al. (2006) Papovich, C., Moustakas, L. A., Dickinson, M., Le Floc’h, E., Rieke, G. H., Daddi, E., Alexander, D. M., & et al. 2006, ApJ, 640, 92
- Patel et al. (2009) Patel, S. G., Holden, B. P., Kelson, D. D., Illingworth, G. D., & Franx, M. 2009, ApJ, 705, L67
- Rettura et al. (2010) Rettura, A., Rosati, P., Nonino, M., Fosbury, R. A. E., Gobat, R., Menci, N., Strazzullo, V., Mei, S., Demarco, R., & Ford, H. C. 2010, ApJ, 709, 512
- Saintonge et al. (2008) Saintonge, A., Tran, K.-V. H., & Holden, B. P. 2008, ApJ, 685, L113
- Smith et al. (2010) Smith, G. P., Haines, C. P., Pereira, M. J., Egami, E., Moran, S. M., Hardegree-Ullman, E., Babul, A., Rex, M., Rawle, T. D., Zhang, Y., & et al. 2010, ArXiv e-prints
- Tanaka et al. (2010) Tanaka, M., Finoguenov, A., & Ueda, Y. 2010, ApJ, 716, L152
- Tran et al. (2009) Tran, K., Saintonge, A., Moustakas, J., Bai, L., Gonzalez, A. H., Holden, B. P., Zaritsky, D., & Kautsch, S. J. 2009, ApJ, 705, 809
- Tran et al. (2007) Tran, K.-V. H., Franx, M., Illingworth, G. D., van Dokkum, P., Kelson, D. D., Blakeslee, J. P., & Postman, M. 2007, ApJ, 661, 750
- van Dokkum et al. (1998) van Dokkum, P. G., Franx, M., Kelson, D. D., & Illingworth, G. D. 1998, ApJ, 504, L17
- Williams et al. (2009) Williams, R. J., Quadri, R. F., Franx, M., van Dokkum, P., & Labbé, I. 2009, ApJ, 691, 1879
- Wyder et al. (2007) Wyder, T. K., Martin, D. C., Schiminovich, D., Seibert, M., Budavári, T., Treyer, M. A., & et al. 2007, ApJS, 173, 293