Variability of the H line profiles as an indicator of orbiting bright spots in accretion disks of quasars: a case study of 3C 390.3
Abstract
Here we show that in the case when double peaked emission lines originate from outer parts of accretion disk, their variability could be caused by perturbations in the disk emissivity. In order to test this hypothesis, we introduced a model of disk perturbing region in the form of a single bright spot (or flare) by a modification of the power law disk emissivity in appropriate way. The disk emission was then analyzed using numerical simulations based on ray-tracing method in Kerr metric and the corresponding simulated line profiles were obtained. We applied this model to the observed H line profiles of 3C 390.3 (observed in the period 1995-1999), and estimated the parameters of both, accretion disk and perturbing region. Our results show that two large amplitude outbursts of the H line observed in 3C 390.3 could be explained by successive occurrences of two bright spots on approaching side of the disk. These bright spots are either moving, originating in the inner regions of the disk and spiralling outwards by crossing small distances during the period of several years, or stationary. In both cases, their widths increase with time, indicating that they most likely decay.
1 Introduction
The huge amount of Active Galactic Nucleus (AGN) energy is released through accretion onto super-massive black hole (BH), supposed to exist in the center of AGN. The emission of the accretion disk is not only in the continuum, but also in the emission lines (e.g. in Fe K line) and in low ionization lines, as e.g. in broad Balmer emission lines which are seen as double peaked (DP). DP Balmer lines are found in 20% of radio loud AGN at (Eracleous & Halpern, 1994, 2003) and 4% of the Sloan digital Sky Survey (SDSS) quasars at (Strateva et al., 2003).
Broad, double-peaked emission lines of AGN provide dynamical evidence for presence of an accretion disk feeding a supermassive black hole in the center of AGN. But in some cases, the variability of these lines shows certain irregularities which could not be explained just by standard model of accretion disk.
The DP line profiles are often used to extract the disk parameters (see e.g. Chen et al., 1989; Chen & Halpern, 1990; Eracleous & Halpern, 1994, 2003; Strateva et al., 2008; Eracleous et al., 2009). In a series of papers Dumont & Collin-Souffrin (see Collin-Souffrin, 1987; Collin-Souffrin & Dumont, 1990; Dumont & Collin-Souffrin, 1990a, b, c, and references therein) investigated the radial structure and emission of the outer regions of the optically thin accretion disks in AGN and calculated detailed grid of photoionisation models in order to predict the relative strengths of low-ionization lines emitted from the disk. They obtained integrated line intensities and line profiles emitted at each radius of the disk, for its different physical parameters. They also studied the influence of the external illumination on the structure of the disk, considering the point source model, where a compact source of non-thermal radiation located at a given height illuminates the disk and the diffusion model, where the radiation of a central source is scattered back towards the disk by a hot diffusing medium. One of the first methods for calculating the profiles of optical emission lines from a relativistic accretion disk was proposed by Chen et al. (1989). The limitation to this method is that the accretion disk structure required to explain the variability of the line profiles cannot be axi-symmetric, i.e. very often the red peak is higher than blue one and that cannot be explained by this model. It is not possible in a circular disk, in which the blue peak is always Doppler boosted to be stronger than the red peak. Therefore, Eracleous et al. (1995) adapted the circular accretion disk model to elliptical disks in order to fit the profiles of double-peaked emitters with a red peak stronger than the blue one. This model introduced eccentricity and phase angle parameters to the circular model described above, and the pericenter distance of the elliptical orbits (see Eracleous et al., 1995).
Spectroscopic monitoring of double-peaked emitters (see e.g. Shapovalova et al., 2001; Gezari et al., 2007; Shapovalova et al., 2009) has revealed that a ubiquitous property of the double-peaked broad emission lines is variability of their profile shapes on the timescales of months to years. DP line profiles are observed to vary on timescales of months to years, i.e. on timescales of the order of the dynamical time or longer (e.g. Veilleux & Zheng, 1991; Zheng et al., 1991; Marziani et al., 1993; Romano et al., 1998; Sergeev et al., 2000; Shapovalova et al., 2001; Storchi-Bergmann et al., 2003; Gezari et al., 2007).
This slow, systematic variability of the line profile is on the timescale of dynamical changes in an accretion disk, and has been shown to be unrelated to the shorter timescale variability seen in the overall flux in the line, due to reverberation of the variable ionizing continuum. Patterns in the variability of the broad Balmer lines are often a gradual change and reversal of the relative strengths of the blue-shifted and red-shifted peaks (see e.g. Newman et al., 1997).
Periodic variability of the red and blue peak strengths has also been attributed to a precessing elliptical disk, a precessing single-armed spiral (as e.g. 3C 332, 3C 390.3: Gilbert et al. (1999); NGC 1097: Storchi-Bergmann et al. (2003)), and a precessing warp in the disk. For instance, Wu et al. (2008) computed the profiles of Balmer emission lines from a relativistic, warped accretion disk in order to explore the certain asymmetries in the double-peaked emission line profiles which cannot be explained by a circular Keplerian disk. Elliptical disks and spiral waves have been detected in cataclysmic variables (Steeghs et al., 1997; Baptista & Catalán, 2000), and a radiation induced warp has been detected in the large-scale disk of the AGN NGC 4258 (Maloney et al., 1996).
Spiral waves are a physically desirable model since they can be produced by instability in the vicinity of a black hole. They can play an important role in accretion disks, because they provide a mechanism for transporting angular momentum outward in the disk, allowing the gas to flow inwards, towards the central black hole. Long-term profile variability is thus a useful tool for extracting information about the structure and dynamics of the accretion disk most likely producing the double-peaked emission lines.
In this paper, we present an investigation of the disk line variations due to instability in accretion disk. First we developed a model, assuming that instability in the accretion disk affects disk emissivity. This model and some simulations of expected line profile variability are presented in §2. In §3 we compare the model with observations taken from long-term monitoring of 3C 390.3 (Shapovalova et al., 2001) in order to obtain parameters of perturbations. In §4 we discuss our results in the light of possible physical mechanisms which could cause such perturbations, and finally, in §5 we outline our conclusions.
2 The model of perturbation in the accretion disk
Here we introduce the model and some approximations used in the simulations of accretion disk perturbation.
2.1 Long term variation of DP line profiles: some assumptions and problems
As we mentioned above, the DP line profile variability does not appear to correlate with changes in the line and/or continuum flux, and consequently one can assume that the changes in line profile are likely caused by changes in the accretion disk structure. There are several examples of the long-term variability (on timescales of several years) of the DP line profile of some objects which has been successfully modeled by the precession of a non-axisymmetric accretion disk, such as an elliptical disk or a disk with a spiral arm (Gezari et al., 2007; Storchi-Bergmann et al., 2003; Shapovalova et al., 2001; Gilbert et al., 1999, and references therein). These models, however, fail to explain the long-term variability of some objects and the short-term variability (on timescales from several months to a year) of all objects (Lewis, 2005; Lewis et al., 2010). For instance, Lewis et al. (2010) found that the two simple models, an elliptical accretion disk and a circular disk with a spiral arm, are unable to reproduce all aspects of the observed variability, although both account for some of the observed behaviors. Therefore, these authors suggest that many of the observed variability patterns could be reproduced assuming a disk with one or more fragmented spiral arms.
Other attempts to explain the DP line profile variability through perturbations of the disk structure introduced bright spots over an axisymmetric accretion disk. As an example Newman et al. (1997) successfully modeled the variation of the H peak intensity ratio of Arp 102B with a single spot rotating within the disk, but Gezari et al. (2007) were not able to apply the same model to the same object at a different time period.
In the case of Fe K variability Turner et al. (2006) used the spot model to explain the variability of the iron line profile of Mrk 766 in the X-ray band. Also, Dovčiak et al. (2008) studied variations of the iron line due to an orbiting spot which arise by reflection on the surface of an accretion disk, following its illumination by an X-ray flare in form of an off-axis point-like source just above the accretion disk. Besides the spots in accretion disk, the Fe K line of some AGN could be also significantly affected by highly-ionized fast accretion disk outflows. For instance, Sim et al. (2010) found that the major features in the observed 2 – 10 keV spectrum of the bright quasar PG1211+143 can be well reproduced by their Monte Carlo radiative transfer simulations which include a variety of disk wind (outflow) models.
To explain the short-timescale variability of the DP line profiles Flohic & Eracleous (2008) constructed stochastically perturbed accretion disk models and calculated H line profile series as the bright spots rotate, shear and decay. They ruled out spot production by star/disk collisions and favor a scenario where the radius of marginal self-gravity is within the line emitting region, creating a sharp increase in the radial spot distribution in the outer parts.
2.2 The model of bright spot–like perturbing region
We model the emission from accretion disk using numerical simulations based on ray-tracing method in Kerr metric (see e.g. Jovanović & Popović, 2009a, and references therein). Although this method was developed for studying the X-ray radiation which originates from the inner parts of the disk close to the central black hole (see e.g. Jovanović & Popović, 2008a), it can be also successfully applied for modelling the UV/optical emission which originates from the outer regions of the disk111As shown in Jovanović & Popović (2008a), the effects of strong gravitational field and angular momentum of rotating black hole are significant only in the innermost parts of accretion disk, in vicinity of the central supermassive black hole, up to the several dozens of gravitational radii. In the outer parts of the disk, such as those where H line originates, these effects are negligible and Kerr metric with zero angular momentum, i.e. Schwarzschild metric, is a very good approximation..
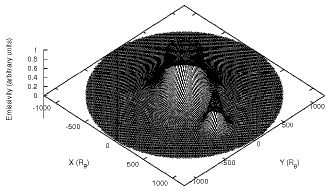
Surface emissivity of the disk is usually assumed to vary with radius as a power law (e.g. Popović et al., 2003): where is an emissivity constant and – emissivity index. Total observed flux is then given by:
| (1) |
where is the energy shift due to the relativistic effects: , is the rest energy of the line, is the local turbulent broadening and is the solid angle subtended by the disk in the observer’s sky.
In this paper we adopt the following modification of the power-law disk emissivity, in order to introduce a bright spot–like perturbing region in the disk (Jovanović & Popović, 2008b, 2009a, 2009b; Stalevski et al., 2008):
| (2) |
where is the modified disk emissivity at the given position expressed in gravitational radii , is the ordinary power-law disk emissivity at the same position, is emissivity of the perturbing region (i.e. amplitude of the bright spot), is the position of perturbing region with respect to the disk center (in ) and are its widths (also in ). A 3D plot of above expression for modified emissivity law is given in Fig. 1.
This simple model is suitable for our purpose because it allows us to change amplitude, width and location of bright spot in respect to the disk center. In that way we are able to simulate displacement of bright spot along the disk, its widening and amplitude decrease with time (decay). Moreover, the above bright spot model can be successfully applied for studying the variations of accretion disk emission in different spectral bands, from X-rays to optical band (see e.g. Jovanović & Popović, 2008b, 2009b; Stalevski et al., 2008).
3 Results: Model vs. observations
3.1 Perturbation in the accretion disk: modeled profiles
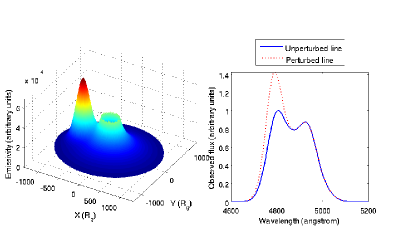
In order to test how this model of bright spot affects the H line profile, we performed several numerical simulations of perturbed emission of an accretion disk in Kerr metric for different positions of bright spot along and -axes in both, positive and negative directions. For these simulations we adopted the following parameters of the disk: inclination , inner and outer radii and , power law emissivity with index , local turbulent broadening and normalized angular momentum of black hole . The corresponding results are presented in Fig. 2. As it can be seen from this figure, when the bright spot moves along the positive direction of -axis (receding side of the disk) it affects only ”red” wing of the line (Fig. 2, top right), but when it moves along the negative direction of -axis (approaching side of the disk) it affects only ”blue” wing of the line (Fig. 2, top left). In both cases, the other wing and the line core stay nearly constant, and therefore almost unaffected by bright spot. The situation is quite opposite when the bright spot moves in both directions along the -axis, because then it affects only the line core, while the both of its wings stay almost intact (see the bottom panels of Fig. 2).
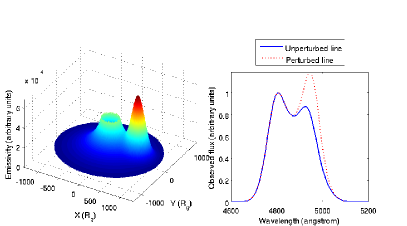
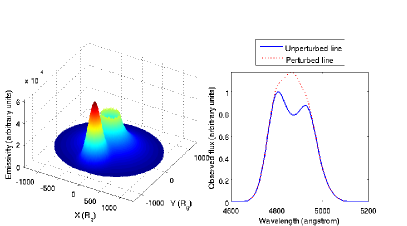


We also performed the corresponding simulations for different positions of a bright spot which moves from the inner radius of the accretion disk towards its outer parts along the direction, and found similar behavior of the simulated line profiles (see Fig. 3). As one can see from Fig. 3, for certain positions of perturbing region along direction we obtained the line profile with almost symmetrical wings, while in other cases either the ”blue” peak is brighter than the ”red” one, or the ”red” peak is stronger than the ”blue” one.
The next step in our analysis was to use our numerical simulations for fitting the observed spectra of 3C 390.3 in order to study the variability of its H spectral line due to emissivity perturbations in its accretion disk.
3.2 Observations of 3C 390.3
To test the model, we used 22 spectra of 3C 390.3 observed from November 1995 until June 1999 (see Fig. 8 in Shapovalova et al., 2001).
Spectra of 3C 390.3 were taken with the 6 m and 1 m telescopes of the SAO RAS (Russia, 1995–2001) and at INAOE’s 2.1 m telescope of the “Guillermo Haro Observatory” (GHO) at Cananea, Sonora, México (1998–1999) in monitoring regime in 1995-1999. They were obtained with long slit spectrographs, equipped with CCD detector arrays. The typical wavelength interval covered was that from 4000 Å to 7500 Å, the spectral resolution varied between 5 and 15 Å and the S/N ratio was 50 in the continuum near H and H. Spectrophotometric standard stars were observed every night. The spectrophotometric data reduction was carried out either with software developed at SAO RAS or with the IRAF package for the spectra obtained in México. The image reduction process included bias, flat-field corrections, cosmic ray removal, 2D wavelength linearization, sky spectrum subtraction, addition of the spectra for every night, and relative flux calibration based on standard star observations. Spectra were scaled by the [O III] 4959+5007 integrated line flux under the assumption that the latter did not change during the time interval covered by our observations (1995–2001). A value of 1.710-13 ergs s-1cm-2 (Veilleux & Zheng, 1991) for the integrated [O III] line flux was adopted. In order to calculate a normalization coefficient, the continuum was determined in two 30 Å wide clean –line free– windows centered at 4800 Å and 5420 Å. After continuum subtraction, blend separation of the H and [O III] components was carried out by means of a Gaussian fitting procedure, applied to the following: H — broad blue, broad red and central narrow; [O III] 4959,5007 — broad and narrow components. The forbidden lines are represented by two Gaussian curves with an intensity ratio I(5007)/I(4959)=2.96.
Comparisons between mean and rms spectra of the H and H broad line profiles of 3C 390.3 during 1995-2007 (including the H spectra from this paper) are given in Fig. 12 of Shapovalova et al. (2010). It can be seen that these profiles are similar, and moreover, the corresponding H profiles of 3C 390.3 from Shapovalova et al. (2010) and Gezari et al. (2007) are also similar. These comparisons indicate that the [O III] 4959,5007 narrow lines subtraction in H region was performed correctly.
The flux of H and the broad component profile was obtained from scaled spectra after continuum subtraction and removal of the [O III] doublet and narrow H component. Then the observed continuum fluxes were corrected for the aperture effects using scheme by Peterson et al. (1995). The mean error (uncertainty) in our flux determinations for the continuum and H flux is 3%. More details can be found in paper Shapovalova et al. (2001).
3.3 Perturbation in the accretion disk of 3C 390.3
Radial velocities of the blue and red peaks of the H and H broad lines of 3C 390.3 vary with time (see e.g. Gaskell, 1996; Eracleous et al., 1997; Shapovalova et al., 2010). Shapovalova et al. (2001) obtained the H difference profiles by subtracting the average spectrum corresponding to the minimum activity state (September 9, 1997) from the individual spectra (see their Fig. 11). These authors found (see their Table 7) that the radial velocity of the blue peak increased from -3200 km s-1 in 1995-1996 to -5200 km s-1 in 1999. At the same time the radial velocity of the red peak increased from +4900 km s-1 in 1995-1996 to +7000 km s-1 in 1999. Here we analyze the possibility that the velocities, corresponding to the peak shifts in the H integral and difference profiles, vary with time due to perturbations in disk emissivity.
In order to fit the spectral H line shapes of 3C 390.3, we first estimated the disk parameters from several profiles. We found following parameters of the disk: inclination , inner and outer radii and , broken power law emissivity with index for and for , radius at which slope of emissivity changes , emissivity of perturbing region , local turbulent broadening and normalized angular momentum of black hole . These values of parameters are in accordance with the corresponding parameters for 3C 390.3 obtained by Flohic & Eracleous (2008), who found the following values: , , and . In all our simulations we held emissivity of perturbing region fixed at , but nevertheless, the brightness of perturbing region varies with time due to its changeable area (i.e. its widths are taken as free parameters which vary with time), as well as due to power law emissivity of the disk which decreases with radius. We studied stationary and moving perturbing regions, and in the latter case their coordinates are also assumed as free parameters.
The fitting of the observed H line shapes of 3C 390.3 is performed separately in the case of moving and stationary perturbing regions in the following three steps: (i) the simulated H line profiles are calculated for some initial set of values of free parameters; (ii) the corresponding root mean square (RMS) of residuals between the observed and simulated line profiles is calculated; (iii) the values of free parameters are varied and the procedure (i)-(iii) is repeated until the RMS deviations (RMSD) between the observed and fitted H profiles become as small as possible.

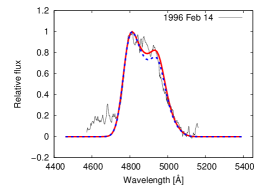
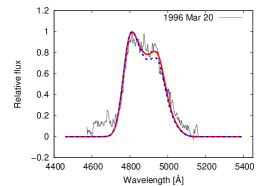


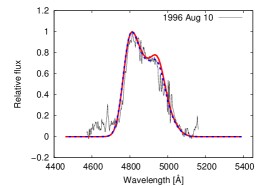
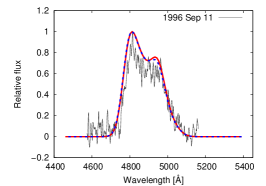
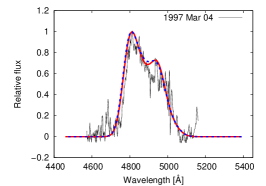
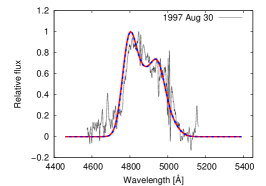
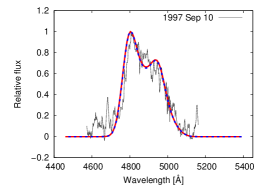
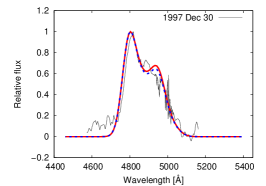
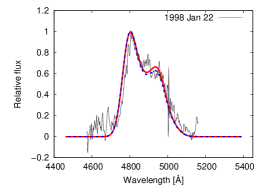
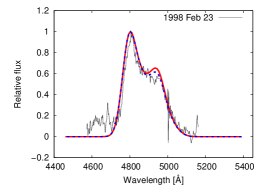
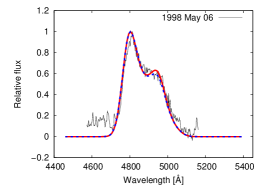
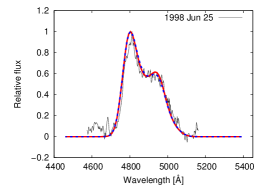
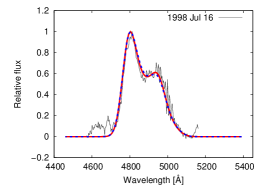
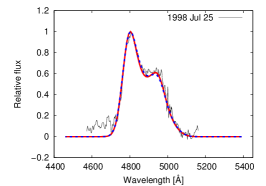


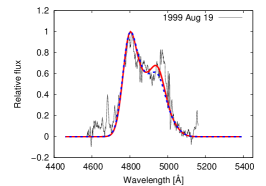
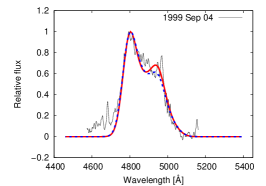
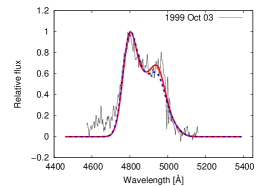
Fig. 4. shows comparisons between all 22 observed spectra (black solid line) and the obtained best fits assuming the moving (red solid line) and stationary (blue dashed line) perturbing regions, while the corresponding positions of the perturbing regions are presented in Fig. 5. As it can be seen from Fig. 5, the obtained positions of the moving perturbing regions are distributed in the form of two spiral arms, indicating that these perturbations originate in the inner regions of the disk and spiral away towards its outer parts, moving faster in the azimuthal direction as they get further away from the center of the disk.
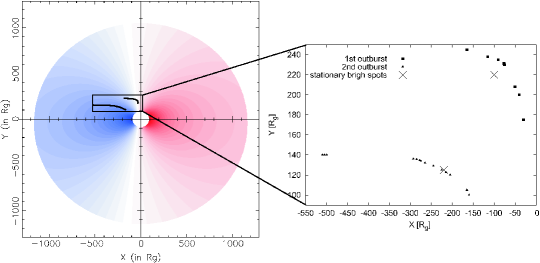
Table 1. contains the obtained values of the fitted parameters, as well as the corresponding RMSD in the case of both, moving and stationary perturbing regions. We first studied the moving perturbations, but after examining the obtained results we found that, during a period of a few years, such perturbations move only by small distances which are comparable to their widths (see Table 1). Therefore, in order to test whether the obtained displacements are reliable, we repeated the fitting, but this time assuming the stationary perturbing regions with variable widths. In this case we obtained the best fits for two perturbations positioned at , and at , , respectively (denoted by crosses in Fig. 5). As one can see from Fig. 4. and Table 1, regardless the significant variations of the H line profile during the analyzed period, both models of perturbing region resulted in similar fits for the most of these spectra, except for the spectra observed during 1999, where the moving perturbing region achieved better fits. The latter result should be taken with caution because the observations from 1999 were performed after a large gap of 1 year. Therefore, the displacements of the perturbing regions cannot be considered as indisputably confirmed, but on the contrary, their widths almost certainly vary with time. The last conclusion is valid for both, moving and stationary perturbing regions, since neither of them can provide satisfactory fits with fixed widths.
The obtained best fit positions of both, moving and stationary perturbations are located on the approaching side of the accretion disk (see Fig. 5) and these perturbations can be most likely attributed to successive occurrences of two different bright spots. This assumption is in good agreement with observations, since two large amplitude outbursts of H line are observed during the analyzed period (Shapovalova et al., 2001), and therefore each bright spot can be assigned to one of them: the bright spot which positions are denoted by squares corresponds to October 1994 - July 1997 outburst while the other one, which positions are denoted by triangles, corresponds to July 1997 - June 1999 outburst. Using the time differences between two successive observed spectra we were able to estimate the speeds of both moving bright spots (see Table 1). For an average velocity of the first bright spot we obtained the value of 7298 and for the second one 6575 . As it can be seen from Table 1, widths of bright spots are increasing with time, indicating that they decay until they completely disappear. It should be noted that, inevitably, there is a certain degree of degeneracy in the parameter space, since similar results could be obtained with somewhat different combinations of perturbing region positions and widths.
| Date | JD (2400000+) | RMSD | |||||||
|---|---|---|---|---|---|---|---|---|---|
| (1) | (2) | (3) | (4) | (5) | (6) | (7) | (8) | (9) | (10) |
| The First Outburst | |||||||||
| 1995 Nov 17 | 50039.156 | -30 | 175 | 100 | 100 | 0.09730 | 0.09460 | ||
| 1996 Feb 14 | 50127.602 | -40 | 200 | 105 | 130 | 26.93 | 5203.24 | 0.09680 | 0.09900 |
| 1996 Mar 20 | 50162.580 | -50 | 208 | 106.5 | 140 | 12.81 | 6257.63 | 0.08476 | 0.09138 |
| 1996 Jul 12 | 50276.567 | -75 | 230 | 110 | 180 | 33.3 | 4993.36 | 0.08518 | 0.08178 |
| 1996 Jul 17 | 50281.434 | -76.3 | 231.3 | 110 | 180 | 1.84 | 6456.24 | 0.08820 | 0.08249 |
| 1996 Aug 10 | 50305.489 | -90 | 235 | 112 | 190 | 14.19 | 10082.9 | 0.09435 | 0.09201 |
| 1996 Sep 11 | 50338.309 | -115 | 238 | 120.5 | 200 | 25.18 | 13112.6 | 0.12337 | 0.12426 |
| 1997 Mar 04 | 50511.622 | -165 | 245 | 130 | 260 | 50.49 | 4978.94 | 0.11448 | 0.12082 |
| The Second Outburst | |||||||||
| 1997 Aug 30 | 50691.463 | -160 | 100 | 100 | 100 | 0.13717 | 0.13593 | ||
| 1997 Sep 10 | 50701.576 | -165 | 105 | 105 | 110 | 7.07 | 11950.55 | 0.12034 | 0.11905 |
| 1997 Dec 30 | 50813.195 | -205 | 120 | 145 | 175 | 42.72 | 6541.48 | 0.09499 | 0.09398 |
| 1998 Jan 22 | 50835.631 | -215 | 122.5 | 155 | 195 | 10.31 | 7852.39 | 0.10690 | 0.10949 |
| 1998 Feb 23 | 50867.560 | -225 | 125 | 165 | 215 | 10.31 | 5517.75 | 0.09825 | 0.09618 |
| 1998 May 06 | 50940.354 | -245 | 129 | 185 | 265 | 20.40 | 4788.88 | 0.08867 | 0.08965 |
| 1998 Jun 25 | 50990.302 | -265 | 132 | 205 | 285 | 20.22 | 6920.32 | 0.07229 | 0.07387 |
| 1998 Jul 16 | 51010.719 | -275 | 134 | 210 | 295 | 10.20 | 8537.04 | 0.06809 | 0.07141 |
| 1998 Jul 25 | 51019.723 | -278 | 134.5 | 212 | 300 | 3.04 | 5773.22 | 0.06548 | 0.06615 |
| 1998 Aug 30 | 51055.551 | -285 | 135.5 | 215 | 320 | 7.07 | 3373.22 | 0.07590 | 0.07638 |
| 1998 Sep 26 | 51082.429 | -293 | 136 | 218 | 340 | 8.01 | 5097.09 | 0.07948 | 0.07788 |
| 1999 Aug 19 | 51410.309 | -500 | 140 | 250 | 400 | 207.04 | 10792.43 | 0.10645 | 0.11163 |
| 1999 Sep 04 | 51426.208 | -505 | 140 | 252 | 400 | 5 | 5375.06 | 0.09147 | 0.09232 |
| 1999 Oct 03 | 51455.172 | -510 | 140 | 254 | 400 | 5 | 2950.49 | 0.09977 | 0.10270 |
Note. — Col. (1): date of observation; Col. (2): epoch of observation (in JD); Cols. (3-4): and coordinates of the moving bright spots; Col. (5): widths () of the moving bright spots; Col. (6): widths () of the stationary bright spots, positioned at , during the first outburst and at , during the second outburst; Col. (7): linear distance crossed by the moving bright spots between two successive observations; Col. (8): average speed of the moving bright spots between two successive observations; Col. (9): root mean square deviation between the observed and fitted H line profiles in the case of the moving bright spots; Col. (10): the same as Col. (9), but in the case of the stationary bright spots.
4 Discussion
Several physical mechanisms could be responsible for perturbations in accretion disk emissivity, i.e. for bright spot formations. The most plausible candidates for such mechanisms are: disk self-gravity, baroclinic vorticity, disk-star collisions (Flohic & Eracleous, 2008, and references therein), tidal disruptions of stars by central black hole (Strubbe & Quataert, 2009, and references therein) and fragmented spiral arms (Lewis et al., 2010, and references therein).
The disk self-gravity, driven by Jeans instability, could cause production of clumps in the disk which have typical sizes in the range from 10 to 1000 gravitational radii for a central black hole. Such clumps do not shear with differential rotation and they have high brightness that varies very little over time. Since the obtained results indicate that bright spots decay by time and spiral along the disk, it is not likely that these bright spots could be identified as clumps created by self-gravity, although their sizes are comparable.
Baroclinic vorticity appears in the accretion disk due to its differential rotation in combination with the radial temperature gradient, causing the material in the disk to spiral around the center of vortex. Such a vortex would have higher density, and hence higher brightness, causing the formation of a bright spot. The typical sizes of such spots, as well as their shearing with differential rotation of the disk, are still unknown since different numerical simulations gave contradictory results (for more details see e.g. Flohic & Eracleous, 2008, and references therein). Therefore, in the case of 3C 390.3, this mechanism still cannot be neither ruled out, nor accepted.
Disk-star collisions are assumed to be very frequent events which happen on daily timescales and which could increase disk surface temperature in the region of collision, and thus, create a bright spot. Such bright spots shear with differential rotation of the disk and decay as the material cools down. However, the typical size of a such bright spot immediately after collision is close to the size of the star, which is very small when expressed in gravitational radii. Therefore, neither this mechanism could be accepted as a potential cause of two bright spots, detected in the case of quasar 3C 390.3.
The tidal disruption of stars by central black hole (Strubbe & Quataert, 2009, and references therein) happens when a star passes the tidal radius of the black hole, i.e. when the black hole’s tidal gravity exceeds the star’s self-gravity. Gas of a disrupted star falls back to the black hole at a super-Eddington rate, releasing a flare of energy which then blows away a significant fraction of the falling gas as an outflow. Such super-Eddington flares and outflows could induce instabilities in accretion disk in form of bright spots. However, this mechanism is an unlikely candidate for a potential cause of the bright spots in the case of 3C 390.3 due to the following weaknesses: (i) super-Eddington outflows are short living ( days); (ii) frequency of star disruptions in a typical elliptical galaxy is very low, between and per year, and in the case of the black hole of 3C 390.3 which mass is (Lewis & Eracleous, 2006), it is near the low end of this range (see e.g. Wang & Merritt, 2004; Magorrian & Tremaine, 1999); (iii) any stellar debris could be hardly released in the case of 3C 390.3 since the main sequence stars are disrupted within the innermost stable orbit around a non-rotating black hole as massive as that in 3C 390.3; (iv) it is unclear how the bright spots produced by this mechanism should evolve with time.
Spiral arms in AGN disks could be formed spontaneously due to self-gravity instabilities (see e.g. Flohic & Eracleous, 2008, and references therein) or could be triggered by close passage of some massive object such as another supermassive black hole or a star cluster (see e.g. Lewis et al., 2010, and references therein). Spiral arms increase flux variability of AGN on timescales of a year to several years, but as noted before, they are unable to reproduce all aspects of the observed variability. However, they are also subjected to fragmentation, causing small variations in the flux on timescales of several months. The fragments in spiral arms can be due to sub-structures in a non-uniform accretion disk, such as isolated clumps which could pass through the arm and dominate in its emissivity, causing the discrete ”lumps” of excess emission (Lewis et al., 2010). The observed variability on timescales from few months to several years in the difference spectra of some AGN is probably caused by such lumps. It is quite possible that some of these lumps are long-living and that they do not vary significantly in strength, shape, or position over a period of several years (Lewis et al., 2010). As the obtained results show, it is the same case with the large bright spots which are responsible for amplitude outbursts of the 3C 390.3 H line, because they have constant emissivity and they are either stationary or spiralling over small distances during the period of several years. The only feature which significantly varies with time is their width. Therefore, these bright spots could be most likely explained by the emissivity lumps, caused by fragments in spiral arms of the accretion disk.
5 Conclusions
We developed a model of the disk perturbing region in the form of a single bright spot (or flare) by a modification of the power law disk emissivity and used this model to simulate the disk line profiles. This model has been used to fit the observed H line of 3C 390.3 observed from 1995 to 1999. From this investigation we can point out the following results:
-
1.
The model which includes perturbation (bright spot) in the accretion disk can successfully explain difference in double peaked line profiles, as e.g. higher red peak even if we have the standard circular disk. The position of a bright spot has a stronger influence on one particular part of spectral line profiles (such as e.g. its core if the spot is in the central part of the disk, or ”red” and ”blue” wings if the spot is located on receding and approaching part, respectively).
-
2.
Using the model for perturbing region we were able to successfully model and reproduce the observed variations of the H line profile in the case of 3C 390.3, including the two large amplitude outbursts observed during the analyzed period. Therefore, the observed variations of the 3C 390.3 H line could be caused by perturbations in the disk emissivity.
-
3.
We found that two outbursts referred by Shapovalova et al. (2001) could be explained by successive occurrences of two different bright spots on approaching side of the disk which are either moving, originating in the inner regions of the disk and spiralling outwards, or stationary. Both bright spots decay by time until they completely disappear.
-
4.
Our results support hypothesis that the perturbations in accretion disk emissivity are probably caused by fragments in the spiral arms of the disk.
The results presented above show that a circular disk with perturbations (bright spots) can be applied to explain different double peaked line profiles, and can be also used to trace perturbations (as well as their characteristics) from the broad double peaked line shapes.
References
- Baptista & Catalán (2000) Baptista, R. & Catalán, M. S. 2000, New A Rev., 44, 1P
- Chen et al. (1989) Chen, K., Halpern, J. P. & Filippenko, A. V. 1989, ApJ, 339, 742
- Chen & Halpern (1990) Chen, K. & Halpern, J. P. 1990, ApJ, 354, L1
- Collin-Souffrin (1987) Collin-Souffrin, S. 1987, A&A, 179, 60
- Collin-Souffrin & Dumont (1990) Collin-Souffrin, S., & Dumont, A. M. 1990, A&A, 229, 292
- Dovčiak et al. (2008) Dovčiak, M., Karas, V., Matt, G., Goosmann, R. W. 2008, MNRAS, 384, 361
- Dumont & Collin-Souffrin (1990a) Dumont, A. M., & Collin-Souffrin, S. 1990, A&A, 229, 302
- Dumont & Collin-Souffrin (1990b) Dumont, A. M., & Collin-Souffrin, S. 1990, A&A, 229, 313
- Dumont & Collin-Souffrin (1990c) Dumont, A. M., & Collin-Souffrin, S. 1990, A&AS, 83, 71
- Eracleous & Halpern (1994) Eracleous, M. & Halpern, J. P. 1994, ApJS, 90, 1
- Eracleous et al. (1995) Eracleous, M., Livio, M., Halpern, J. P. & Storchi-Bergmann, T. 1995, ApJ, 438, 610
- Eracleous et al. (1997) Eracleous, M., Halpern, J. P., Gilbert, A. M., Newman, J. A., & Filippenko, A. V. 1997, ApJ, 490, 216
- Eracleous & Halpern (2003) Eracleous, M. & Halpern, J. P. 2003, ApJ, 599, 886
- Eracleous et al. (2009) Eracleous, M., Lewis, K. T. & Flohic, H. M. L. G. 2009, New Astronomy Review, 53, 133
- Flohic & Eracleous (2008) Flohic, H. M. L. G., Eracleous, M. 2008, ApJ, 686, 138
- Gaskell (1996) Gaskell, C. M. 1996, ApJ, 464, L107
- Gezari et al. (2007) Gezari, S., Halpern, J. P., Eracleous, M. 2007, ApJS, 169, 167
- Gilbert et al. (1999) Gilbert, A. M., Eracleous, M., Filippenko, A. V. & Halpern, J. P. 1999, in ASP Conf. Ser. 175: Structure and Kinematics of Quasar Broad Line Regions, ed. Gaskell, C. M., Brandt, W. N., Dietrich, M., Dultzin-Hacyan, D. & Eracleous, M. (San Francisco: ASP), 189
- Jovanović & Popović (2009a) Jovanović, P., Popović, L. Č. 2009a, arXiv:0903.0978v1 [astro-ph.GA] (to appear as a chapter in the book ”Black Holes and Galaxy Formation” by Nova Science Publishers, Inc.
- Jovanović & Popović (2009b) Jovanović, P., Popović, L. Č. 2009b, PASRB, 9, 45
- Jovanović & Popović (2008a) Jovanović, P., Popović, L. Č. 2008, Fortschritte der Physik, 56, 456
- Jovanović & Popović (2008b) Jovanović, P., Popović, L. Č. 2008, POBeo, 84, 467
- Lewis (2005) Lewis, K. T. 2005, Bulletin of the American Astronomical Society, 37, 1240
- Lewis & Eracleous (2006) Lewis, K. T., & Eracleous, M. 2006, ApJ, 642, 711
- Lewis et al. (2010) Lewis, K. T., Eracleous, M., & Storchi-Bergmann, T. 2010, ApJS, 187, 416
- Magorrian & Tremaine (1999) Magorrian, J., & Tremaine, S. 1999, MNRAS, 309, 447
- Maloney et al. (1996) Maloney, P. R., Begelman, M. C. & Pringle, J. E. 1996, ApJ, 472, 582
- Marziani et al. (1993) Marziani, P., Sulentic, J. W., Calvani, M., Perez, E., Moles, M. & Penston, M. V. 1993, ApJ, 410, 56
- Newman et al. (1997) Newman, J. A., Eracleous, M., Filippenko, A. V. & Halpern, J. P. 1997, ApJ, 485, 570
- Peterson et al. (1995) Peterson, B. M., Pogge, R. W., Wanders, I., Smith, S. M., Romanishin, W. 1995, PASP, 107, 579
- Popović et al. (2003) Popović, L. Č., Mediavilla, E. G., Jovanović, P., Muñoz, J. A. 2003, A&A, 398, 975
- Romano et al. (1998) Romano, P., Marzianii, P. & Dultzin-Hacyan, D. 1998, ApJ, 495, 222
- Sergeev et al. (2000) Sergeev, S. G., Pronik, V. I. & Sergeeva, E. A. 2000, A&A, 356, 41
- Shapovalova et al. (2001) Shapovalova, A. I. et al. 2001, A&A, 376, 775
- Shapovalova et al. (2009) Shapovalova, A. I. et al. 2009, New Astronomy Review, 53, 191
- Shapovalova et al. (2010) Shapovalova, A. I., et al. 2010, arXiv:1003.2098.
- Sim et al. (2010) Sim, S. A., Miller, L., Long, K. S., Turner, T. J., Reeves, J. N. 2010, arXiv:1002.0544v1 [astro-ph.HE]
- Stalevski et al. (2008) Stalevski, M., Jovanović, P., Popović, L. Č. 2008, POBeo, 84, 491
- Steeghs et al. (1997) Steeghs, D., Harlaftis, E. T. & Horne, K. 1997, MNRAS, 290, L2
- Strateva et al. (2003) Strateva, I. V. et al. 2003, AJ, 126, 1720
- Strateva et al. (2008) Strateva, I. V. Brandt, W. N., Eracleous, M., Garmire, G. 2008, ApJ, 687, 869S
- Storchi-Bergmann et al. (2003) Storchi-Bergmann, T. et al. 2003, ApJ, 598, 956
- Strubbe & Quataert (2009) Strubbe, L. E., Quataert, E. 2009, MNRAS, 400, 2070
- Turner et al. (2006) Turner, T. J., Miller, L., George, I. M., Reeves, J. N. 2006, A&A, 445, 59
- Veilleux & Zheng (1991) Veilleux, S. & Zheng, W. 1991, ApJ, 377, 89
- Wang & Merritt (2004) Wang, J., & Merritt, D. 2004, ApJ, 600, 149
- Wu et al. (2008) Wu, S.-M., Wang, T.-G., & Dong, X.-B. 2008, MNRAS, 389, 213
- Zheng et al. (1991) Zheng, W., Veilleux, S. & Grandi, S. A. 1991, ApJ, 381, 41