Cold molecular gas in massive, star-forming disk galaxies at
Abstract
We report the detection of the CO emission line in three near-infrared selected star-forming galaxies at with the Very Large Array (VLA) and the Green Bank telescope (GBT). These observations directly trace the bulk of molecular gas in these galaxies. We find H2 gas masses of , and for BzK-4171, BzK-21000 and BzK-16000, respectively, assuming a conversion (K km s-1 pc2)-1. We combined our observations with previous CO detections of these galaxies to study the properties of their molecular gas. We find brightness temperature ratios between the CO and CO emission lines of , and for BzK-4171, BzK-21000 and BzK-16000, respectively. At the depth of our observations it is not possible to discern between thermodynamic equilibrium or sub-thermal excitation of the molecular gas at . However, the low temperature ratio found for BzK-16000 suggests sub-thermal excitation of CO already at . For BzK-21000, a Large Velocity Gradient model of its CO emission confirms previous results of the low-excitation of the molecular gas at . From a stacked map of the CO images, we measure a CO to CO brightness temperature ratio of . This suggests that, on average, the gas in these galaxies is thermalized up to , has star-formation efficiencies of (K km s-1 pc2)-1 and gas consumption timescales of Gyr, unlike SMGs and QSOs at high redshifts.
Subject headings:
galaxies: evolution — galaxies: formation — cosmology: observations — galaxies: starburst — galaxies: high-redshift1. Introduction
| Source | R.A.a | Dec.a | Frequencyb | Bandwidth | Beam | Pos. Ang. | Cov. Fractionc | Rmsd |
|---|---|---|---|---|---|---|---|---|
| (J2000) | (J2000) | (GHz) | (MHz) | (%) | (Jy/beam) | |||
| BzK-4171 | 12 36 26.516 | 62 08 35.35 | 46.760 | 100 | 96 | 44 | ||
| 43.340 | 100 | 62 | ||||||
| BzK-21000 | 12 37 20.597 | 62 22 34.60 | 45.710 | 100 | 98 | 42 | ||
| 43.340 | 100 | 72 | ||||||
| BzK-16000 | 12 36 30.120 | 62 14 28.00 | 45.653 | 76 | 145 | |||
| 45.635e | 100 | 181 |
a VLA 1.4 GHz position from Morrison et al. (2010). b Central frequency between the two 50 MHz IFs. c Fraction of the CO line covered by the VLA observations. d Image noise level measured around the source position. e Combined continuum emission from two 50 MHz bandwidth channels at 45.585 GHz and 45.685 GHz.
A remarkable step in our understanding of galaxy formation has come from the determination of the unobscured history of the star formation rate (SFR) density over a wide range of redshift. The SFR history of the Universe has a peak from to 1, and presents a steady decline at (e.g. Lilly et al. 1996; Madau et al. 1996; Steidel et al. 1999). Apparently, a significant contribution to this peak is provided by the vigorous bursts of star formation triggered by galaxy mergers and interactions. In these cases, the star formation is very efficient, showing high SFRs and high gas surface densities on scales of several kpc, similar to what is observed in distant submillimeter galaxies (SMGs; Tacconi et al. 2006, 2008) and quasars (QSOs; Walter et al. 2004, 2009; Riechers et al. 2008, 2009). However, an important fraction of the SFR density appears to come from normal star-forming disk galaxies (Bell et al. 2005; Elbaz et al. 2007; Genzel et al. 2008). Here, continuous flows of cold gas from the intergalactic medium may provide the necessary fuel for star formation (Kereš et al. 2005; Dekel et al. 2009).
Studies of the properties of the molecular gas (e.g., CO) in galaxies during the main epoch of galaxy formation () have mostly focused on SMGs and QSOs due to the limited capabilities of millimeter and radio telescopes and instruments (e.g., Solomon & Vanden Bout 2005; Weiß et al. 2005; Riechers et al. 2006; Carilli et al. 2007; Weiß et al. 2007; Aravena et al. 2008; Coppin et al. 2008; Carilli et al. 2010). These IR-luminous objects were found to have large reservoirs of molecular gas () that sustain SFRs of yr-1 for Myr. Similar to what is observed in local ultra-luminous infrared galaxies (ULIRGs), the molecular gas is in local thermodynamic equilibrium (LTE) up to high- CO transitions (; Riechers et al. 2006; Weiß et al. 2007). This is expected for warm, dense H2 molecular gas.
Recently, large amounts of molecular gas, similar to those observed in bright high-redshift SMGs and QSOs, were found in six relatively quiescent disk galaxies at (Daddi et al. 2008, 2010a), 14 similar galaxies at and (Tacconi et al. 2010) and three disk galaxies at (Daddi et al. 2010b, ; Salmi et al. in preparation). A detailed analysis of the properties of these near-IR selected galaxies revealed SFRs yr-1, with stellar masses of . These galaxies apparently have high molecular gas fractions, low star-formation efficiencies (SFEs) (Daddi et al. 2008, 2010a; Tacconi et al. 2010) and CO luminosity to gas mass conversion factors similar to that found in the Milky Way galaxy disk rather than that of starbursting ULIRGs and SMGs (Daddi et al. 2010a). This means that these objects have yet to convert a large fraction of their gas into stars, indicating galaxies right in the process of stellar build-up. The first CO measurements in two BzK galaxies were previously reported by Dannerbauer et al. (2009), but only led to a stacked detection at . Those observations, combined with the first detection of the CO line in one of these galaxies (BzK-21000), allowed Dannerbauer et al. (2009) to perform an analysis of the excitation properties of the molecular gas, finding low excitation conditions, similar to what is seen in local disk galaxies. This suggests an important difference to what is found in more luminous objects at high-redshift, where the CO emission is in LTE up to high CO transitions.
In this paper, we report individual detections of the CO emission line in a sample of three near-IR selected star-forming galaxies at that have previously been studied in detail by Daddi et al. (2010a): BzK-4171, BzK-21000 and BzK-16000. In section 2 we describe our CO observations. In section 3, we present our results, give fluxes and luminosities. In section 4, we summarize our results and discuss the average properties of the molecular gas in our galaxies. We assume a concordance cosmology with km s-1 Mpc-1, and .
2. Observations
| Source | SFEg | ||||||
|---|---|---|---|---|---|---|---|
| (Jy) | (Jy) | (Jy km s-1) | ( K km s-1 pc2) | () | ( yr) | ( (K km s-1 pc2)-1) | |
| BzK-4171 | 0.80 | 43 | |||||
| BzK-21000 | 0.25 | 142 | |||||
| BzK-16000 | 0.81 | 44 |
a Upper limit (2) to the continuum emission at 43.34 GHz for BzK-4171 and BzK-21000 and at 45.6 GHz for BzK-16000. b Flux density integrated over an area that matches the CO measurements. c Velocity integrated intensity, , corrected for emission that falls outside the range covered by the VLA band. d CO luminosity. e H2 mass computed using a CO luminosity to gas mass conversion factor of 3.6 (K km s-1 pc2)-1 (Daddi et al. 2010a). f Gas depletion lifetimes and g star formation efficiencies derived using the SFR and the far-IR luminosities from Daddi et al. (2010a), and our CO measurements.
2.1. Very Large Array
We used the Very Large Array (VLA) in its C and D-array configuration and the Q-band receivers to observe the redshifted CO emission line ( GHz) in three BzK galaxies at in the GOODS North field. This configuration provides good spatial resolution (typical beams of ), with a primary beam of .
For two of our sources, BzK-4171 and BzK-21000, the observations were done in D-configuration between 2009 November 02 and 2009 November 27 under very good weather conditions. A total of 35 hrs were spent observing each source, over 5 tracks per source. Since the observations were done during a transition period to the Expanded VLA (EVLA), many antennae were malfunctioning and we were only able to reach less than half the sensitivity expected for the whole array (Table 1).
We used two channels of 50 MHz bandwidth each and two polarizations per channel. At GHz, 50 MHz correspond to km s-1 velocity coverage. For BzK-4171, the two channels were centered at 46.735 and 46.785 GHz. For BzK-21000, the two channels were centered at 45.685 GHz and 45.735 GHz. A fraction of the time of each track was spent observing these sources at 43 GHz using two non-overlapping channels of 50 MHz bandwidth (i.e. 100 MHz bandwidth in total) in order to obtain a limit for the continuum emission. In both cases the phase tracking center was pointed about 10″ south from the target positions.
The observations of BzK-16000 were done in C- and D-configuration between 2009 July and 2009 December under mostly good weather conditions. A total of 48 hours were used to observe this source. Spectral line observations were performed using two IFs of 7 channels each and two polarizations. Both IFs have one channel overlap, leading to a total of 13 independent spectral channels. These channels were combined into one single channel of 40.625 MHz bandwidth and centered at 45.653 GHz, covering most of the expected CO emission line. We also performed continuum observations of this source by placing two 50 MHz channels at each side of the expected CO line. These channels were centered at 45.585 GHz and 45.685 GHz, respectively. The higher frequency channel overlaps the central 40.625 MHz bandwidth region by 18 MHz.
In all cases, we used fast-switching calibration and observed the VLA calibrators J13025748 and 3C286 (J1331305) for flux calibration. The AIPS software was used for data editing and calibration. Most of the data showed good phase stability; however, some time ranges were removed due to antennae with bad amplitudes. Finally, we used the AIPS task IMAGR, which employs the CLEAN algorithm, and natural weighting to deconvolve the images down to residuals of in a box centered on our targets. Table 1 summarizes the relevant observational parameters.
2.2. Green Bank Telescope
We also performed observations of two of our BzK galaxies with the Robert C. Byrd Green Bank telescope (GBT) during 2009 April and 2009 October to November, under very good weather conditions. Typical computed opacities at 45 GHz are and measured wind velocities were m s-1. At these frequencies the GBT beam is . We observed in sub-reflector nodding mode, with a half-cycle time of 6 s. At the beginning of each run, we observed the following flux density calibrators for 10 min each: 3C286, 3C147 or 3C295. We estimate our measured fluxes densities to be accurate within . We used the source 1259514 as the pointing and focus calibrator. Pointing and focus were checked every 30 min to 1 h depending on the stability and accuracy of the obtained corrections in each run. Pointing was stable within in all runs. Typical system temperatures at 45.7 GHz and 46.7 GHz were in the range 85-110 K. We employed two IFs of 800 MHz bandwidth each and two polarizations each, with a spectral resolution of 390.625 kHz per channel, or 2.6 km s-1 per channel. We placed the center of both IFs 200 MHz from each other and about 100 MHz from the line frequency each. In this way, the overlap region covered a band of 600 MHz.
The data were reduced using the GBTIDL software, removing a few scans that presented bad channels or strongly distorted baselines. For each source, we averaged all scans and both IFs. The combination of both IFs produce a gain of about in the obtained signal-to-noise ratio due to digitization noise. We fitted polynomials of order 3 and subtracted them from the averaged spectra. This eliminates baseline structure on scales times larger than the expected linewidth of the CO lines. Finally, we downgraded their spectral resolution to 61 and 63 km s-1 ( MHz) for BzK-21000 and BzK-4171, respectively.
3. Results
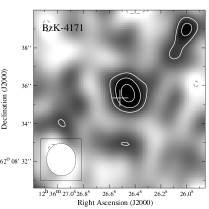
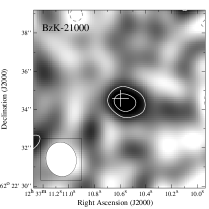
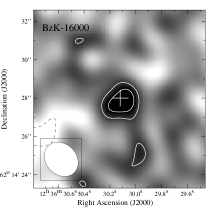
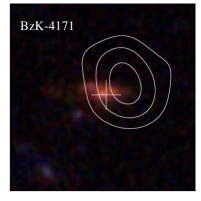
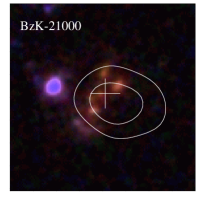
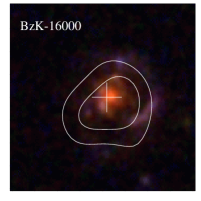
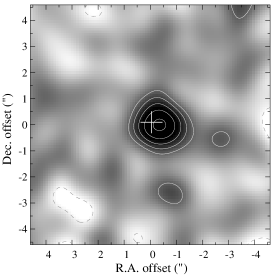
Figure 1 shows the VLA maps of CO line emission and Table 2 summarizes the results. Fitting two dimensional Gaussians to the CO images suggests marginally resolved sources, although the signal-to-noise is insufficient to provide accurate estimates of source sizes. In order to derive the total CO fluxes of the sources, we fit Gaussians that were constrained by the position and size of the sources derived from the CO observations at the Plateau de Bure Interferometer (PdBI) by Daddi et al. (2010a). Constraining the Gaussian fitting decreases the number of free parameters and permits a direct comparison of amplitudes, although it assumes that the CO and emission are spatially coincident.
We find that all sources are detected with significances in the range in the CO maps, with no evidence for emission in the 43 GHz continuum maps of BzK-4171 and BzK-21000 nor in the 45 GHz continuum maps of BzK-16000. We derive 2 limits of 125, 144 and 360 Jy for the continuum flux densities of BzK-4171, BzK-21000 and BzK-16000, respectively.
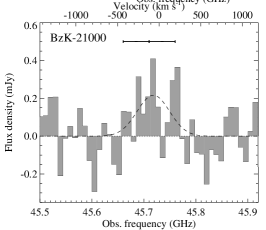
Figure 2 shows the GBT spectra. BzK-4171 and BzK-21000 are both marginally detected. Using a single Gaussian fit, we find peak flux densities of mJy and mJy, where the quoted errors account for a 10% uncertainty in the flux calibration, linewidths of km s-1 and km s-1, and CO redshifts of and for BzK-4171 and BzK-21000, respectively. Our GBT measurements are consistent with those obtained with the VLA in terms of flux densities, and with those obtained with the PdBI for the CO line in terms of linewidths and central frequencies. Given the lower S/N of the GBT observations, we refer to the VLA flux measurements in the remainder of this paper.
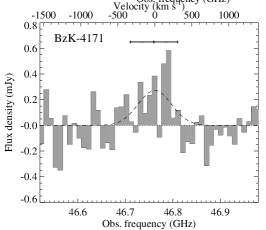
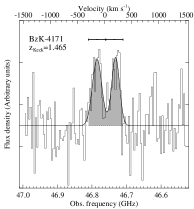
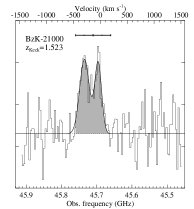
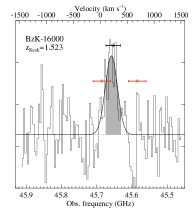
Figure 3 shows the PdBI CO spectra of our sources (Daddi et al. 2010a) scaled to the frequency of the CO transition. The horizontal bar and shaded region of the emission lines represent the velocity (and/or frequency) range covered by our VLA CO observations. The velocity ranges covered are 641 km s-1, 656 km s-1 and 266 km s-1 in BzK-4171, BzK-21000 and BzK-16000, respectively. This implies that we cover , and , respectively, of the CO line with our observations (Table 1). After correcting for the fraction of the line that falls outside our bands, we derive integrated line intensities, , of , and Jy km s-1 in BzK-4171, BzK-21000 and BzK-16000, respectively. We use the integrated line intensities to compute the CO line luminosities through , where is the luminosity distance at redshift and is the observed frequency (Solomon et al. 1997).
A comparison of the CO maps with optical and the radio positions (Fig. 4) shows a small offset of from the CO peak position in the case of BzK-4171. This is well within the range expected given the low significance of the detection. For the other sources, the CO emission is consistent () with the position of the radio and optical source.
3.1. Gas properties
Our observations of the CO line emission can be used to directly measure the amount of molecular gas and star formation efficiency in the BzK galaxies. The estimation of the molecular gas masses is typically done by using a CO luminosity to gas mass conversion factor, . Comparing observations with simulations of star-forming disk galaxies that reproduced the observed CO line shapes and UV morphologies of three BzK galaxies (two of which are in our sample), Daddi et al. (2010a) estimated (K km s-1 pc2)-1, close to the Galactic disk . Assuming this value of , we compute the H2 masses given in Table 2.
The star formation efficiency of galaxies is defined as the ratio between the IR luminosity and the CO luminosity, SFE. Using the values for the IR luminosity from Daddi et al. (2010a), we find SFE and 44 (K km s-1 pc2)-1 for BzK-4171, BzK-21000 and BzK-16000, respectively. We can also compute the time in which the gas would be consumed if the current SFR remains constant, SFR. Using the SFRs found by Daddi et al. (2010a), we find gas consumption lifetimes of Gyr (see Table 2). These values are comparable to those found by Daddi et al. (2010a) and are similar those found for comparable galaxies at redshifts (Tacconi et al. 2010).
3.2. Excitation of the molecular gas
In this section we study the properties of the molecular gas in our BzK galaxies. All of our sources have previously been detected in the CO emission line. However, only BzK-21000 has been detected in the CO line (Dannerbauer et al. 2009).
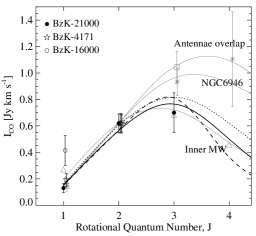
Figure 5 shows the velocity integrated CO line fluxes of BzK-21000 as a function of rotational quantum number, . Also shown are the CO and CO integrated line fluxes of BzK-4171 and BzK-16000, normalized to the CO intensity of BzK-21000 for comparison, and the normalized CO intensities for the inner disk of the Milky Way (Fixsen et al. 1999), the Antenna overlap region (Zhu et al. 2003) and the spiral galaxy NGC6946 (Bayet et al. 2006).
From the velocity integrated line fluxes, we compute the brightness temperature line ratios as , where and are the brightness temperatures, and are the integrated fluxes, and and are the observed frequencies of the CO and emission lines, respectively. For LTE, we expect this ratio to be . In our sources, we measure brightness temperature line ratios of , and for BzK-4171, BzK-21000 and BzK-16000, respectively.
At the significance of our detections, it is not possible to conclude whether the emission in the individual BzK galaxies is thermalized or not up to . In BzK-4171 and BzK-21000 the values of suggest thermal equilibrium, while in BzK-16000, the low value for suggests that the CO emission is sub-thermal at . However, this needs to be confirmed with deeper observations. For BzK-21000, the brightness temperature ratio between CO and CO is , compatible with the previous results of in this galaxy by Dannerbauer et al. (2009).
For BzK-21000, we compute a Large Velocity Gradient (LVG) model using our new CO measurement. We employ a single component LVG model that assumes spherical geometry. We use the collision rates from Flower (2001) with an ortho-para H2 ratio of 3 and a CO abundance per velocity gradient [CO]/()= pc (km s-1)-1 (e.g., Weiß et al. 2005, 2007). Values that resemble the CO emission are in the range K and cm-3. Since we do not have sufficient constraints to fit the data with a specific model, we thus discuss the three representative models presented by Dannerbauer et al. (2009), as shown in Fig. 5. These models have K, cm-3 and a cloud filling factor of 2% (Model 1); K, cm-3 and a similar cloud filling factor (Model 2); and K, cm-3 and a filling factor of 8% (Model 3). We see that all these models can reasonably reproduce the data for BzK-21000. This is expected as our CO flux measurement confirms the LVG-based prediction of Dannerbauer et al. (2009), Jy km s-1. Therefore, we verify that models with high and/or , as seen in ULIRGs or high-redshift QSOs, are unlikely for the gas in this galaxy, as suggested by Dannerbauer et al. (2009).
4. Summary and Discussion
We have detected the CO emission line in three massive star-forming galaxies at . Our observations allow us to carry out a direct comparison with studies of galaxies at low-redshift, and hence put unique constraints on the properties of the molecular gas in disk galaxies at high-redshift.
From our molecular gas excitation analysis for BzK-21000, we confirm the Dannerbauer et al. (2009) results that the gas in this galaxy has low excitation conditions at (Fig. 5). The CO ladder for this galaxy seems to be thermalized up to and it is sub-thermal at . The CO ladder is similar to that found for local disks, as in NGC6946 (Fig. 5; Mauersberger et al. 1999). However, at the significance of this detection, the CO ladder is also consistent with the Milky Way galaxy, for which the emission appears to be non-LTE already at .
A similar case is that of BzK-4171, where the relatively large uncertainty in the temperature ratio, , does not allow us to differentiate between thermal or sub-thermal molecular gas up to . Measurements of the CO transition are necessary to check whether or not higher order CO transitions are in LTE in this galaxy. Interestingly, in the case of BzK-16000, our measurements suggest that the CO emission is sub-thermal () already at , resembling what appears to be the case for the inner disk of the Milky Way galaxy (Fixsen et al. 1999). Our estimate of differs from the LTE at the level. Measurements of higher transitions will help to study this particular galaxy in more detail.
Based on the previous CO observations of BzK-21000 (Dannerbauer et al. 2009), Daddi et al. (2010a) and Tacconi et al. (2010) assumed to convert their CO luminosities into CO luminosities. For this galaxy, we obtain , which validates, within , their assumption.
For a solid measurement of the average CO line emission and the average molecular gas properties of our BzK galaxies, we extracted cutouts centered at the VLA peak positions and produced a noise-weighted average CO map of their combined emission (Fig. 6). We obtain a detection with a flux density of Jy (). Stacking with respect to the CO position yields a flux density of Jy (5.5), consistent within the uncertainties () with the flux measured by stacking with respect to the VLA position. From the values presented in Daddi et al. (2010a) for the CO emission, we compute a noise-weighted average CO to CO brightness temperature ratio of , suggesting that the CO SED from these galaxies is thermalized up to . This ratio is consistent with what is found in local disk galaxies, which have lower CO luminosities than our BzK galaxies (Mauersberger et al. 1999; Bayet et al. 2006, and references therein), but it is also similar to other galaxy populations with CO luminosities comparable to that of our BzK galaxies, such as local ULIRGs (Weiß et al. 2005; Güsten et al. 2006; Hitschfeld et al. 2008; Bayet et al. 2006, 2009), and high-redshift SMGs and QSOs (Solomon & Vanden Bout 2005; Weiß et al. 2005; Riechers et al. 2006; Weiß et al. 2007). Thus, our comparison based only on CO to CO ratios is not yet sufficient to decide whether the excitation conditions in our BzK galaxies are, on average, different or not from those of other galaxy populations.
We note that Daddi et al. (2010a) assumed to convert the CO luminosities into CO luminosities for their sample of 6 BzK galaxies, following the Dannerbauer et al. (2009) results on BzK-21000. This assumption is supported by our measurement from the average stacked CO map.
From our stacked CO measurement, we find on average a SFE (K km s-1 pc2)-1. This, including individual values, is well below the average for high-redshift SMGs, (K km s-1 pc2)-1 (Greve et al. 2005; Tacconi et al. 2006) and similar to the values found for local spiral galaxies (Boselli et al. 2002; Leroy et al. 2008) and for other disk galaxies at high-redshift (Tacconi et al. 2010). However, it is marginally consistent with the average value found in local ULIRGs, (K km s-1 pc2)-1 (Solomon et al. 1997; Yao et al. 2003). We obtain an average gas depletion lifetime of Gyr for the galaxies in our sample, which is higher than what is found in SMGs, Gyr (Tacconi et al. 2006).
Observations of disk galaxies at high-redshift (including this work) have provided detections only for the lower- CO transitions, and thus they probe the lower end of the CO SED. Recent studies of high-redshift SMGs and QSOs have indicated that two gas components can be present: a cold, low density gas component and a warm, dense component (e.g., Weiß et al. 2007; Carilli et al. 2010). If indeed such is the case for star-forming BzK galaxies, observations of higher- CO lines are crucial. High-definition CO multi-transition studies over larger samples are necessary. Here, the EVLA and Atacama Large Millimeter Array (ALMA) will play a fundamental role, disentangling the molecular gas distribution of the cold molecular gas traced by CO and the warm gas probed by the higher- transitions.
References
- Aravena et al. (2008) Aravena, M., et al. 2008, A&A, 491, 173
- Bayet et al. (2006) Bayet, E., Gerin, M., Phillips, T. G., & Contursi, A. 2006, A&A, 460, 467
- Bayet et al. (2009) —. 2009, MNRAS, 399, 264
- Bell et al. (2005) Bell, E. F., et al. 2005, ApJ, 625, 23
- Boselli et al. (2002) Boselli, A., Lequeux, J., & Gavazzi, G. 2002, Ap&SS, 281, 127
- Carilli et al. (2007) Carilli, C. L., et al. 2007, ApJ, 666, L9
- Carilli et al. (2010) —. 2010, ApJ, 714, 1407
- Coppin et al. (2008) Coppin, K. E. K., et al. 2008, MNRAS, 389, 45
- Daddi et al. (2008) Daddi, E., Dannerbauer, H., Elbaz, D., Dickinson, M., Morrison, G., Stern, D., & Ravindranath, S. 2008, ApJ, 673, L21
- Daddi et al. (2010a) Daddi, E., et al. 2010a, ApJ, 713, 686
- Daddi et al. (2010b) —. 2010b, ApJ, 714, L118
- Dannerbauer et al. (2009) Dannerbauer, H., Daddi, E., Riechers, D. A., Walter, F., Carilli, C. L., Dickinson, M., Elbaz, D., & Morrison, G. E. 2009, ApJ, 698, L178
- Dekel et al. (2009) Dekel, A., et al. 2009, Nature, 457, 451
- Elbaz et al. (2007) Elbaz, D., et al. 2007, A&A, 468, 33
- Fixsen et al. (1999) Fixsen, D. J., Bennett, C. L., & Mather, J. C. 1999, ApJ, 526, 207
- Flower (2001) Flower, D. R. 2001, Journal of Physics B Atomic Molecular Physics, 34, 2731
- Genzel et al. (2008) Genzel, R., et al. 2008, ApJ, 687, 59
- Greve et al. (2005) Greve, T. R., et al. 2005, MNRAS, 359, 1165
- Güsten et al. (2006) Güsten, R., Philipp, S. D., Weiß, A., & Klein, B. 2006, A&A, 454, L115
- Hitschfeld et al. (2008) Hitschfeld, M., et al. 2008, A&A, 479, 75
- Kereš et al. (2005) Kereš, D., Katz, N., Weinberg, D. H., & Davé, R. 2005, MNRAS, 363, 2
- Leroy et al. (2008) Leroy, A. K., Walter, F., Brinks, E., Bigiel, F., de Blok, W. J. G., Madore, B., & Thornley, M. D. 2008, AJ, 136, 2782
- Lilly et al. (1996) Lilly, S. J., Le Fevre, O., Hammer, F., & Crampton, D. 1996, ApJ, 460, L1+
- Madau et al. (1996) Madau, P., Ferguson, H. C., Dickinson, M. E., Giavalisco, M., Steidel, C. C., & Fruchter, A. 1996, MNRAS, 283, 1388
- Mauersberger et al. (1999) Mauersberger, R., Henkel, C., Walsh, W., & Schulz, A. 1999, A&A, 341, 256
- Morrison et al. (2010) Morrison, G. E., Owen, F. N., Dickinson, M., Ivison, R. J., & Ibar, E. 2010, ApJS, 188, 178
- Riechers et al. (2008) Riechers, D. A., Walter, F., Brewer, B. J., Carilli, C. L., Lewis, G. F., Bertoldi, F., & Cox, P. 2008, ApJ, 686, 851
- Riechers et al. (2006) Riechers, D. A., et al. 2006, ApJ, 650, 604
- Riechers et al. (2009) —. 2009, ApJ, 703, 1338
- Solomon et al. (1997) Solomon, P. M., Downes, D., Radford, S. J. E., & Barrett, J. W. 1997, ApJ, 478, 144
- Solomon & Vanden Bout (2005) Solomon, P. M., & Vanden Bout, P. A. 2005, ARA&A, 43, 677
- Steidel et al. (1999) Steidel, C. C., Adelberger, K. L., Giavalisco, M., Dickinson, M., & Pettini, M. 1999, ApJ, 519, 1
- Tacconi et al. (2006) Tacconi, L. J., et al. 2006, ApJ, 640, 228
- Tacconi et al. (2008) —. 2008, ApJ, 680, 246
- Tacconi et al. (2010) —. 2010, Nature, 463, 781
- Walter et al. (2004) Walter, F., Carilli, C., Bertoldi, F., Menten, K., Cox, P., Lo, K. Y., Fan, X., & Strauss, M. A. 2004, ApJ, 615, L17
- Walter et al. (2009) Walter, F., Riechers, D., Cox, P., Neri, R., Carilli, C., Bertoldi, F., Weiss, A., & Maiolino, R. 2009, Nature, 457, 699
- Weiß et al. (2007) Weiß, A., Downes, D., Neri, R., Walter, F., Henkel, C., Wilner, D. J., Wagg, J., & Wiklind, T. 2007, A&A, 467, 955
- Weiß et al. (2005) Weiß, A., Downes, D., Walter, F., & Henkel, C. 2005, A&A, 440, L45
- Yao et al. (2003) Yao, L., Seaquist, E. R., Kuno, N., & Dunne, L. 2003, ApJ, 588, 771
- Zhu et al. (2003) Zhu, M., Seaquist, E. R., & Kuno, N. 2003, ApJ, 588, 243