Black hole mass, Host galaxy classification and AGN activity
Abstract
We investigate the role of host galaxy classification and black hole mass () in a heterogeneous sample of 276 mostly nearby () X-ray and IR selected AGN. Around 90 of Seyfert 1 AGN in bulge-dominated host galaxies (without disk contamination) span a very narrow range in the observed 12 to 2-10keV luminosity ratio (). This narrow dispersion incorporates all possible variations among AGN central engines, including accretion mechanism and efficiency, disk opening angle, orientation to sightline, covering fraction of absorbing material, patchiness of X-ray corona and measured variability. As a result, all models of X-ray and IR production in AGN are very strongly constrained. Among Seyfert 1 AGN, median X-ray and IR luminosities increase with black hole mass at confidence. Using ring morphology of the host galaxy as a proxy for lack of tidal interaction, we find that AGN luminosity in host galaxies within 70Mpc is independent of host galaxy interaction for Gyrs, suggesting that the timescale of AGN activity due to secular evolution is much shorter than that due to tidal interactions. We find that LINER hosts have lower 12 luminosity than the median luminosity of normal disk- and bulge-dominated galaxies which may represent observational evidence for past epochs of feedback that supressed star formation in LINER host galaxies. We propose that nuclear ULXs may account for the X-ray emission from LINER 2s without flat-spectrum, compact radio cores. We confirmed the robustness of our results in X-rays by comparing them with the 14-195keV 22-month BAT survey of AGN, which is all-sky and unbiased by photoelectric absorption.
keywords:
galaxies: active – galaxies: individual – galaxies: Seyfert – techniques: spectroscopic – X-rays: line – emission: accretion – disks :galaxies1 Introduction
Galactic nuclei generally considered to be ’active’ have bolometric luminosities of to times their host galaxy luminosity and are powered by accretion onto a supermassive black hole. The fundamental parameters that determine accretion onto the central black hole should be: (1) the black hole mass, (2) the amount of gas and dust in the galactic nucleus, (3) a mechanism to drive material in the galactic nucleus onto the black hole and (4) outflows as a result of accretion, which may affect (2) and (3) as feedback. While most galactic nuclei in the local Universe are believed to host very large mass black holes, only of these nuclei are highly luminous (e.g. Ciotti & Ostriker, 2001; Shankar et al., 2009). By contrast, low luminosity nuclei are far more common, accounting for of all galactic nuclei (Ho, 2008). Therefore some combination of the parameters determining accretion conspires to keep very luminous galactic nuclei relatively rare, while also providing a very wide range of observed activity at lower luminosities.
Black hole mass is the simplest parameter involved in accretion. The greatest activity (or highest bolometric luminosity) in a galactic nucleus occurs when a black hole accretes mass quickly. Black hole mass correlates with several properties of the central regions of the host galaxy, including bulge stellar velocity dispersion (), bulge mass and bulge luminosity (see e.g. Hopkins et al. (2007) and references therein). This implies that the largest mass black holes live in galaxies with large bulges. If most galactic bulges grew early in the Universe (e.g. Bournaud et al., 2007), then black holes grew fastest at that time and so activity in galactic nuclei may have been greatest at high redshift. However, periods of intense activity in a galactic nucleus could also arise at lower redshift, due to mergers between gas-rich galaxies (e.g. Hopkins et al., 2005) or when a large reservoir of cold gas builds up in the galactic disk (Kormendy & Kennicutt, 2004; Kauffmann et al., 2007).
The raw material for accretion onto the black hole is gas and dust in the galactic nucleus. How much gas and dust there is in the galactic nucleus depends on the local rate of formation of massive stars (Ciotti & Ostriker, 2007) and on mechanisms driving gas and dust into the nucleus from elsewhere in the galaxy. Mechanisms driving material into the galactic nucleus from the outside could be internal or external to the galaxy. Internal mechanisms involve bars (e.g. Hasan et al., 1993) or more generally, internal (secular) disk driven evolution (Kormendy & Kennicutt, 2004); external mechanisms involve tidal disruptions or mergers (e.g. Bournaud et al., 2007) or nuclear bombardment (McKernan et al., 2010). Not all of the material in the galactic nucleus needs to come from the rest of the galaxy. Material that gains angular momentum close to the accreting supermassive black hole can flow outwards to be recycled in the surrounding galactic nucleus (e.g. Ciotti & Ostriker, 1997; Schawinski et al., 2007; Sijacki et al., 2007; McKernan et al., 2007). Indeed if the feedback from the accreting black hole is powerful enough it could disrupt star formation in the galactic nucleus and beyond (Schawinski et al., 2007). Outflows from the accreting black hole into the surrounding galactic nucleus could end up terminating inflows onto the black-hole itself, which leads to a picture of galactic nucleus activity as self-regulating (e.g. Younger et al., 2008).
Isolating the fundamental parameters that determine the mass accretion rate onto supermassive black holes is a major observational problem. Many active galactic nuclei (AGN) are shrouded by obscuring material (Antonucci, 1993), although the obscuration can be complicated (e.g. McKernan & Yaqoob, 1998; Turner & Miller, 2009). AGN are mostly distant enough that broad-band observations include host galaxy luminosity contributions (e.g. from hot diffuse gas, X-ray binaries and ultra-luminous X-ray sources in the X-ray band alone). One approach to solving this difficult observational problem is to compare broadband luminosities in AGN with fundamental accretion parameters, such as black hole mass, or simple observables such as host galaxy classification, which may be related to fundamental accretion parameters.
In this work, we investigate the connection between black hole mass, host galaxy classification and the observed IR and X-ray luminosities of a heterogeneous sample of 276 AGN (mostly from (McKernan et al., 2009)). In section 2 we investigate the connection between AGN luminosity, black hole mass and host galaxy classification. In section 3 we discuss the AGN luminosity distribution and in section 4 we discuss the highly heterogeneous, non-Seyfert 1 AGN in our sample. In section 5, we discuss the importance of ringed morphology in host galaxies and the implications for AGN activity. We discuss issues of bias and completeness in our sample as well as the reliability of our conclusions in section 6 and in section 7 we summarize our conclusions.
2 A heterogeneous sample of AGN
In McKernan et al. (2009), for the first time we compared observed 2-10keV X-ray and infra-red luminosities in a large, heterogeneous sample of 245 AGN in the literature. Heterogeneous surveys such as this one include multiple biases and for a discussion of these, see McKernan et al. (2009) and Section §6 below. In some sources, the relative contribution of an AGN to the IR and X-ray luminosity of a LINER, starburst or ULIRG can be debated. Indeed multiple activity classifications are often given to the same source. In our sample, since we do not know the relative contribution of the AGN a priori, we do not exclude these objects. Furthermore, we avoid model assumptions about specific galactic nuclei or AGN types by simply using observed luminosities (host galaxy contamination included). Since AGN classification is complicated, in McKernan et al. (2009) we simply divided our sample in two: Group 1 AGN are Seyfert 1.X AGN (X=0-9) or QSOs. Group 2 AGN are everything else (Seyfert 2s, LINERs, low luminosity AGN, Starburst/AGN, cross-classified AGN). Table 1 lists some of the AGN in our sample, with the full sample in a machine-readable table online. Our key finding in McKernan et al. (2009) was that, once we removed highly beamed sources, the dispersion in the ratio of observed IR to X-ray luminosities in Group 1 AGN is narrow. A narrow dispersion in physical properties permits the establishment of strong constraints on the physical properties of the AGN, independent of assumptions about the central engine (e.g. orientation to sightline, clumpy torus, nature of accretion flow, extent or patchiness of X-ray corona and even AGN variability). For this work, we found additional AGN in the literature (Satyapal et al., 2005; Krongold, 2005; Lewis & Eracleous, 2006; Winter et al., 2009; Yuan et al., 2009; Tueller et al., 2010) to add to the sample in McKernan et al. (2009).
| Name | Host | AGN(Group) | log() | Ref. | |||
|---|---|---|---|---|---|---|---|
| PG 1404+226 | 437 | 0.01 | 0.03 | - | NLSy1 (1) | 6.70 | N, |
| RE 1034+396 | 184 | 0.10 | 0.13 | SBa;compact | NLSy1(1) | 6.81 | N, |
| Ton S180 | 263 | 0.46 | 0.12 | SABa | Sy1.2(1) | 6.85 | N,1 |
| Akn 120 | 138 | 3.30 | 0.30 | SAb pec | Sy 1(1) | - | N, |
| Mkn 1040 | 66.1 | 2.00 | 0.61 | SAbc int | Sy 1.0(1) | 6.36 | N,2 |
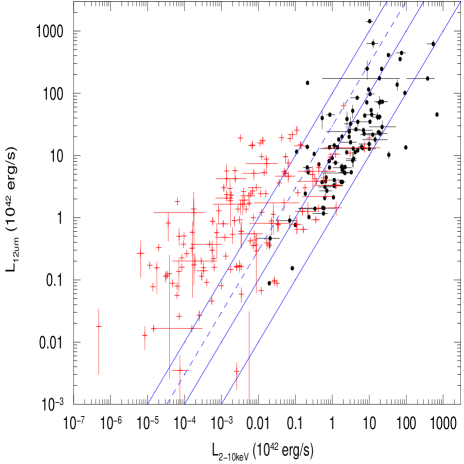
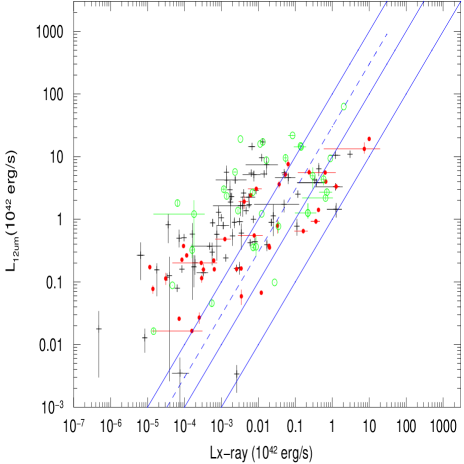
In Fig. 1 we plot the mean observed 12 luminosity versus mean observed 2-10keV luminosity for the AGN in our sample that are not jet-dominated. Black circles correspond to Group 1 AGN and red crosses correspond to Group 2 AGN. Error bars correspond to the range of observed luminosities for a given AGN. These error bars (where present) also reveal observer bias in our sample, since these are the AGN that have been observed multiple times. From Fig. 1, the AGN distribution is generally ’hockey-stick’ shaped. Even including variability, the Group 1 AGN lie in a fairly tight range of luminosity ratio (90 lie in the range ), forming the (black) ’stick’. The Group 2 AGN overlap with the Group 1 AGN but then flare out to much larger values of , forming the (red) ’blade’ of the hockey stick. In section § 3 below we shall discuss the significance of the hockey-stick shape of the AGN distribution. In this section we shall investigate the role played by black hole mass and host galaxy type in the observed IR and X-ray luminosities of the AGN in our sample. Since the Group 1 AGN contain less variation in the type and range of activity, we shall investigate these objects first.
2.1 Group 1 AGN
To start, we shall investigate the relationship between black hole mass and observed IR and X-ray luminosity of Group 1 AGN. Studies of stellar and gas kinematics in the centers of nearby galaxies (and indeed our own) reveal the presence of supermassive black holes (Kormendy & Richstone, 1995). Estimates of the central black hole mass from kinematics correlate with host galaxy properties, such as the velocity dispersion of stars in the bulge as well as bulge luminosity (see e.g. Hopkins et al., 2007, and references therein). It has therefore become possible to measure (with large uncertainty) central black hole masses in AGN (and in normal galaxies) based on observed values of (e.g. Satyapal et al., 2005) and bulge luminosity (e.g. Winter et al., 2009). Black hole mass in AGN can also be estimated via reverberation mapping (e.g. Peterson, 1993; Peterson et al., 2004), but see also criticism of the claimed accuracy (Krolik, 2001).
Of the AGN in our sample, some 154 had estimates of black hole mass in the literature (from references to Table 1). Where there are significant differences between black hole masses estimated for the same AGN, we used the value estimated using , since there is systematic error in bulge luminosity estimates in spiral galaxies, due to bulge-disk decomposition techniques (e.g. Gultekin et al., 2009). So our estimates will be biased in favour of those AGN in host galaxies where can be accurately deduced. In Figure 2 we plot the mean observed 12 IR luminosity versus the mean observed 2-10keV X-ray luminosity for Group 1 AGN, coloured according to estimated black hole mass. From Fig. 2, average X-ray and IR luminosities tend to increase with black hole mass, although for a given black hole mass, luminosities seem to span two or three orders of magnitude (). However there is considerable uncertainty in the estimated values of black hole mass in the literature. Different methods used to estimate black hole masses in the same AGN generally agree within a factor of few, but can differ by more than an order of magnitude (e.g. Satyapal et al., 2005; Winter et al., 2009). Reverberation mapping (e.g. Peterson et al., 2004) may involve uncertainties a factor of greater than estimated by authors (Krolik, 2001). Intrinsic dispersion in the correlation with as well as bulge-disk decomposition errors (Gultekin et al., 2009) are further sources of uncertainty in black hole mass estimates via the relation and bulge luminosity respectively.
In order to reduce the effect of relatively large uncertainties in measurements of black hole masses, we simply divided our sample of AGN into low mass () and high mass () populations. Estimated uncertainties in the measured mass of black holes generally do not exceed a factor of 10, so this strategy should enable us to assemble two distinct populations with few or no overlapping members. The T-test reveals that low and high mass Group 1 AGN do not have significantly different mean ratios of IR to X-ray luminosity () at a confidence level of . So Group 1 AGN appear to maintain a narrow range of across 3-4 orders of magnitude of .
Now we investigate the role of host galaxy classification in the observed IR and X-ray luminosities of Group 1 AGN. We follow other galaxy surveys by simply splitting AGN host galaxies into 3 groups: elliptical and lenticular (bulge-dominated), spiral (disk-dominated) and disrupted (peculiar morphology due to merging or tidal interaction). We separate bulge-dominated from disk-dominated hosts at Hubble stage (e.g. Kochanek et al. (2001)), so that a galaxy classed as SA0+ () for example, is bulge dominated (’early’) but SA0/a () is disk-dominated (’late’). We are therefore sensitive to classification error among (S0+,S0/a) galaxies. However galaxies in these two stages are of our sample. Table 2 lists the number of AGN in our sample according to NED classification of their hosts as bulge-dominated, disk-dominated or disrupted.
| bulgea | disk | disrupted | Total | |
|---|---|---|---|---|
| Group 1 | 22 | 28 | 16 | 66 |
| Group 2 | 40 | 72 | 32 | 143 |
In Figure 3 we plot the mean observed 12 IR luminosity versus mean observed 2-10keV X-ray luminosity for the Group 1 AGN from Table 2, colour coded according to host galaxy type. Note that there are considerably more galaxies in our sample with host galaxy classifications (209) than with black hole mass estimates (154). From Fig. 3, those AGN in hosts that are bulge-dominated (red filled-in circles) tend to pile up closer to the line than the disk-dominated AGN (black crosses). The mean (median) value of for disk-dominated Group 1 AGN (black crosses) in Fig. 3 is a factor of 3.4(2.5) larger than for bulge-dominated Group 1 AGN (red filled-in circles) and the two populations have different mean ratios of at a confidence level from the RS-test.
One obvious source of the greater dispersion among disk-dominated Group 1 AGN is emission from unresolved galactic disks. Note that host galaxy IR emission will be unresolved by the beamwidth of IRAS for most AGN in our sample. However, ground-based narrow beam (6-9′′) measurements of 10 nearby AGN observed by IRAS, reveal that host galaxy disks may account for around half the IRAS flux measurement (Edelson et al, 1987). We found that the median IR luminosities of disk-dominated Group 1 AGN is erg greater than the median IR luminosity of bulge-dominated Group 1 AGN. This IR excess is presumably due to the unresolved galactic disk (see also the discussion in § 3 below). However, we also found that the median 2-10keV X-ray luminosity in disk-dominated Group 1 AGN is a factor of 2 lower than in bulge-dominated Group 1 AGN. This median X-ray deficit ( erg ) may be due to a greater covering fraction of dust and gas among AGN in disk-dominated hosts. The heating caused by the absorbed or scattered X-rays will emerge isotropically from the covering dust, which should in turn contribute to the observed IR excess.
So there are two components of the greater scatter among disk-dominated Group 1 AGN. First is an average IR excess of erg probably due to contamination by the unresolved host galaxy. Second is an X-ray deficit of erg possibly due to absorption by a greater covering fraction of gas and dust, which would contribute to IR excess. Therefore true dispersion in observed in Group 1 AGN, is best represented by the bulge-dominated Group 1 AGN. The dispersion among our sample of bulge-dominated Group 1 AGN alone is but 90 (14/16) lie within the range , which is a remarkably narrow dispersion considering that it includes variation in all central engine model parameters.
2.2 Group 2 AGN
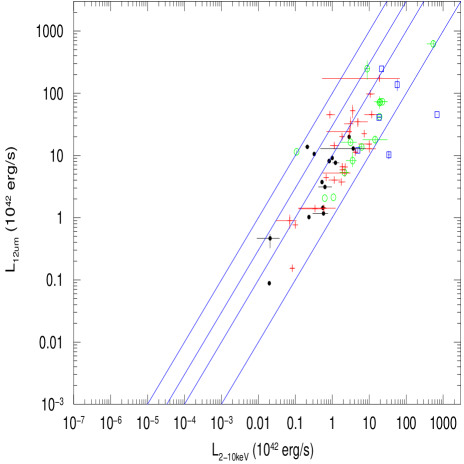
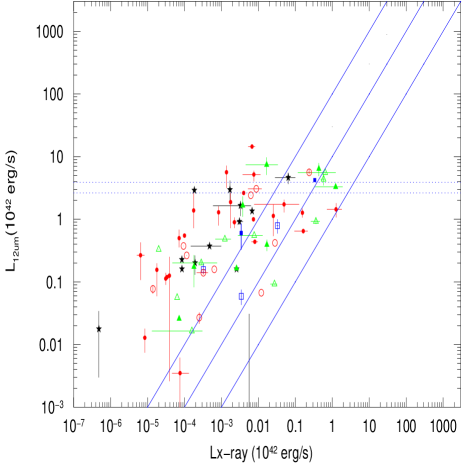
Here we investigate the role that black hole mass and host galaxy classification play in the observed X-ray and IR luminosities of Group 2 AGN, the ’blade’ of the hockey-stick distribution in Fig. 1. In Figure 4 we plot the mean observed 12 IR luminosity versus the mean observed 2-10keV X-ray luminosity for Group 2 AGN, coloured according to estimated black hole mass. Clearly Group 2 AGN behave differently to the Group 1 AGN. Most Group 2 AGN have low values of (erg ), but can range from low (erg ) to ultra-luminous (erg ). From Fig. 4, the ratio of IR to X-ray luminosities () broadly tends to decrease with black hole mass, going from (black filled in circles and red crosses) to (green open circles) to (blue open squares). However, we saw above in §2.1 that disk-dominated hosts could contribute significantly to the observed IR luminosity. So host galaxy classification will be important for the interpretation of our results.
In Figure 5 we plot the mean observed 12 IR luminosity versus mean observed 2-10keV X-ray luminosity for the Group 2 AGN from Table 2, plotted according to host galaxy type. Those Group 2 AGN in disk-dominated hosts (black crosses) tend to have higher median than Group 2 AGN in bulge-dominated hosts (red filled-in circles) at low . This is consistent with a larger contribution to the observed IR luminosity from unresolved disk-dominated hosts (as we found for Group 1 AGN in Fig. 3), although this may not be the whole story (see § 3 below). The scatter in in Fig. 5 is comparable for both bulge- and disk-dominated Group 2 AGN (unlike Group 1 AGN). Many of the Group 2 AGN with the highest in Fig. 5 live in disrupted hosts (green open circles). This is probably due to an increase in star formation in the host galaxy rather than increased AGN activity. Otherwise we should observe the same trend in Fig. 3 among Group 1 AGN in disrupted hosts. AGN on the boundary between Group 1 and Group 2 classifications, i.e. cross-classified Group 2 AGN that include a Sy1.X classification appear to be dominated by the Sy1.X component in bulge-dominated hosts, since their median is consistent with that of Group 1 AGN.
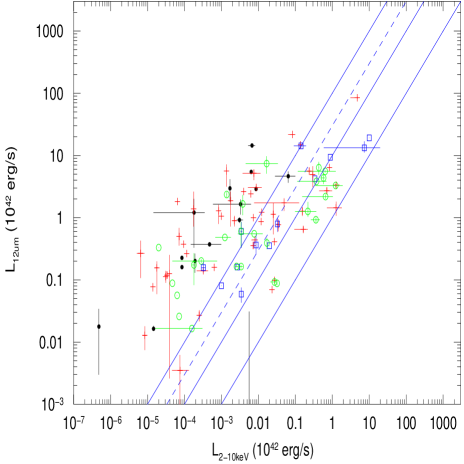
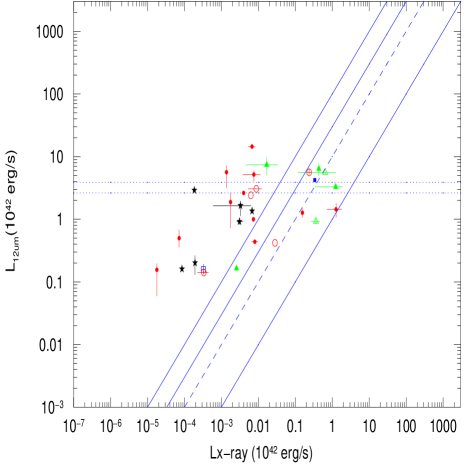
In Fig. 6 we plot mean observed 12 IR luminosity versus mean observed 2-10keV X-ray luminosity for all Group 2 AGN at , divided according to both estimated black hole mass and host galaxy classification. From Fig. 6, we note that Group 2 AGN in bulge-dominated hosts tend to be either less IR luminous or have a lower (more Group 1-like) value of .
3 The hockey-stick shape distribution of AGN
We saw in Fig. 1 that the distribution of the AGN in is ’hockey-stick’ shaped. The homogeneous Group 1 AGN lie in a fairly tight range of luminosity ratio, forming the ’stick’. The heterogeneous Group 2 AGN flare out to much larger values of , forming the ’blade’ of the hockey stick. In this section, we discuss the Group 2 ’blade’ of the hockey-stick distribution.
There are two main causes of a Group 2 AGN blade in the hockey-stick distribution. First, unresolved IR emission from the host galaxy (e.g. nuclear starburst or star formation) may dominate the AGN IR luminosity, pushing individual low IR luminosity AGN vertically up off the main (Group 1) distribution (the ’stick’). Contamination by non-AGN emission will therefore add a natural floor to the observed distribution of in AGN. Second, the observed X-ray luminosity may be a small fraction of the intrinsic X-ray luminosity due to absorption, pushing individual highly absorbed AGN horizontally (leftwards to lower X-ray luminosities) off the main Group 1 distribution (the ’stick’). A clear test of this possibility is to look at a sample of Group 1 and Group 2 AGN unbiased by photoelectric absorption, where we expect the absorbed Group 2 AGN ’blade’ to collapse back onto the ’stick’. We carry out such a test and discuss the results in § 6.1 below. A third possibility, that changes in the AGN obscurer with conspire to keep flat with , can be ruled out. This is because an increase in bolometric luminosity with (expected from the standard model and Fig. 2) should emerge as heating in the IR band. However we find that remains flat with across the IRAS 12-100 bands. We shall now consider the contribution of unresolved emission to the formation of the Group 2 AGN ’blade’.
We saw in § 2.1 that Group 1 AGN in disk-dominated hosts have a larger mean observed IR luminosity than those in bulge-dominated hosts, probably due to contamination from the unresolved disk (see Fig. 3). We should therefore expect to see something similar for the Group 2 AGN. In this vein, it is noteworthy that in Fig. 5, the top of the Group 2 ’blade’ tends to be occupied by AGN in disrupted hosts (green open circles) and the base of the ’blade’ is mostly AGN in bulge-dominated hosts (red filled-in circles), with AGN in disk-dominated hosts (black crosses) dispersed between the two. The quantity of dust and the star formation rate in galaxies declines in the order: disrupted, disk-dominated, bulge-dominated. Therefore the average unresolved host contribution should indeed decrease going from disrupted to disk-dominated to bulge-dominated hosts. Since the 30” IRAS beamwidth does not resolve the host galaxy in most cases, the observed IR luminosity could be dominated by the unresolved host contribution.
We tested this possibility by comparing the the Group 2 ’blade’ of the hockey stick with the IR luminosity expected for normal bulge- and disk-dominated galaxies. From a very small recent sample of normal bulge-dominated galaxies (Temi,Brighenti & Mathews, 2008) we found a median 12 IRAS luminosity of erg , which is slightly below the median of the bulge-dominated Group 2 AGN (red filled-in circles) in Fig. 5. However, a much larger (and statistically more reliable) sample of 148 normal elliptical galaxies (Eskridge, Fabbiano & Kim, 1995) yields a higher mean (median) IRAS 12 luminosity of erg , although some low luminosity AGN may be included in this estimate. This latter median luminosity is indicated in Fig. 6 by the lower of the two horizontal dashed lines. In the case of disk-dominated galaxies, (Shapley, Fabbiano & Eskridge, 2001) find in a sample of 218 normal spiral galaxies () a mean(median) IRAS 12 luminosity of erg . The erg difference between the median 12 luminosity of elliptical and spiral galaxies is consistent with our rough estimate of a median IR contribution of erg from unresolved disks for Group 1 AGN (see § 2.1 above). Evidently these median luminosities exceed the IRAS 12 luminosity of of the Group 2 AGN in Fig. 1. So, unresolved host galaxy emission could indeed dominate the IR luminosity of a majority of the Group 2 AGN in our sample. Furthermore, even recent looks with Spitzer at distant AGN are consistent with IRAS observations, indicating that it is difficult to separate the non-AGN and AGN IR components except for nearby objects (Veilleux et al., 2009).
Fig. 5 shows that the Group 2 ’blade’ can be divided roughly between bulge-dominated hosts with generally lower and disk-dominated hosts with higher . A generally lower in bulge-dominated hosts is presumably due to the presence of less warm gas, dust and star formation than in disk-dominated hosts. This may be due in part to past episodes of intense AGN activity inhibiting star formation and blowing out gas and dust. We expect past episodes of feedback to have been greatest for AGN containing the largest mass black holes in the largest bulges. Sure enough Schawinski et al. (2007) have found evidence that AGN at in elliptical host galaxies suppressed star formation in their hosts, and we discuss the relevance of this to our sample in §4 below.
4 Group 2 AGN
We now have a relatively straightforward picture of the homogeneous Group 1 AGN, where the central engine generally scales with black hole mass (Fig. 2). Our picture of the heterogeneous Group 2 AGN is far less straightforward. Group 2 AGN span a wide range of activity classification (Seyfert 2, LINERs, regions as well as cross-classifications) and there could be many causes of their observed IR and X-ray luminosities. In this section, we study the Seyfert 2 AGN and LINER subsets of Group 2 AGN and we shall discuss models of their activity.
4.1 Seyfert 2 AGN
In the standard model, Seyfert 2 AGN are Seyfert 1 AGN seen edge-on to the observer’s sightline (Antonucci, 1993; Urry & Padovani, 1995). In Fig. 7 we plot only those objects from Fig. 6 classified or cross-classified as Seyfert 2 AGN. From Fig. 7, tends to increase with , particularly if we separate out low AGN (black points, ) and high AGN (green and blue points, ). However, remains flat with large scatter, therefore tends to decrease with . If Seyfert 2 AGN are edge-on versions of Seyfert 1 AGN (Group 1), then we should expect intrinsic and to broadly increase with as in Fig. 2. The fact that observed does seem to increase with indicates that X-rays do escape from the AGN, presumably via scattering, reflection or leakage through variable covering, but this is a small fraction of the expected intrinsic (see e.g. the Group 1 AGN in Fig. 2).
If Seyfert 2 AGN are Seyfert 1 AGN seen edge-on, we also expect observed to increase on average with , which we do not observe in Fig. 7. remains flat (with large scatter) for these Seyfert 2 AGN at longer IRAS wavelengths so the increased bolometric luminosity is not being reprocessed and emitted in the IRAS bandpass. Instead it seems likely that that the IRAS beamwidth () introduces a floor to IR luminosity, due to emission from the unresolved host galaxy as we discussed in § 3 above. Indeed unresolved emission remains a problem even for modern high resolution IR spectroscopy of nearby AGN (Horst et al., 2009).
Hunt et al (1999) find higher ( mag ) median K-band (2.2) surface brightness of disks in Seyfert galaxies compared to normal spiral galaxies. If the disks of Seyfert AGN hosts are significantly brighter than normal spiral disks at 12, then based on the unified model of AGN, Seyfert 2 AGN in disk-dominated hosts should lie near the top of the Group 2 ’blade’ (near erg ) of the hockey-stick distribution. However, from Fig. 7, only Seyfert 2 AGN with (green and blue points) have higher median than for normal spiral galaxies (upper horizontal line).
Note that the median of the 22/30 disk-dominated Seyfert 2 AGN in Fig. 7 is erg which, for a small sample, remains consistent with the median of a normal spiral galaxy ( erg see §3 above). The 8/30 Seyfert 2 AGN in bulge-dominated hosts in Fig. 7 tend to have lower a luminosity ratio range () than their disk-dominated counterparts. Future high angular resolution IR studies of AGN could reveal Seyfert 2 AGN uncontaminated by host galaxy emission (Gandhi et al., 2009). However, we can also test the hypothesis that Seyfert 2 AGN have the same central engine as Seyfert 1 AGN by contrasting the very hard X-ray (14-195keV) emission for Group 1 and Group 2 AGN (see §6.1 below).
4.2 LINERs
LINERs are a low-ionization sub-set of galactic nucleus activity. It is unclear whether LINERs are due to a different type of accretion flow onto the SBH, an evolutionary state of AGN activity, or merely a low accretion rate version of regular AGN activity. Kewley et al. (2006) find that LINERs (at ) occur in more massive, older hosts with higher stellar velocity dispersions and that there is a smooth transition from Seyfert AGN to LINER, suggesting that LINERs are indeed (mostly) AGN. Schawinski et al. (2007) suggest that LINERs are likely transitioning from more active to less active states. Schawinski et al. (2007) also found evidence that AGN at in elliptical host galaxies suppressed star formation which is relevant to our discussion below.
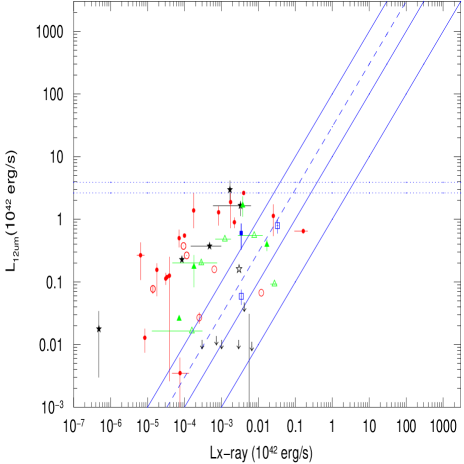
In Fig. 8 we plot only those objects from Fig. 6 that are classified or cross-classified as LINERs. From Fig.8, the median observed for LINERs in disk-dominated hosts is well below the median for normal spiral galaxies (upper horizontal dashed line) suggesting either older stellar populations in the hosts or past prodigious feedback in both bulge- and disk-dominated hosts of present-day LINERs. Interestingly, the disk-dominated LINER hosts in our sample tend to lie close by (Mpc or ). This may indicate that disk-dominated LINERs have been undercounted in the SDSS () surveys (Kewley et al., 2006), possibly due to lower than average surface brightness of the hosts or it may be that some of the disk-dominated LINERs are misclassified. Recently Stasińska et al. (2008) suggested that some LINERs might correspond to ’retired’ galaxies, where ionizing radiation originates in post-AGB stars and white dwarfs rather than a weakly accreting black hole. This is an intruiging possibility, but it begs the question, if the X-ray luminosity in these sources does not come from accretion onto a supermassive black hole, where does it come from?
4.3 Could ULXs live in galactic nuclei?
Not all nuclear activity may be due to accretion onto a supermassive black hole. Tereshima & Wilson (2003) propose that LINER 2s (LINERs without broad wings) with no flat-spectrum compact radio cores are not AGN at all, but rather ’heterogeneous’ in origin. If radio-quiet LINER 2s are not due to accretion onto a supermassive black hole, then what produces the narrow optical lines and X-ray emission? Recent studies suggest that post-AGB stars and white dwarfs could account for the ionization in some LINERs (e.g. Stasińska et al., 2008; Eracelous, Hwang & Flohic, 2010). Narrow optical lines in such low luminosity nuclei can certainly also be produced as a result of star formation (Tereshima & Wilson, 2003), but what about the X-ray emission and estimates of a large central black hole mass?
A large mass estimate for the central from e.g. bulge properties, combined with nuclear hard X-ray continuum does not automatically imply AGN activity for these radio quiet LINER 2s. A quiescent supermassive black hole could exist at the center of the host galaxy, leading to an (appropriate, accurate) large estimate. Furthermore, there are several candidates capable of producing the observed X-ray luminosities. X-ray luminosities ergs can be produced by high mass X-ray binaries, known as galactic black hole candidates (GBHCs) in our Galaxy. GBHCs are observed to reproduce all the aspects of an X-ray spectrum of an AGN, including broad and narrow Fe K emission (Rossi et al., 2005; Miller et al., 2004) and reflection features. GBHCs also transition from soft, high states to hard, low states on short timescales, which may be analagous to the Seyfert and LINER states in AGN on much longer timescales (e.g. Kewley et al., 2006). X-ray luminosities ergs can be produced by ultra-luminous X-ray sources (ULXs) (e.g. Miller & Colbert, 2004). ULXs are powered by either large stellar mass black holes () accreting at near Eddington luminosities (possibly with beaming) or intermediate mass black holes (IMBHs) accreting at a fraction of their Eddington luminosities. ULXs are defined as non-nuclear X-ray sources, but there is no reason to expect that a large stellar mass black hole or IMBH should not live in the nucleus of a galaxy, particularly if there have been periods of enhanced star formation. So, we propose that if these ’radio-quiet’ LINER 2s are not actually AGN, then their X-ray emission originates in nuclear ULXs. In the case of LINER 2 nuclei without flat-spectrum, compact radio cores, a large estimate and detection of a hard X-ray continuum/ Fe K emission may not actually indicate AGN activity. There is a simple test of this model for nuclear ULX emission, namely a combination of short timescales of X-ray variability and a large fractional X-ray variability (excess variance) combined with spectral changes. X-ray variability timescales alone are insufficient, since partial covering changes could account for very small timescales (e.g. McKernan & Yaqoob, 1998; Turner & Miller, 2009). However, very large fractional variability combined with a change in the spectrum indicate a large stellar mass black hole with GBHC-like behaviour. If an IMBH is responsible for the X-ray emission, then the fractional X-ray variability should be intermediate between AGN and GBHCs and the black-body temperature of the accretion disk should be lower (in the UV to soft X-ray band) than for a GBHC (soft X-ray band) (Miller & Colbert, 2004). Furthermore, if ULXs are responsible for the X-ray emission in these galactic nuclei, then the low ionization optical radiation must originate somewhere other than accretion onto a supermassive black hole. One intruiging possibility is that these galaxies may have retired from star formation and therefore produce hotter emission line regions (Stasińska et al., 2008). Optical studies of ’radio-quiet’ LINER 2 host galaxies using SDSS could test the reality of LINER activity in these hosts.
Fig. 8 includes several ULXs (denoted by downward pointing arrows) from Hui & Krolik (2008). Note that the 2-10keV luminosity estimates for the ULXs are based on model fits rather than observed flux. The ULXs have upper limits to (based on the IRAS flux detection limit and estimated distance). Based on the upper limits of , the ULX luminosity ratio is more akin to Group 1 AGN than Group 2 AGN. If for the ULXs is considerably lower than the upper limits depicted in Figs 6 and 8, then for ULXs could be very small (), implying that the ULXs are jet-dominated or strongly beamed (see McKernan et al., 2009). New observations of ULXs by Spitzer (yet to be published at time of writing) will hopefully reveal interesting limits on their IR luminosity.
5 Testing models of AGN activity driven by host galaxy interactions
External tidal interactions have long been thought of as one possible fuelling source for AGN (Sanders et al., 1988) and certainly mergers and interactions may have been powerful drivers of nuclear activity in earlier epochs. Interactions may produce some nuclear activity in the form of a starburst, which may in turn lead to later AGN activity (Ciotti & Ostriker, 2007). However, there are many problems with this model of fuelling AGN in the local Universe. It has been known for a long time that optically identified AGN occur far more frequently in field galaxies () than in clusters () (Dressler et al, 1985), which suggests that either (1) higher rates of interaction somehow inhibit AGN fuelling, (2) interactions are not significant drivers of AGN activity in general or (3) AGN activity lags the actual interaction by a very long time. Recent studies suggest that mergers are not a significant driver of optically selected AGN activity (e.g. Kauffmann et al., 2004; Grogin et al., 2005), see however Tang et al. (2008). The internal properties of galaxies and feedback seem to have a greater correlation with optically selected AGN activity than density of galaxies in the host galaxy environment (Maia, Machado & Willmer, 2003; Schawinski et al., 2007). Using X-ray selected AGN, the story is not very different. The AGN fraction drops going from sparse groups to dense clusters, even as the rate of interaction or merger should be increasing (Arnold et al., 2009), confirming optical results. Among AGN in compact groups the broad-line region may be entirely absent, possibly due to a decrease in gas flow to the nucleus as a result of mergers/interactions (Martínez et al, 2008). Among X-ray selected AGN in disk dominated galaxies, internal instabilities or at most, minor interactions appear to be the key driver of AGN fuelling (Georgakakis et al., 2008). Indeed studies of the number of companion galaxies around X-ray selected AGN suggest that strong interactions occur at the same rate for AGN hosts as for normal galaxies (Gabor et al., 2009). Among X-ray and IR selected AGN, host galaxies are more likely to be closely paired than isolated, however the pairs are found to be non-interacting and undisturbed (Pierce et al., 2007). So, if interactions are actually important in fuelling AGN, observations suggest a non-trivial dependency and it is unclear exactly how the link can be made.
AGN fuelling requires dust and gas in the central pc of a galaxy. Since most gas and dust in a galaxy lives far from the galactic nucleus, it is unclear how the gas can lose angular momentum and migrate inwards to fuel AGN. Several mechanisms have been proposed, but at best there must be a hand-off between different mechanisms operating on different distance- and size-scales (Krolik, 2001). In this section, we point out that AGN host galaxies with deVaucouleurs outer ring (R,R′) morphological classification have been overlooked as a very useful probe of models of host interaction leading to AGN activity. Since Lindblad resonance rings seem to be very sensitive to small changes in the host galaxy (e.g. Buta & Combes, 1996; Bagley et al., 2009) it turns out that they are a particularly powerful test of models of AGN fuelling via interactions and mergers.
Ringed structures are relatively common in and around galaxies in the nearby Universe, with three main varieties: collisional and polar rings (which we shall not discuss further here) and diffuse Lindblad resonance rings (see e.g. Buta & Combes, 1996, for a review). Resonance rings are believed to form via the actions of galactic bars and can take a long time to form (Gyrs for some outer rings) (Buta & Combes, 1996), Gyr for certain pseudo-rings (R′) (Bagley et al., 2009). It is hard to distinguish between ring varieties for distant galaxies, but candidate resonance rings at could even take Gyrs to form (Elmegreen & Elmegreen, 2006). Resonance rings in galaxies have long been considered fragile, easily destroyed by tidal interactions (Buta & Combes, 1996), or even by minor changes in bar pattern speed (Bagley et al., 2009). This fragility, apparent from simulations, makes resonance ring structures around galaxies a particularly useful probe of the relatively recent interaction history of a galaxy.
In our sample, we find that 9/24 Group 1 AGN and 20/97 Group 2 AGN in () host galaxies Mpc distant, possess outer (R,R′) rings (deVaucouleurs et al, 1991). This rate is consistent with the occurrence of (R,R′) in the IRAS sample of galaxies (Hunt & Malkan, 1999). These AGN host galaxies and their (ringed) de Vacouleurs classification are listed in Table 3. There are ringed host galaxies in our sample out to Mpc, but ringed host galaxies are undercounted if the rings have low surface brightness or are edge-on, so our selection is naturally biased by distance. Thus we limit ourselves to analyzing the sample of ringed host galaxies at Mpc following Hunt & Malkan (1999). The RS and T-statistic tests reveal that the AGN hosts with outer rings (R,R′) in Table 3 are drawn from the same population of , and as the rest of the Group 1 and Group 2 AGN (within 70Mpc) at probabilities of . Therefore, since galaxies with outer rings have presumably had no tidal interactions in at least the past Gyr (see above), present AGN activity (which lasts few 10Myrs) is very unlikely to be due to interactions (NGC 2685 is the possible exception since it has an outer ring but is also cross-classified as peculiar). Furthermore, if tidal interactions generated the activity observed in our control group (no rings, Mpc), it is indistinguishable from activity due to secular processes. Note that we can conclude the same thing from the Group 1 AGN back in Fig. 2, where AGN in disk-dominated and (presumably tidally) disrupted hosts have a very similar spread in and . The RS and T-statistic tests on AGN at Mpc also reveal no significant difference in between those host galaxies with and without outer rings (R,R′), when we take into account uncertainty in the mass estimates. Therefore it seems likely that the AGN in our sample have had approximately their present for a long time as suggested by recent simulations (e.g. Kormendy & Kennicutt (2004); Hopkins et al. (2005); Portegies-Zwart et al. (2006); Bournaud et al. (2007)). If tidal interactions are not the main driver of AGN activity in our sample, this suggests a number of possible explanations. The most likely explanation is that the timescale for activity driven by processes internal to the galaxy () is much smaller than the timescale for activity driven by processes external to the galaxy (), or . It is easy to see that estimates of rapid bar dissolution times and galaxy rotation speeds (Bagley et al., 2009) are much shorter than the expected dynamical timescales of tidal interactions.
| Galaxy | Classification |
|---|---|
| Group 1 | |
| Mkn 766 | (R′)SB(s)a |
| NGC 3516 | (R)SB(s) |
| NGC 3783 | (R′)SB(r)ab |
| NGC 4151 | (R′)SAB(rs)ab |
| NGC 4593 | (R)SB(rs)b |
| NGC 5548 | (R′)SA(s)0/a |
| NGC 6860 | (R′)SB(r)ab |
| NGC 7469 | (R′)SAB(rs)a |
| ESO323-G077 | (R)SAB(rs) |
| Group 2 | |
| NGC 1068 | (R)SA(rs)b |
| NGC 1808 | (R)SAB(s)a |
| NGC 2639 | (R)SA(r)a |
| NGC 2681 | (R′)SAB(rs)0/a |
| NGC 2685 | (R)SB0+;pec |
| NGC 3185 | (R)SB(r)a |
| NGC 4457 | (R)SAB(s)0/a |
| NGC 4507 | (R)SAB(rs)b |
| NGC 4736 | (R)SA(r)ab |
| NGC 4750 | (R)SA(rs)ab |
| NGC 4941 | (R)SAB(r)ab |
| NGC 4968 | (R′)SAB |
| NGC 5347 | (R′)SB(rs)ab |
| NGC 7465 | (R′)SB(s) |
| NGC 7582 | (R′)SB(s)ab |
| MCG-5-23-16 | (RL)SA(l) |
| Mkn 573 | (R)SAB(rs)0+ |
| Mkn 1066 | (R)SB(s)0+ |
| Mkn 1157 | (R’)SB0/a |
| IC 4709 | (R1)SB(r)0+ |
For galaxies in the IRAS sample within 70Mpc, outer ring structures (not collisional) are found in only (48/479) of normal galaxies, but are much more common in Seyfert AGN host galaxies (19/57) (Hunt & Malkan, 1999). An intruiging possibility is that tidal interactions actually disrupt the action of bars so that both ring formation and AGN activity are inhibited, which would be consistent with conclusions from recent optical and X-ray studies of AGN (Martínez et al, 2008; Arnold et al., 2009). A simple test of this hypothesis is that the occurrence of AGN in recently disrupted barred spiral hosts should be lower than the occurrence of AGN among all barred spiral hosts. We shall return to this hypothesis in future work.
6 Biases in our Sample
In McKernan et al. (2009) we discussed biases in our sample and our results, particularly with reference to the all-sky IRAS (12-100) and soft X-ray (ROSAT) surveys. We pointed out that in a heterogeneous sample such as ours, there are many biases, generally in favour of more luminous, local AGN, and against less luminous, more distant AGN. Here we briefly review some of the more important biases, but see e.g.Ho (2008) for warnings about heterogeneous samples of AGN in general and McKernan et al. (2009) for more detailed discussion of most of the present sample.
On one hand, since we consider the reported observed AGN luminosity, we are biased against highly obscured AGN (particularly at larger distances). We also introduce error into luminosity estimates, since non-AGN host galaxy contributions to the luminosity are included in the observed luminosity in most cases. A further error in luminosity estimates is introduced since internal and Galactic absorption corrections are not systematically reported for all sources. On the other hand, an advantage of using observed luminosity is that we avoid assumptions about the central engine of AGN in order to estimate the intrinsic AGN luminosity. Furthermore, all but the highest resolution observations of the closest AGN include non-AGN contributions. By using the observed AGN luminosity, we avoid the difficult (and model-dependent) problem of de-coupling the non-AGN contribution (which may be significant in many lower-luminosity AGN in our sample). So, all our luminosity estimates include a non-AGN component of variable size. For example, in the X-ray band, the non-AGN component may consist of hot, diffuse gas, X-ray binaries or ULXs in the host galaxy. In the IR band, the non-AGN component may consist of star-forming regions or warm dust in the host galaxy.
Our heterogeneous sample also introduces an obvious observation bias; many AGN have been observed in the 2-10keV X-ray band but were not seen with IRAS (or at least had upper limits). Likewise, some IRAS-detected AGN have not been observed in the 2-10keV band (or only have upper limits). None of these AGN have been included in our sample. In the case of the former (X-rays but no IR), we introduce a bias against AGN with very little warm dust (perhaps colder or more distant tori, or torus-less AGN with no star formation, or AGN with past episodes of feedback that destroyed small dust grains?). In the case of the latter (IR but no X-rays) we introduce a bias against sources with very low luminosity (radiatively inefficient?) accretion onto the central black hole in a relatively warm and dusty environment.
In dividing our sample into two groups, we split according to optical line widths (the Seyfert 1.X) classification. However, for example, a Seyfert 1.5 that is also classified as a starburst would be a Group 2 object in our sample. In this case, we introduce a bias in broad line objects against cross-classification (which may be due to obscuration, viewing angle or unrelated nuclear activity). ULIRGs are another good example of complexity in a source, since some are cross-classified as Seyfert, starburst and interacting objects and the fraction of their bolometric luminosity that is due to AGN can vary from (Veilleux et al., 2009), making these obvious Group 2 candidates in our sample, with a potentially large non-AGN component. However, cross-classified ULIRGs are a very small fraction of our sample. For further detailed discussion of the X-ray and IR biases that are present in our sample, see (McKernan et al., 2009).
6.1 Comparison with an X-ray survey unbiased by absorption
While there has been no all-sky survey in the 2-10keV band, new all-sky surveys are emerging in the hard (10keV) X-ray band, unbiased by photoelectric absorption. Where X-rays are unbiased by absorption, we should be able to detect the intrinsic X-ray luminosity of Group 2 AGN. This means that in a luminosity ratio plot analagous to Fig. 1 using very hard X-rays, we should expect the ’blade’ of the ’hockey stick’ shaped distribution of AGN to collapse onto the ’stick’. In this section, we shall investigate the significance of our results by considering just those AGN in the hard X-ray all-sky surveys.
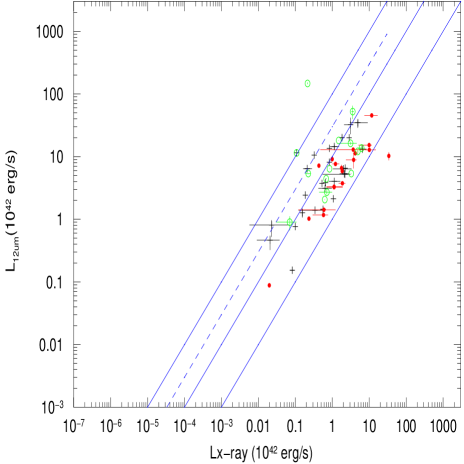
The 22-month, all-sky, SWIFT BAT survey has a detection sensitivity of erg over most of the sky in the 14-195keV band (Tueller et al., 2010). The 22-month BAT catalogue contains a total of 461 sources, including 262 AGN (Tueller et al., 2010), of which 228 are Seyfert AGN and LINERs (equivalent to AGN in our sample). Of these AGN, 89 were not detected with IRAS or had upper limits only at 12. A further 40 are either unidentified with a counterpart or have no 2-10keV flux measurements. The remaining 99 AGN are in our full sample. Of these 99 AGN, some 83 can be classified as Group 1 or Group 2 (the remaining 16/99 are highly beamed according to their NED classifications). In Tueller et al. (2010) 104 AGN have both 12 and 14-195keV luminosity. In Fig. 9 we plot the very hard X-ray luminosity (14-195keV) from (Tueller et al., 2010) versus mean observed 12 IRAS luminosity for these 104 AGN observed with BAT (83 of which are in our sample). Symbols are as in previous figures and the dotted line in Fig. 9 represents .
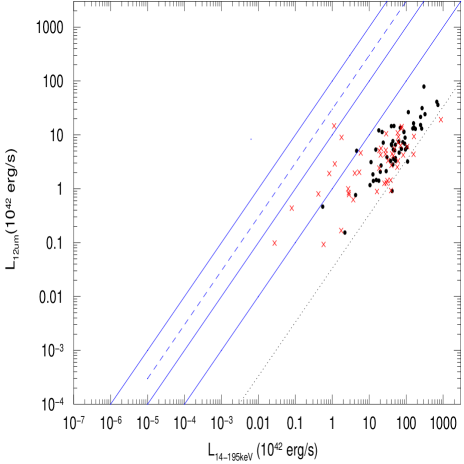
Fig. 9 reveals several things. First, the Group 1 AGN (black circles) have higher X-ray luminosities in the 14-195keV band than in the 2-10keV band by a factor on average. This has the effect of moving the whole Group 1 distribution to the right in parameter space (since the 12 luminosity is obviously unchanged). Second, most of the Group 2 AGN (red crosses) in Fig. 9 lie on top of the distribution of Group 1 AGN. The ’hockey stick’ distribution of Fig. 1 has collapsed onto the ’stick’ in Fig. 9. This shows that the central engines of the Group 1 and most of the Group 2 AGN are identical (see also the discussion in §4.1 above). Third, there is greater scatter among the Group 2 AGN. This is due to the more heterogeneous nature of the Group 2 AGN. In particular note that all 7/46 Group 2 AGN with are classified wholly or in part as LINERs. These LINERs have hard X-ray luminosities one or two orders of magnitude less than the Seyfert 2 AGN. Fourth, the magnitude of the dispersion in the luminosity ratio of 55/56 Group 1 AGN in Fig. 9 is . This factor of in dispersion in the 14-195keV band is identical to the dispersion range of for Group 1 AGN in the 2-10keV band (see Fig. 1 above). In fact the dispersion in the 14-195keV band is slightly tighter since the factor of dispersion in in the 2-10keV band applied to of Group 1 AGN. The fact that dispersion in among Group 1 AGN is effectively constant between the 2-10keV and 14-195keV bands suggests that (a) the dispersion is intrinsic to the central AGN engine, apart from possible IR contributions from the host galaxy and (b) photoelectric absorption at 2-10keV for the Group 1 AGN is insignificant.
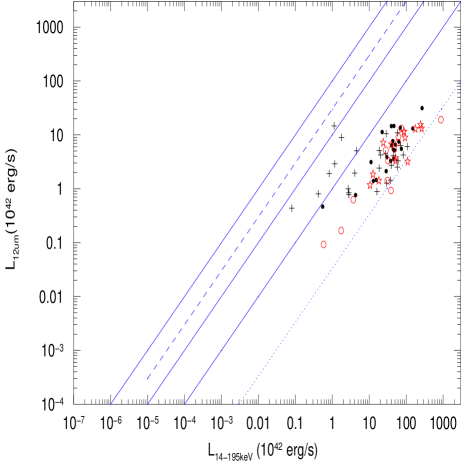
Figure 10 shows the AGN from Fig. 9 divided according to host galaxy type. AGN in peculiar or interacting hosts have not been plotted. Fig. 10 shows a tight dispersion among AGN in bulge-dominated hosts (red open symbols). 95 of the AGN in bulge-dominated hosts (25/26) in Fig. 10 vary by a factor of in . This compares well with the spread of in for of the Group 1 AGN in bulge-dominated hosts in §2.1 above. The RS test shows that the bulge- and disk-dominated hosts (black symbols) in Fig. 10 have different mean values of at confidence. This difference is strongly driven by the (6) disk-dominated Group 2 AGN (black crosses) in Fig. 10 with ergs , all of which have nuclear starbursts which dominate or are comparable in luminosity to a weak AGN or LINER. If the intrinsic IR emission from these 6 AGN is much lower than observed they would drop vertically, possibly into the same distribution in as the rest of the bulge-dominated AGN.
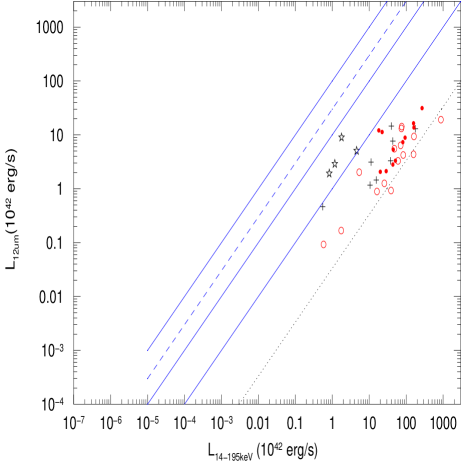
Figure 11 shows the AGN from Fig. 9 divided according to black hole mass. In order to minimize overlap due to measurement or systematic error, we divide AGN with black hole mass estimates into those (coloured black) and those (coloured red) (see also the discussion in §2.1 above). The RS test shows that all of the low mass () black holes have a different mean X-ray luminosity (and ) from the high mass () at 99.8 (99.2) confidence (or significance). This difference again appears to be driven by low mass, high , Group 2 AGN (black star symbols). We also investigated whether Group 1 and Group 2 AGN in the 22-month BAT sample, within Mpc, had host galaxies that were ringed (R,) or not. We found that there is no statistically significant difference in the X-ray luminosity or between ringed and non-ringed AGN, although there was a difference in the mean IR luminosity of the ringed and non-ringed AGN hosts at the 95 confidence level which may have been driven by outliers.
In comparing our earlier results with those from an all-sky, very hard X-ray survey, we are testing the robustness of our conclusions with respect to X-ray sky coverage and photoelectric absorption. Because of the smaller size of the BAT sample, it is not possible to restate our conclusions with the same confidence, but it is noteworthy and comforting that the BAT sample supports our conclusions (albeit at lower confidence levels). In particular: (1) there remains a tight (model-independent) dispersion in for (unobscured) AGN central engines, (2) AGN in bulge-dominated host galaxies have a narrower dispersion in than in disk-dominated hosts, (3) across all Group 1 and Group 2 AGN there is a tendency towards higher mean X-ray luminosity and therefore lower (for similar ) with increasing black hole mass and (4) there is no statistically significant difference in between ringed and non-ringed host galaxies. Our conclusions are robust at the level of sky coverage and completeness of the 22-month BAT sample.
7 Conclusions
We investigated the role of black hole mass () and host galaxy
morphology in a survey of the observed 2-10keV X-ray and 12 IR
luminosities of a heterogeneous sample of 276 mostly nearby AGN. We find
that:
(a) As black hole mass increases, the average observed IR and X-ray luminosity of the homogeneous Group 1 (Seyfert 1.X) AGN increases, maintaining a ratio in the range [1,30] over orders of magnitude in mass at a confidence level of . The luminosities for Group 1 AGN remain in the range of Eddington for each decade in mass. By contrast, among the heterogeneous, lower luminosity Group 2 AGN, the ratio decreases as black hole mass increases. This is mostly due to a combination of host galaxy contamination and photoelectric absorption.
(b) There is an average increase in IR luminosity of a factor of among Group 1 AGN in disk-dominated hosts versus bulge-dominated hosts at a confidence level . Presumably the increase is due to contamination from the unresolved galactic disk (Edelson et al, 1987). Therefore a better measure of the underlying central engine is the range of in bulge-dominated Group 1 AGN, which is at 90 confidence. This dispersion incorporates all possible variations among these Group 1 AGN, ranging from accretion mechanism and efficiency, to the opening angle of the disk and orientation to sightline, to covering fraction of absorbing material, to patchiness of the X-ray corona and even including variability. Group 1 AGN are quite remarkably identical. This strongly constrains all models of X-ray and IR production in AGN.
(c) Among the lower luminosity Group 2 AGN, those in bulge-dominated hosts tend to have substantially lower and/or compared to those in disk-dominated galaxies. Among LINERs we find much lower than in normal disk-dominated or bulge-dominated galaxies representing possible evidence for past epochs of AGN feedback in both bulge and disk-dominated hosts.
(d) Within 70Mpc, AGN in host galaxies with outer Linblad resonance rings (R,R’) are statistically indistinguishable in and from AGN in host galaxies without rings. Since these rings are hard to form and easily destroyed by perturbations (Buta & Combes, 1996; Elmegreen & Elmegreen, 2006; Bagley et al., 2009), the ringed host galaxies are unlikely to have tidally interacted with companions for a long time. Since AGN activity typically lasts a few Myrs, the most likely explanation for this is that the timescale for activity driven by processes internal to the galaxy () is much smaller than the timescale for activity driven by processes external to the galaxy (), or .
(e) ULXs in galactic nuclei could account for the observed X-ray luminosity in certain LINERs. We propose that the X-ray emission from LINER 2 nuclei without flat-spectrum, compact radio cores (Tereshima & Wilson, 2003) originates in ULXs (most likely large stellar mass black holes accreting at near Eddington luminosity). This hypothesis is testable by searching for a combination of short timescale X-ray variability, large fractional variability (the excess variance) and spectral changes in LINER 2 nuclei without these radio properties. A large estimate for the central mass in this case may simply indicate the presence of a quiescent supermassive black hole. Our proposal may be consistent with the ’retired galaxies’ of Stasińska et al. (2008) and could be tested in that context in a study of the optical spectra of host galaxies of the ’radio quiet’ LINER 2s.
(g) We tested results (a-d) above by comparing the 14-195keV luminosity and the 12 IRAS luminosity of AGN in the BAT 22-month sample (Tueller et al., 2010). We conclude that photoelectric absorption is not important in the 2-10keV band for Group 1 AGN, but it is important for many (though not all) of the Group 2 AGN and accounts for some of the ’hockey stick’ shape of the distribution in Fig. 1.
In summary, comparing the observed 2-10keV X-ray and IR luminosities of AGN with estimates of the central black hole mass and host galaxy classification can provide a powerful diagnostic tool to constrain models of AGN activity, and AGN feedback over cosmic time.
Acknowledgements
We made extensive use of the NASA/IPAC Extragalactic Database (NED), operated by the Jet Propulsion Laboratory, CalTech, under contract with NASA. BM & KESF gratefully acknowledge the support of the Department of Astrophysics of the American Museum of Natural History, PSC grant PSC-CUNY-40-397 and CUNY grant CCRI-06-22. Thanks to the referee for a useful report that helped improve the paper.
References
- Antonucci (1993) Antonucci, R.R.J., 1993, ARA&A, 31, 473
- Arnold et al. (2009) Arnold T.J., Martini P., Mulchaey J.S., Berti A. & Jeltema T.E. 2009, ApJ, accepted, astro-ph/0911.0392
- Bagley et al. (2009) Bagley M., Minchev I. & Quillen A.C., 2009, MNRAS, 395, 57
- Bournaud et al. (2007) Bournaud F., Elmegreen B.G. & Elmegreen D.M., 2007, ApJ, 670, 237
- Buta & Combes (1996) Buta R. & Combes F., 1996, Fundam. Cosm. Phys, 17, 95 (also http://nedwww.ipac.caltech.edu/level5/Rings)
- Ciotti & Ostriker (1997) Ciotti L. & Ostriker J.P., 1997, ApJ, 487, L105
- Ciotti & Ostriker (2001) Ciotti L. & Ostriker J.P., 2001, ApJ, 551, 131
- Ciotti & Ostriker (2007) Ciotti L. & Ostriker J.P., 2007, ApJ, 665, 1038
- deVaucouleurs et al (1991) deVaucouleurs G., deVaucouleurs A., Corwin H.G. Jr., Buta R., Paturel G. & Fouque P., 1991, Third Reference Catalogue of Bright Galaxies, Springer-Verlag, New York
- Dong & De Robertis (2006) Dong X.Y & De Robertis M.M., 2006, AJ, 131, 1236
- Dressler et al (1985) Dressler A. Thompson I.B. & Shectman S.A., 1985, ApJ, 288, 481
- Edelson et al (1987) Edelson R.A., Malkan, M.A. & Rieke, G.H. 1987, ApJ, 321, 233
- Elmegreen & Elmegreen (2006) Elmegreen D.M. & Elmegreen B.G., 2006, ApJ, 651, 676
- Eracelous, Hwang & Flohic (2010) Eracleous M., Hwang J.A. & Flohic H.M.L.G., 2010, ApJ, 711, 796
- Eskridge, Fabbiano & Kim (1995) Eskridge P.B., Fabbiano G. & Kim D.-W., 1995, ApJS, 97, 141
- Gabor et al. (2009) Gabor J.M. et al 2009, ApJ, 691, 705
- Gandhi et al. (2009) Gandhi P., Horst H., Smette A., Honig S., Comastri A., Gilli R., Vignali C. & Duschl W., 2009, A&A, 502, 457
- Georgakakis et al. (2008) Georgakakis A., Gerke B.F., Nandra K., Laird E.S., Coil A.L., Cooper M.C. & Newman J.A., 2008, MNRAS, 391, 183
- González-Martín (2006) González-Martín O., Masegosa J., Marquez I., Guerrero M.A. & Dultzin-Hacyan D., 2006, A&A, 460, 45
- Graham (2008) Graham A.W., 2008, PASA, 25, 167
- Grogin et al. (2005) Grogin N., et al, 2005, ApJ, 627, L97
- Gultekin et al. (2009) Gultekin K., et al, 2009, ApJ, 698, 198
- Hasan et al. (1993) Hasan H., Pfenniger D. & Norman C., 1993, ApJ, 409, 91
- Ho et al. (1997) Ho L., Fillippenko A.V. & Sargent W.L.W., 1997, ApJ, 487, 591
- Ho (1999) Ho L., 1999, ApJ, 516, 672
- Ho (2008) Ho L., 2008, ARA&A, 46, 475
- Ho (2009) Ho L., 2009, ApJ, 699, 626
- Homan et al. (2001) Homan J., Wijnands R., van der Klis M., Belloni T., van Paradijs J., Klein-Wolt M., Fender R. & Mendez M., 2001, ApJS, 132, 377
- Hopkins et al. (2005) Hopkins P.F., Hernquist L., Cox T.J., Robertson B. & Springel V., 2005, ApJS, 163, 50
- Hopkins et al. (2007) Hopkins P.F., Hernquist L., Cox T.J., Robertson B. & Krause E., 2007, ApJ, 669, 67
- Horst et al. (2009) Horst H., Duschl W., Gandhi P. & Smette A., 2009, A&A, 495, 137
- Hunt et al (1999) Hunt L.K., Malkan M.A., Moriondo G. & Salvati, M., 1999, ApJ, 510, 637
- Hunt & Malkan (1999) Hunt L.K. & Malkan M.A., 1999, ApJ, 516, 660
- Hui & Krolik (2008) Hui Y. & Krolik J.H., 2008, ApJ, 679, 1405
- Kauffmann et al. (2004) Kauffmann, G. et al. 2004, MNRAS, 353, 713
- Kauffmann et al. (2007) Kauffmann, G. et al. 2007, ApJS, 173, 357
- Kewley et al. (2006) Kewley L. J., Groves B., Kauffmann, G. & Heckman T., 2006, MNRAS, 372, 961
- Kim et al. (2008) Kim M., Ho L.C., Peng C.Y., Barth A.J., Im M., Martini P. & Nelson C.H., 2008, ApJ, 687, 767
- Kochanek et al. (2001) Kochanek C. S. et al., 2001, ApJ, 560, 566
- Kormendy & Richstone (1995) Kormendy J. & Richstone D., 1995, ARA&A, 33, 581
- Kormendy & Kennicutt (2004) Kormendy J. & Kennicutt R.C.Jr, 2004, ARA&A, 42, 603
- Krips et al. (2007) Krips M. et al., 2007, A&A, 464, 553
- Krolik (2001) Krolik J. H. 2001, ApJ, 551, 72
- Krolik (2001) Krolik J. H. 2001, Active Galactic Nuclei, Princeton University Press, Princeton, New Jersey.
- Krongold (2005) Krongold Y., Nicastro F., Elvis M., Brickhouse N.S., Mathur S. & Zezas A., 2005, ApJ, 620, 165
- Lewis & Eracleous (2006) Lewis K.T. & Eracleous, M., 2006, ApJ, 642, 711
- Maia, Machado & Willmer (2003) Maia M.A.G., Machado, R.S. & Willmer, C.N.A., 2003, ApJ, 126, 1750
- Martínez et al (2008) Martínez M.A., Del Olmo A., Coziol R. & Focardi P., 2008, ApJ, 678, L9
- Miller et al. (2004) Miller, J.M. et al. 2004, ApJ, 606, L13
- Miller & Colbert (2004) Miller M.C. & Colbert E.J.M., 2004, IJMPD, 13, 1
- Miniutti et al. (2006) Miniutti G., Ponti G., Dadina M., Cappi M., Malaguti G., Fabian A.C. & Gandhi P., 2006, MNRAS, 373, L1
- McKernan & Yaqoob (1998) McKernan B. & Yaqoob T., 1998, ApJ, 501, L29
- McKernan et al. (2007) McKernan B., Yaqoob T. & Reynolds C. S., 2007, MNRAS, 379, 1359
- McKernan et al. (2009) McKernan B., Ford, K.E.S., Chang, N. & Reynolds C. S., 2009, MNRAS, 349, 491
- McKernan et al. (2010) McKernan B., Maller A.H. & Ford, K.E.S., 2010, ApJL, submitted
- Oosterloo et al. (2007) Oosterloo T.A., Morganti R., Sadler E.M., van der Hulst T. & Serra P., 2007, A&A, 465, 787
- Pierce et al. (2007) Pierce C.M. et al. 2007, ApJ, 660, L19
- Peterson (1993) Peterson B. M. 1993, PASP, 105, 247
- Peterson et al. (2004) Peterson B. M. et al. 2004, ApJ, 613, 682
- Portegies-Zwart et al. (2006) Portegies-Zwart S. F., Baumgardt H., McMillan S.L.W., Makino J., Hut P., Ebisuzaki T. 2006, ApJ, 641, 319
- Ptak (2000) Ptak A. 2000, astro-ph/0008459. Also http://nedwww.ipac.caltech.edu/level5/Ptak/frames.html
- Rossi et al. (2005) Rossi S., Homan, J., Miller, J.M. & Belloni, T., 2005, MNRAS, 360, 763
- Sanders et al. (1988) Sanders D.B., Soifer, B.T., Elias, J.H.,Madore, B.F., Matthews, K., Neugebauer,G. & Scoville, N.Z., 1988, ApJ, 325, 74
- Satyapal et al. (2004) Satyapal S., Sambruna R.M. & Dudik, R.P., 2004, A&A, 414, 825
- Satyapal et al. (2005) Satyapal S., Dudik, R.P., O’Halloran, B. & Gliozzi, M., 2005, ApJ, 633, 86
- Sijacki et al. (2007) Sijacki D., Springel, V., di Matteo, T. & Hernquist, L., 2007, MNRAS, 380, 877
- Shankar et al. (2009) Shankar F., Weinberg, D.H. & Mirala-Escude, J., 2009, ApJ, 690, 20
- Shapley, Fabbiano & Eskridge (2001) Shapley A., Fabbiano G. & Eskridge P.B., 2001, ApJS, 137, 139
- Schawinski et al. (2007) Schawinski K., Thomas D., Sarzi M., Maraston C., Kaviraj S., Joo S.-J., Yi S.K. & Silk J., 2007, MNRAS, 382, 1415
- Schwarz (1984) Schwarz M. P., 1984, MNRAS, 209, 93
- Stasińska et al. (2008) Stasińska G., Vale Asari N., Cid Fernandes R., Gomes J.M., Schlickmann M., Mateus A., Schoenell W. & Sodré L. Jr., 2008, MNRAS, 391, L29
- Strohmayer & Mushotzky (2003) Strohmayer, T.E. & Mushotzky R.F., 2003, ApJ, 586, L61
- Tang et al. (2008) Tang Y.-W., Kuo C.-Y., Lim, J. & Ho P.T.P., 2008, ApJ, 679, 1094
- Temi,Brighenti & Mathews (2008) Temi P., Brighenti F. & Mathews W.G., 2008, ApJ, 672, 244
- Tueller et al. (2010) Tueller J. et al., 2010, ApJSS, 186, 378
- Turner & Miller (2009) Turner T. J. & Miller L., 2009, AR&ARv, 17, 47
- Tereshima & Wilson (2003) Tereshima Y. & Wilson A.S., 2003, ApJ, 583, 145
- Urry & Padovani (1995) Urry M.C. & Padovani P., 1995, PASP, 107, 803
- Veilleux et al. (2009) Veilleux S. et al., 2009, ApJS, 182, 628
- Véron-Cetty & Véron (2006) Tereshima, Y. & Wilson, A.S., 2003, ApJ, 583, 145
- Weaver et al. (2002) Weaver K.A., Heckman T.M., Strickland D.K. & Dahlem M., 2002, ApJ, 576, L19
- Winter et al. (2006) Winter L. M., Mushotzky R.F. & Reynolds C.S., 2006, ApJ, 649, 730
- Winter et al. (2009) Winter L. M., Mushotzky R.F., Reynolds C.S. & Tueller J., 2009, ApJ, 690, 1322
- Younger et al. (2008) Younger J. D., Hopkins P.F., Cox T.J., Hernquist L., 2008, ApJ, 686, 815
- Yuan et al. (2002) Yuan F., Markoff S., Falcke H. & Biermann P. L., 2002, A&A, 391, 139
- Yuan et al. (2009) Yuan F., Yu Z., Ho L.C., 2009, ApJ, 703, 1034