RXTE observations of the 1A 111861 in an outburst, and the discovery of a cyclotron line.
We present the analysis of RXTE monitoring data obtained during the January 2009 outburst of the hard X-ray transient 1A 111861. Using these observations the broadband (3.5–120 keV) spectrum of the source was measured for the first time ever. We have found that the broadband continuum spectrum of the source is similar to other accreting pulsars and is well described by several conventionally used phenomenological models. We have discovered that regardless of the applied continuum model, a prominent broad absorption feature at 55 keV is observed. We interpret this feature as a cyclotron resonance scattering feature (CRSF). The observed CRSF energy is one of the highest known and corresponds to a magnetic field of B G in the scattering region. Our data also indicate the presence of an iron emission line presence that has not been previously reported for 1A 111861. Timing properties of the source, including a strong spin-up, were found to be similar to those observed by CGRO/BATSE during the previous outburst, but the broadband capabilities of RXTE reveal a more complicated energy dependency of the pulse-profile.
Key Words.:
pulsars: individual: 1A 111861 – stars: neutron – stars: binaries1 Introduction
The hard X-ray transient 1A 111861 was first discovered during an outburst in 1974 by the Ariel-5 satellite (Eyles et al. 1975). The outburst lasted for 10 days and no flux could be observed afterwards. Pulsations with a period of 405.6 s were observed by Ives et al. (1975) and were initially interpreted as the orbital period of two compact objects. It was suggested by Fabian et al. (1975) that the observed period was due to a slow rotation of the neutron star. The optical counterpart was identified as the Be-star He 3640/Wray 793 by Chevalier & Ilovaisky (1975) and classified as an O9.5IV-Ve star with strong Balmer emission lines and an extended envelope by Janot-Pacheco et al. (1981). The distance was estimated to be kpc (Janot-Pacheco et al. 1981). The classification and distance was confirmed by Coe & Payne (1985) by UV observations of the source. The X-ray spectrum of the pulsar was fitted with a power law with a photon index of , with a possible spectral softening to during the peak of the outburst (significant at confidence level).
A second outburst occurred in 1992 and was observed by CGRO/BATSE (Coe et al. 1994). The measured peak pulsed flux was mCrab for the 20–100 keV energy range, similar to the 1974 outburst (Coe et al. 1994; Maraschi et al. 1976). It was followed by a period of elevated emission days after the main outburst. This lasted for days (see Coe et al. 1994, Fig.1). Pulsations with a period of 406.5 s were detected up to 100 keV and the pulse profile showed a single, broad peak, asymmetric at lower (20–40 keV) energies. A spin-up of 0.016 s/day was observed during the decay of the outburst. The pulsed spectrum was described with a single-temperature optically-thin, thermal bremsstrahlung model with a temperature of () keV for the main outburst and () keV during the elevated emission. Multi-wavelength observations revealed a strong correlation between the equivalent width and the X-ray flux, which allowed Coe et al. (1994) to conclude that expansion of the circumstellar disk of the optical companion was mainly responsible for the increased X-ray activity. The periastron passage would then trigger an outburst if enough matter had accumulated in the system. This conclusion was supported by the pulsations with a period of s, which were also detected in quiescence (Rutledge et al. 2007).
The source remained in quiescence until 2009 January 4, when a third outburst was detected by Swift (Mangano et al. 2009). Pointed observations with Swift/XRT allowed the detection of pulsations with a period of s reported later by Mangano (2009). The complete outburst was regularly monitored with RXTE. INTEGRAL observed the source after the main outburst and observed flaring activity days after the main burst (Leyder et al. 2009). Suzaku observed 1A 111861 twice, once during the peak of the outburst and also days later when the flux returned to its previous level (S. Suchy, in preparation).
We report here on the monitoring observations by RXTE. A timing analysis to determine the pulse period of the source and the rate of the observed strong spin-up was carried out. Pulse phase averaged spectral analysis revealed an absorption feature at keV, confirmed independently with Suzaku (S. Suchy, in preparation). We interpret this feature as a cyclotron resonance scattering feature (CRSF), which is observed for the first time in this source.
2 Observations
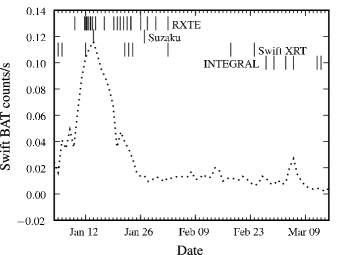
The outburst was observed by multiple X-ray missions. The source light-curve as observed by Swift/BAT with marked observation times by various satellites is presented in Fig.1. The source flux peaked on 2009 January 14, (Swift/BAT countrate 0.12 counts/s corresponding to mCrab in the 15–50 keV energy range) and slowly decreased afterwards. The source was regularly monitored with RXTE between January 10 and 2009 February 4, with a total exposure of 86 ks (PCA) and dead-time-corrected live time of 29 ks (HEXTE-B). The data from the HEXTE-A detector were not used as it was not rocking during the entire observation and the background could not be properly estimated. The data were reduced with the HEASOFT version 6.8 and a set of calibration files version 20091202. The spectral modeling was performed with the XSPEC package version 12.5.1n. The energy range 3.5–25 keV was used for the PCA and 18–120 keV for the HEXTE spectra. Based on an analysis of recent Crab observations performed during the same time frame (2008 December 16, – 2009 March 11, proposal ID P94802), a systematic of 0.5% was determined for the PCA data. No systematic error was required for the HEXTE data.
3 Timing analysis
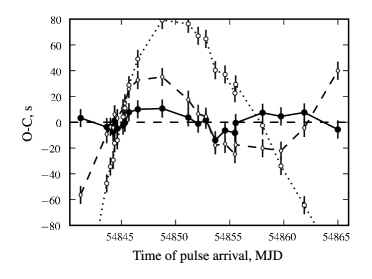
To determine the pulse period of 1A 111861 the PCA light-curve covering the complete observation in the 3–50 keV energy range was used. We searched for the pulse period and pulse period derivative using the phase connection technique (Staubert et al. 2009). Our best-fit results give =407.719(9) s, , at a folding epoch of MJD 54841.62 (the uncertainties given in parenthesis are at confidence level and refer to the last digit given). The best-fit residuals for pulse arrival times are presented in Fig. 2. Note that the obtained parameters characterize the pulse period evolution during the RXTE observations only and are not consistent with the pulse period value provided by Mangano (2009). This inconsistence is anticipated, because the luminosity and hence the accretion rate were significantly higher during the RXTE observations. The spin-up rate of the neutron star depends on the accretion rate, and therefore extrapolating the timing solution obtained close to the peak of the outburst (with a stronger spin-up) to the beginning of the outburst (where the spin-up rate is expected to be significantly lower) gives a longer pulse period than can be directly measured at the time. Note also that our solution does not account for the Doppler delays caused by orbital motion, because the parameters of the orbit are unknown and our data do not allow us to find an unambiguous solution for the orbit. The estimated value for an orbital period from “pulse period”–“orbital period” diagram Corbet (1986) lies in the 400–800 d range, which is much longer than the span of our data. The intrinsic spin-period evolution is expected to be complicated, so it is difficult to separate it from the effects of the orbital motion. Moreover, Coe et al. (1994) suggested that the orbit may be almost circular, and the outbursts may occur at any orbital phase, so a possible orbital period value derived from the comparison of outburst times is also potentially ambiguous.
Both the spin-up rate s d-1 and flux are somewhat higher (by a factor of 2–3) than reported by Coe et al. (1994) for the previous outburst observed with CGRO/BATSE. The stronger spin-up measured for the current outburst is likely caused by the higher flux and consequently higher accretion rate (although it is difficult to directly compare BAT and BATSE fluxes, because BATSE measured only pulsed flux and the energy ranges are slightly different). A potential difference in the orbital phase during the two observations may also be responsible for the difference in the observed spin-up rate.

A set of pulse profiles in several energy ranges was constructed with the determined period. The pulse profile significantly changes with energy as shown in Fig. 3. At energies below 10 keV the pulse profile has two peaks. The secondary peak amplitude decreases towards higher energies, disappearing above 10 keV. A shoulder appears on the other side of the main peak at about the same energy. The pulse profile becomes single peaked and gradually more symmetric and narrow at higher energies. A similar behavior was observed previously with CGRO/BATSE (Coe et al. 1994). The pulse fraction, defined as increases with energy in a similar way to other accreting pulsars, except for a drop at around 8 keV, where the second peak disappears (see Fig.3).
4 Spectral analysis
| Parameter | FDCUT | NPEX | CompTTfix23 | CompTT | ||
|---|---|---|---|---|---|---|
| (e)𝑒(e)(e)𝑒(e)footnotemark: | ||||||
| (b)𝑏(b)(b)𝑏(b)footnotemark: | 22.76(a)𝑎(a)(a)𝑎(a)footnotemark: | 22.76(a)𝑎(a)(a)𝑎(a)footnotemark: | 22.76(a)𝑎(a)(a)𝑎(a)footnotemark: | |||
| (b)𝑏(b)(b)𝑏(b)footnotemark: | 1.8(a)𝑎(a)(a)𝑎(a)footnotemark: | 1.8(a)𝑎(a)(a)𝑎(a)footnotemark: | 1.8(a)𝑎(a)(a)𝑎(a)footnotemark: | |||
| (b)𝑏(b)(b)𝑏(b)footnotemark: | ||||||
| (b)𝑏(b)(b)𝑏(b)footnotemark: | ||||||
| (b)𝑏(b)(b)𝑏(b)footnotemark: | ||||||
| (b)𝑏(b)(b)𝑏(b)footnotemark: | (c)𝑐(c)(c)𝑐(c)footnotemark: | (b)𝑏(b)(b)𝑏(b)footnotemark: | ||||
| (b)𝑏(b)(b)𝑏(b)footnotemark: | ||||||
| (b)𝑏(b)(b)𝑏(b)footnotemark: | ||||||
| (b)𝑏(b)(b)𝑏(b)footnotemark: | ||||||
| (d)𝑑(d)(d)𝑑(d)footnotemark: | ||||||
| (d)𝑑(d)(d)𝑑(d)footnotemark: | ||||||
| (c)𝑐(c)(c)𝑐(c)footnotemark: | ||||||
| 1.04/83 | 0.85/83 | 1.08/84 | 0.72/82 |
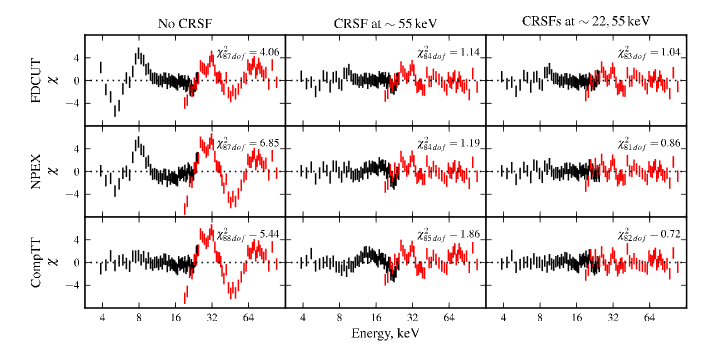
The longest observations were obtained during the maximum of the outburst, accordingly we focused on this data for the spectral analysis (observations 94032-04-02-03 to 94032-04-02-10). The spectra of 1A 111861 in different energy ranges were previously described by power law and bremsstrahlung models (Maraschi et al. 1976; Coe et al. 1994), but we found that these models do not describe our data adequately. Our results show that the broadband continuum of 1A 111861 can be well described by the FDCUT, NPEX, and CompTT models (Coburn et al. 2002; Mihara 1995; Titarchuk & Lyubarskij 1995) with qualitatively similar goodness of the fit, modified by photoelectric absorption and iron emission line at keV.
All used continuum models in their best-fit residuals show a prominent absorption feature at keV. The inclusion of an absorption line with a Gaussian optical depth profile leads to a significant reduction of in all models (see Table 1). We interpret this absorption feature as a CRSF, which is detected in the spectrum of 1A 111861 for the first time. The observed energy of the feature is one of the highest known and corresponds to a magnetic field B G (Harding & Lai 2006) in the scattering region. Preliminary phase-resolved analysis shows that the energy of the CRSF is not likely to change significantly with the pulse phase (see Fig.3).
The best-fit residuals of FDCUT and NPEX models show also a prominent emission line-like feature at keV. Similar features at different energies were reported for a number of sources (Coburn et al. 2002; Rodes-Roca et al. 2009 and references therein). Coburn et al. (2002) suggested that the employed phenomenological models for the continuum may be oversimplified for the real sources and hence may be responsible for this effect. On the other hand, Rothschild et al. (2006) suggested that the feature may be associated with the fluorescence copper line from the Be/Cu collimator of the PCA instrument. To clarify the situation a more detailed analysis of the Suzaku data is currently made and will be presented as a separate paper (S. Suchy et al, in preparation).
We found that the inclusion of an emission line with Gaussian profile may help to account for this feature and does not significantly affect other model parameters. The substantially improves for fits with FDCUT and NPEX models, accordingly we included the line in all fits with those models. The energy and the width of the line were fixed at 8.04 keV and 0.01 keV, corresponding to the copper line, as proposed by Rothschild et al. (2006).
The fit may be slightly improved by the inclusion of an additional absorption feature at keV for PCA data only. The investigation of the Crab residuals (proposal P94802) shows that a similar feature is also present in the PCA Crab spectrum (more than 99% significance with maximum likelihood ratio (MLR) and F tests (Protassov et al. 2002, p-value ). This is consistent with our 1A 111861 data, because the line is not required by HEXTE data. On the other hand, a shallow fundamental line at 22 keV (with a first harmonic at 55 keV) could be more difficult to detect due to this instrumental feature using PCA data. A comparison of our RXTE results with the Suzaku observations will help to clarify the picture (S. Suchy et al, in preparation).
5 Conclusions
For the first time since 1992 a major outburst of the Be/X-ray binary 1A 111861 was observed in 2009 January with RXTE, following the trigger of Swift/BAT. Strong pulsations with a period of 407.72 s and a spin up of s s-1 were detected. A similar temporal behavior was observed with CGRO/BATSE during the previous outburst. A broadband spectrum of the source was obtained for a first time, and an absorption feature at keV, interpreted as a CRSF was detected. The inclusion of the feature significantly improves fit results with all applied continuum models and its energy does not depend significantly on the model used. More detailed spectral analysis is ongoing and the results will be published elsewhere.
Acknowledgements.
VD thanks DLR for financial support (grant 50OR0702).References
- Chevalier & Ilovaisky (1975) Chevalier, C. & Ilovaisky, S. A. 1975, IAU Circ., 2778, 1
- Coburn et al. (2002) Coburn, W., Heindl, W. A., Rothschild, R. E., et al. 2002, ApJ, 580, 394
- Coe & Payne (1985) Coe, M. J. & Payne, B. J. 1985, A&AS, 109, 175
- Coe et al. (1994) Coe, M. J., Roche, P., Everall, C., et al. 1994, A&A, 289, 784
- Corbet (1986) Corbet, R. H. D. 1986, MNRAS, 220, 1047
- Eyles et al. (1975) Eyles, C. J., Skinner, G. K., Willmore, A. P., & Rosenberg, F. D. 1975, Nature, 254, 577
- Fabian et al. (1975) Fabian, A. C., Pringle, J. E., & Webbink, R. F. 1975, Nature, 255, 208
- Harding & Lai (2006) Harding, A. K. & Lai, D. 2006, Reports on Progress in Physics, 69, 2631
- Ives et al. (1975) Ives, J. C., Sanford, P. W., & Burnell, S. J. B. 1975, Nature, 254, 578
- Janot-Pacheco et al. (1981) Janot-Pacheco, E., Ilovaisky, S. A., & Chevalier, C. 1981, A&A, 99, 274
- Leyder et al. (2009) Leyder, J., Walter, R., & Lubinski, P. 2009, ATEL, 1949, 1
- Mangano (2009) Mangano, V. 2009, ATEL, 1896, 1
- Mangano et al. (2009) Mangano, V., Baumgartner, W. H., Gehrels, N., et al. 2009, GCN, 8777, 1
- Maraschi et al. (1976) Maraschi, L., Huckle, H. E., Ives, J. C., & Sanford, P. W. 1976, Nature, 263, 34
- Mihara (1995) Mihara, T. 1995, PhD thesis, , Dept. of Physics, Univ. of Tokyo (M95), (1995)
- Protassov et al. (2002) Protassov, R., van Dyk, D. A., Connors, A., Kashyap, V. L., & Siemiginowska, A. 2002, ApJ, 571, 545
- Rodes-Roca et al. (2009) Rodes-Roca, J. J., Torrejón, J. M., Kreykenbohm, I., et al. 2009, A&A, 508, 395
- Rothschild et al. (2006) Rothschild, R. E., Wilms, J., Tomsick, J., et al. 2006, ApJ, 641, 801
- Rutledge et al. (2007) Rutledge, R. E., Bildsten, L., Brown, E. F., et al. 2007, ApJ, 658, 514
- Staubert et al. (2009) Staubert, R., Klochkov, D., & Wilms, J. 2009, A&A, 500, 883
- Titarchuk & Lyubarskij (1995) Titarchuk, L. & Lyubarskij, Y. 1995, ApJ, 450, 876