Ignition column depths of helium-rich thermonuclear bursts from 4U 1728-34
Abstract
We analysed thermonuclear (type-I) X-ray bursts observed from the low-mass X-ray binary 4U 172834 by RXTE, Chandra and INTEGRAL. We compared the variation in burst energy and recurrence times as a function of accretion rate with the predictions of a numerical ignition model including a treatment of the heating and cooling in the crust. We found that the measured burst ignition column depths are significantly below the theoretically predicted values, regardless of the assumed thermal structure of the neutron star interior. While it is possible that the accretion rate measured by Chandra is underestimated, due to additional persistent spectral components outside the sensitivity band, the required correction factor is typically 3.6 and as high as 6, which is implausible. Furthermore, such underestimation is even more unlikely for RXTE and INTEGRAL, which have much broader bandpasses. Possible explanations for the observed discrepancy include shear-triggered mixing of the accreted helium to larger column depths, resulting in earlier ignition, or the fractional covering of the accreted fuel on the neutron star surface.
Subject headings:
X-rays: bursts — X-rays: individual (4U 172834) — stars: neutron — X-rays: stars1. Introduction
Thermonuclear (type I) bursts are triggered by unstable nuclear burning of the material accreted onto the neutron star (NS) surface in low-mass X-ray binary (LMXB) systems (e.g., Lewin et al., 1995; Strohmayer & Bildsten, 2006). The basic theory of type I bursts was outlined shortly after their detection (e.g., Woosley & Taam, 1976; Joss, 1977; Maraschi & Cavaliere, 1977; Lamb & Lamb, 1978). According to these models, the accreted material, which usually consists of hydrogen and helium, accumulates as a thin layer on the NS surface (typically on time-scales of hours to days), and when the pressure and temperature at its base reach critical values, the fuel will ignite and burn unstably until exhausted.
Further observations (see Galloway et al., 2008, for a review) and subsequent modeling (Fujimoto et al., 1981, 1987; Fushiki & Lamb, 1987; Bildsten, 1998; Narayan & Heyl, 2003; Woosley et al., 2004; Cooper & Narayan, 2006) showed in detail how the burst properties depend on the accretion rate, composition of the accreted material (the H/He fraction and CNO metallicity), and internal properties of the neutron star. For example, for systems accreting mixed H/He, the heat generated from hydrogen burning is usually a dominant factor for ignition. On the other hand, in evolved systems in which little or no H is present but the fuel consist mainly of He, the heat required for the burst ignition must come entirely from the electron captures and pycnonuclear reactions in the NS crust. Comparisons of He-bursts with ignition models thus offer a powerful probe of the physical conditions in the neutron star crust, below the fuel layer, and the cooling processes in the core (Fujimoto et al., 1987; Cumming et al., 2006).
The best-known He-accretor is a low-mass binary system 4U 182030, in which the neutron star orbits its companion once every 11.4 minutes (Stella et al., 1987). Such a tiny orbit cannot accommodate a H-rich companion, and the mass donor is likely to be a He-rich white dwarf (King & Watson, 1986). 4U 182030 is in a bursting mode for around 40 days after switching to the low state (Chou & Grindlay, 2001), while during the rest of its 176-day accretion cycle (Priedhorsky & Terrell, 1984) the source does not exhibit bursts (Stella et al., 1984, and references therein). In a 20-hour EXOSAT observation during the low state, Haberl et al. (1987) observed nearly regular bursting from 4U 182030, detecting seven bursts with a mean recurrence time of hours and persistent luminosity of ergs s-1 between the bursts.
The burst ignition conditions for this source were modelled by Cumming (2003), who compared the predicted burst properties with the measurements of Haberl et al. (1987). Cumming (2003) presented models for pure He fuel, but also estimated the effect of adding a small amount of hydrogen – 535% by mass – as predicted by some stellar evolutionary models (e.g., Podsiadlowski et al., 2002). The amount of energy released in pycnonuclear and electron capture reactions that escapes from the surface () is a free parameter in this model, which also assumes the time-averaged rather than instantaneous accretion rate to set the crust temperature profile, because the thermal time in the crust is much longer than the 176-day accretion cycle. Cumming (2003) found a good agreement between the model, which assumes a mixed fuel (10% of hydrogen), and the data, providing that MeV/nucleon (Brown, 2000) and the time-averaged accretion rate is 2 times larger than the measured rate. However, for a fuel consisting entirely of He, the required was 0.4 MeV/nucleon and the required time-averaged accretion rate was 4–5 times larger. Self-consistent results were obtained with improved burst ignition models, in which the flux flowing outwards was calculated directly from the neutron star crust and core neutrino emissivity and the core thermal conductivity (Cumming et al., 2006). Cumming et al. (2006) concluded that, in order to produce the bursts separated by 3 hours, the core neutrino emissivity must be very inefficient (e.g., suppresed modified Urca process) and the accretion rate must be 2 times larger than that inferred from the X-ray luminosity.
Although all previous studies of He-bursts have focused on 4U 182030, the intermittent occurrence of the bursts makes triggering of burst observations extremely difficult, and only a few recurrence times and corresponding accretion rate estimates are available. A much more suitable candidate for such studies is the source 4U 172834, which consistently exhibits frequent bursts characteristic of pure He fuel. There is a total of 106 bursts from this source in the RXTE burst catalogue (Galloway et al., 2008). The values (200), short rise times and decay time scales suggest a He-rich fuel. The persistent flux during RXTE observations was erg cm-2 s-1 while the burst recurrence times were on average 4 hours. Evidence for a short orbital period of 10.77 min has been detected recently in the analysis of Chandra observations (Galloway et al. 2010; in prep.), supporting the long-suspected identification of 4U 172834 as an ultracompact LMXB. The source is probably accreting pure He from its evolved companion and is practically a twin of 4U 182030, except for the much more frequent and reliable bursting. 4U 172834 has also been observed extensively by INTEGRAL (Falanga et al., 2006; Chelovekov et al., 2006). Falanga et al. (2006) detected 36 type I bursts during the transition from hard to soft state, where the source luminosity increased from 212% of the Eddington luminosity.
In this paper we present analysis of new Chandra observations of 4U 172834. We measured the recurrence times and corresponding accretion rates of the 25 bursts detected during a 240-ks HETGS exposure. The detailed spectral analysis and the detection of the orbital period and radius expansion bursts are reported in the companion paper (Galloway et al. 2010), while we present the comparison of the observed burst properties with a new ignition model. In Section 2 we present the data and describe our analysis of the Chandra observations. The measured burst properties, which include the accretion rates (estimated from the persistent flux), burst fluences, values and burst recurrence times are presented in Section 3. The new burst ignition model is described in Section 4, while Section 5 shows the comparison of the model and data. Possible explanations of the discrepancy between the data and our ignition model are discussed in Section 6. Finally, our conclusions are summarized in Section 7.
2. Observations and analysis
2.1. Chandra observations
4U 172834 was observed between 2006 July 1723 with the HETGS abroad Chandra. The observations 6568, 6567 and 7371 were made in the continuous clocking (CC) mode with exposures of 49.5, 151.8 and 39.7 ks, respectively. A total of 25 type I bursts, separated by 1.83.9 hours, were detected in these observations (for the light curve and more details on the Chandra observations see Galloway et al. 2010). Galloway et al. (2010) also report on the detection of a period of 10.77 min in the low-energy persistent intensity (which they interpret as arising from orbital modulation) and describe a search for line emission and photoionization edges in the persistent spectra between the four radius expansion bursts detected in observation 6568. In this paper we focus on measuring the pre-burst accretion rates and corresponding burst recurrence times, and their comparison with our new ignition models.
The first order HEG and MEG persistent spectra were extracted using time intervals starting 150 seconds after the previous burst, and ending 50 seconds before the burst peak, to exclude any possible burst emission. These spectra, which contained approximately 2000 to 3000 total counts, were binned to a minimum of 100 counts per bin, and fitted simultaneously for each interval. The combination of the CC mode (selected to minimize photon pileup) and grating observations is non-standard, making the correct background subtraction possible only for the brightest sources (e.g., Marshall et al., 2001). Hence, we restricted our spectral fitting to the 1.56 keV band, in which the contribution from the background is minimal. The response matrices were produced by the CIAO task mkgrmf, while the task fullgarfs was used to produce the auxiliary files, which were used for fitting both the persistent and time-resolved burst spectra.
Since the Chandra energy band is relatively narrow, to help us select the appropriate spectral model, we examined spectral fitting results of previous observations made in significantly broader bands. The source was in a soft state during the broadband (0.1100 keV) BeppoSAX observation by Di Salvo et al. (2000). The best-fit model consisted of two components, a 2-keV blackbody (with an emitting region comparable to the expected radius of the neutron star), and a Comptonized component (comptt model in xspec) with seed photon temperature of 1.5 keV, electron temperature of 10 keV and optical depth of 5. Di Salvo et al. (2000) also detected two broad emission lines at 6.7 keV and 1.6 keV, probably emitted in the ionized corona. D’Aí et al. (2006) reported on the analysis of the simultaneous RXTE and Chandra observations of 4U 172834. The broadband (1.235 keV) spectrum was best described by a blackbody (0.6 keV) and a Comptonized component (1.5 keV; 7 keV; 5), but no emission lines were detected. Instead, D’Aí et al. (2006) have found absorption edges at 7 keV and 9 keV associated with Fei and Fexxv. During several INTEGRAL observations (in the 3200 keV band), the source was found undergoing the transition from the intermediate/hard to soft state with the electron temperatures of the Comptonizing plasma decreasing from 35 keV to 3 keV (Falanga et al., 2006).
Following these results, we selected a single-component111 A blackbody component may also be present when the source is in the soft state, in which case the estimated bolometric flux would be reduced (by at most % for our data). By including a blackbody component the contribution from the comptt component is reduced, and the latter contributes more to the total bolometric flux, particularly at high energies. absorbed comptt model in XSPEC to fit the HEG and MEG data. We then used the spectral results from previous observations to fix some of the model parameters as the rather limited Chandra band was not sufficient to constrain them. First, we adjusted and fixed the seed photon energy to 0.4 keV for the first four bursts detected in the observation 6568, 0.5 keV for the 18 bursts in 6567 and 0.3 keV in the last three bursts detected in the observation 7371. These values were selected so that the corresponding absorption column was consistent with the best-fit value found from the burst spectra ( cm-2, see below), although we actually found that the measured fluxes were not very sensitive to this parameter. Since the Chandra band was well below the spectral turnover (10–20 keV, for 3 keV), we could select and fix a wide range of electron temperatures and get statistically acceptable fits. We selected the temperature of 35 keV to represent a hard spectral state, and then repeated the fitting with a low (3 keV) plasma temperature typical of a soft state. Since the narrow Chandra band was not sufficient to discriminate between these spectral states, we used both models to estimate the hard and soft-state persistent X-ray fluxes for each burst, from which we calculated the corresponding accretion rates.


To measure the neutral hydrogen column density, we first produced the peak spectra of all bursts using only the data around the peak (between 0.5 s before the peak and 1.5 s after the peak) and combined these spectra for each observation. Since Galloway et al. (2010) showed that the burst profiles in each observation have approximately the same shape (see their Fig. 3), we combined the peak spectra of the four bursts from the observation 6568, eighteen bursts from 6567 and three bursts from 7273. We subtracted the background (persistent) emission from these combined spectra and fitted them with absorbed blackbody models. We obtained good fits for each of the three observations with an cm-2 in the first observation, cm-2 in the second, and cm-2 during the last three bursts. We then calculated the weighted mean and variance of cm-2.
Finally, we produced time-resolved spectra for each individual burst by applying an adaptive time-binning, i.e., by accumulating the counts until a minimum of approximately 800 counts (total HEG and MEG first order) in each bin. We then fitted the HEG and MEG spectra of each bin with an absorbed blackbody model (with the fixed at the mean value of cm-2) and used the model parameters to calculate the corresponding bolometric flux. The fluence of each burst was then calculated by summing the measured fluxes over the burst. As one example, in Fig. 1 we show the best-fit blackbody model parameters and fluxes for time-resolved spectra of two bursts from our sample. Since the absorption column measurements from persistent spectra in previous observations range from cm-2, we estimate the maximum possible systematic error of %. We also note that for the RXTE bursts selected for our analysis (Section 2.2) Galloway et al. (2008) performed the spectral fitting with the absorption column fixed at the mean value for each burst. For the 11 RXTE bursts included here, this value is in the range cm-2.
2.2. RXTE and INTEGRAL bursts
From the total of 106 bursts observed from this source by RXTE and re-analysed by Galloway et al. (2008), we selected 11 bursts for which the recurrence times could be reliably measured. We used the catalogued values of the persistent X-ray luminosities (measured in the 2.5-25 keV band and multiplied by the bolometric correction factor of 1.38; Galloway et al., 2008), burst fluences and parameters.
4U 172834 was in the field of view of JEM-X and ISGRI cameras during several thousand short INTEGRAL observations of the Galactic centre region made in 2003 and 2004. A total of 36 bursts detected in the combined INTEGRAL observations were catalogued by Falanga et al. (2006), while a complete analysis of all available INTEGRAL IBIS observations by Chelovekov et al. (2006) revealed 61 bursts from the source. The burst recurrence times, however, could only be accurately measured if the source was in the JEM-X field of view continuously between two subsequent bursts (M. Falanga, private communication), which we could verify for 5 bursts. These 5 bursts, which we include in our analysis, are listed in the INTEGRAL burst catalogue by Falanga et al. (2006). Falanga et al. (2006) measured the X-ray luminosities (in the 3200 keV band) and used them to estimate the accretion rates. The burst fluences were measured from the time-resolved burst spectra with a typical bin size of 12 seconds.
3. Measured burst properties
3.1. The persistent luminosity and accretion rates
Using the best-fit models of the persistent pre-burst spectra, we measured the absorbed persistent fluxes in the 1.56 keV band to be in the range ergs cm-2 s-1, and estimated the corresponding intrinsic bolometric luminosities222assuming a distance of 5.2 kpc measured from the photospheric radius expansion bursts in RXTE data by Galloway et al. (2008). ( ergs s-1 for the =3 keV, and ergs s-1 for the =35 keV), from which we calculated the pre-burst mass accretion rates. The range of the estimated bolometric luminosities is approximately 10% smaller than that of the fluxes in the 1.5-6 keV band, due to the different choice of for the three observations (0.3, 0.4 and 0.5 keV for observation 7371, 6568 and 6567, respectively; see Section 2.1). Simple phenomenological (power-law) fits indicate that the persistent spectra actually become slightly harder with increasing flux, suggesting that the range in bolometric flux should be larger rather than smaller. However, these effects are relatively minor compared to the uncertainty in the electron temperature .
The accretion rates calculated from the persistent flux, assuming Comptonization in the high temperature plasma (35 keV), would imply almost one order of magnitude larger parameters (Section 3.2) than usually measured from this source. In addition, since the relatively high persistent flux during the Chandra observations suggests a soft spectral state, we conclude that the accretion rates estimated from the 3-keV X-ray luminosities are more realistic, and we will assume these values throughout.
The accretion rates are expressed in units of the Eddington limit. The Eddington accretion rate for pure helium fuel is assumed to be g s-1 in the distant observer’s frame, which corresponds to the Eddington luminosity of ergs s-1 (e.g., Narayan & Heyl, 2003). Although the ultra-compact systems are thought to accrete almost pure helium (i.e., the fraction of the accreted hydrogen ), some stellar evolution models predict that the hydrogen fraction can be as high as 20% (Podsiadlowski et al., 2002). To account for this possibility, we compared all our calculations with the case , where we used the corresponding Eddington accretion rate of g s-1 ( ergs s-1; Narayan & Heyl, 2003).
The persistent accretion rate during the first two Chandra observations was nearly constant at around 0.066 of the Eddington limit, decreasing to 0.038 during the last pointing, when the last three bursts occurred. The persistent accretion rate during the five bursts detected with INTEGRAL and eleven RXTE bursts varied between approximately 0.02 and 0.08 of the Eddington accretion rate ().
3.2. Burst fluences and parameters
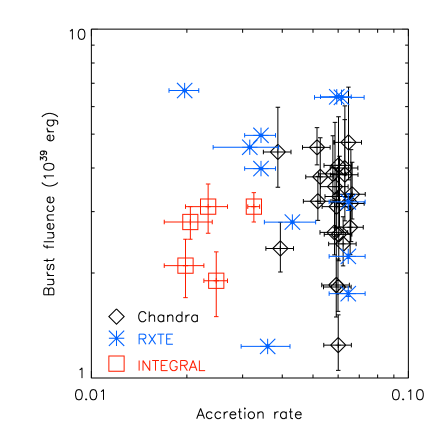
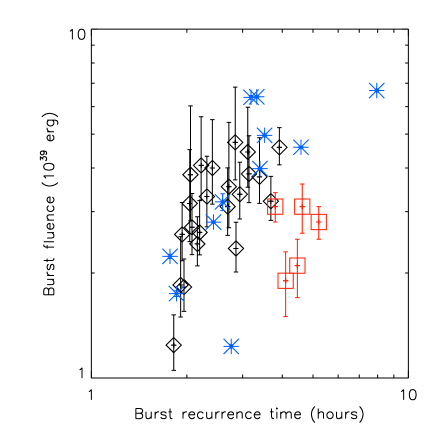
Fig. 2 shows the burst fluences, measured from the time-resolved burst spectra (Section 2), and plotted against the burst accretion rate (left) and recurrence time (right). The bursts are weak ( erg) and we see a sharp increase of the burst energy with burst recurrence time, but only for short recurrence times ( hours).
The parameter is usually used to compare the gravitational energy () produced by accretion and the energy released by nuclear burning () during the burst (; where is the surface gravitational redshift and is the speed of light; e.g., Fujimoto et al., 1987). The nuclear energy depends on the fuel composition and is calculated as MeV per nucleon, where the hydrogen fraction in the fuel, , is averaged over the burning layer. The formula gives an energy of 4.4 MeV per nucleon for the Solar abundance of hydrogen (), which implies333The approximate formula, , is given by Galloway et al. (2008), who omitted the redshift correction factor . , while higher values suggest a He-rich fuel. We have calculated the parameters for the Chandra bursts as , where is the persistent flux integrated over the burst recurrence time , and is the burst fluence, and found it to be in the range 105342 (the mean value 189), which implies a He-rich fuel. Consistent values are catalogued for the RXTE (91314) and INTEGRAL bursts (160240) with the mean value of 180 for the whole sample.
In addition to the parameter, from the measured burst fluences () we calculated the total mass burnt during the burst (; where is measured in the distant observer’s frame). This allows us to compare the consumed mass during the burst directly to the mass accreted since the preceding burst. According to the thin-shell instability models, the accreted mass is burnt completely during the bursts, unless there are some energy “leaks”, for example, due to stable hydrogen burning before the burst or other sources of energy loss (e.g., Fujimoto et al., 1987, and references therein).
We calculated for the pure helium fuel, and repeated the calculation for . For the Solar metallicity, this fraction of hydrogen will be completely burnt in 3 hours, via the hot CNO cycle (e.g., Cumming, 2004). Since most of the measured burst recurrence times are between 3 and 5 hours (Fig. 2), no hydrogen is left to burn unstably and the does not increase significantly for these bursts. However, if the metallicity is, for example, ten times lower (), the time needed to burn the accreted hydrogen is almost 32 hours, which means that most of the accreted hydrogen will be left to burn unstably during the burst. As a consequence, will increase up to 2.3 MeV per nucleon for bursts with short recurrence times.
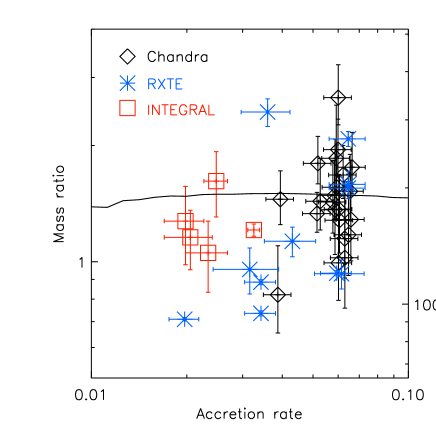
Fig. 3 shows the ratios of the accreted and burnt mass and corresponding parameters versus the measured accretion rate, assuming the fuel consists of pure helium. The accreted mass is on average 1.4 times larger than the total mass of fuel burnt during the burst. However, there is a large scatter around this value, with the fraction of the exhausted fuel of 50% or less during several bursts. We also notice several bursts with the total burnt mass that appears to exceed the accreted mass (i.e., the mass ratio ). Mass ratios greater than 2 are measured for three bursts, which also have large parameters (300). A small value of 90 was measured for the two bursts with the corresponding mass ratio of 0.7.
4. Ignition models
We use the general-relativistic global linear stability analysis of Cooper & Narayan (2005) to theoretically determine the type I X-ray burst recurrence time and value as a function of accretion rate. We assume steady spherical accretion onto a neutron star of gravitational mass and areal radius at a rate , where is the rest mass accreted per unit time as measured by an observer at infinity. We describe the accreted matter’s composition by the hydrogen mass fraction , metal mass fraction , and helium mass fraction .
We make the following two modifications to the model of Cooper & Narayan (2005). (1) Cooper & Narayan (2005) assumed the energy generated by electron captures, neutron emissions, and pycnonuclear reactions in the crust was distributed uniformly. We now follow Haensel & Zdunik (2008) and distribute the energy according to their Table A.3. (2) We updated the crust thermal conductivity according to Shternin & Yakovlev (2006) and Chugunov & Haensel (2007).
The accretion rate, accreted matter composition, and interior temperature profile together determine the recurrence time. The temperature profile is a strong function of the crust’s thermal conductivity and core’s neutrino emissivity, both of which are poorly constrained. The thermal conductivity is a decreasing function of the impurity parameter (Itoh & Kohyama, 1993; Daligault & Gupta, 2009). Although Schatz et al. (1999) found from steady-state nucleosynthesis calculations, subsequent investigations suggest should be much smaller (Schatz et al., 2003; Woosley et al., 2004; Koike et al., 2004; Horowitz et al., 2007; Horowitz et al., 2009; Shternin et al., 2007; Brown & Cumming, 2009). Also, the core neutrino emissivity, and thereby the core cooling rate, depends on the unknown ultradense matter equation of state (for reviews, see Yakovlev & Pethick, 2004; Page et al., 2006). Unless noted otherwise, we set throughout the crust and adopt a slow, suppressed core cooling model in which nucleon-nucleon bremsstrahlung processes dominate the neutrino emission (see, e.g., Table 1 of Page et al., 2006); these parameters are realistic limits on the crust thermal conductivity and core neutrino emissivity and are set to maximize the burst ignition region temperature and thereby minimize the burst recurrence time, for the closest correspondence with observations.
5. Comparison with observations
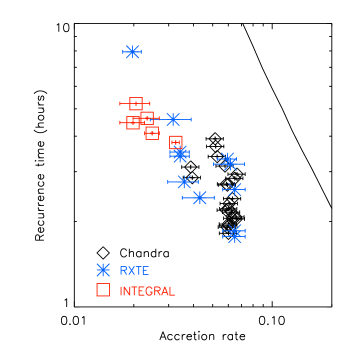
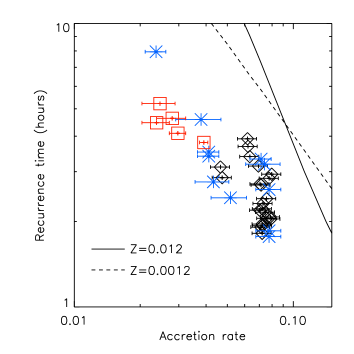
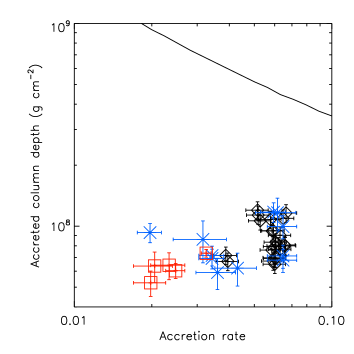
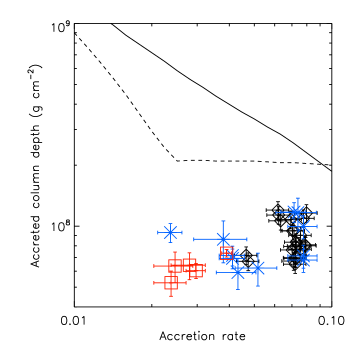
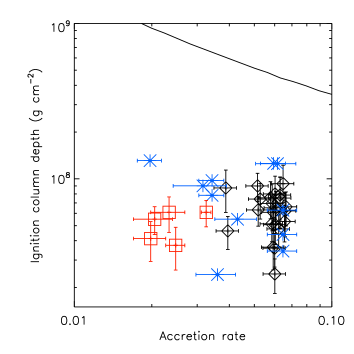
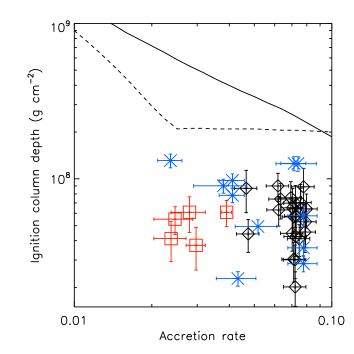
Fig. 4 (left) shows the model and the observed burst recurrence time and ignition column depths (calculated from the accreted mass and also from the mass consumed during the burst) plotted versus the mass accretion rate for Chandra, RXTE and INTEGRAL data assuming the accreted material to be pure helium. Although the selected model maximizes the outward heat flux that ignites the bursts, the comparison of the observed and theoretical burst recurrence times shows a large discrepancy. For example, for a typical accretion rate of we observe bursts separated by 34 hours, while the model predicts almost 15 hours. To match the observed burst recurrence times each of our estimated accretion rates would have to be multiplied by a correction factor in the range 2.5–6 (mean 3.6). Such a large discrepancy may suggest that the region at the base of the ignition column is significantly hotter than predicted by the model, which means either that the cooling processes in the crust and core are slower than the current theoretical lower limits, or that there is an additional heat source.
The additional heat may be supplied by burning of hydrogen, if the accreted material is a mixture of hydrogen and helium. Since the stellar evolutionary models predict that a small fraction of hydrogen might be present in evolved, ultracompact binary systems, we produced a model assuming the same core and crust cooling properties, but with the accreted material that includes around 20% of hydrogen (), which is a reasonable upper limit for an ultracompact binary. Since the hydrogen burning is affected by the CNO fraction, we produced two models, one with the Solar CNO fraction of 0.012, and the other with the CNO fraction ten times lower (Z=0.0012). We also re-calculated the Eddington accretion rate limit for the new fuel composition, and the new models are shown in Fig.4 (right). Although the discrepancy between the model and data was slightly reduced, adding 20% of hydrogen was not sufficient to match the theoretical and the observed burst recurrence times. The model with the low CNO fraction predicts shorter burst recurrence times. This is expected, since the assumed hydrogen fraction of needs more than 30 hours to burn stably when the metallicity is 10 times lower than the Solar CNO fraction (see Section 3.2). Hence, the hydrogen will burn stably for longer time and ignite later, at a larger depth and hence closer to the helium burning region444This is not the case, however for very large mass accretion rates, because the ignition of helium occurs at much lower column depths.
To estimate the “missing heat” we produced several models, which further increase the outward heat flux. These models also assume the slow cooling and low conductivity of the neutron star core and crust as before, but include additional heating. As our first attempt, we increased the total heat produced deep in the crust by electron capture and pycnonucear reactions from the current theoretical estimate of 1.9 MeV (Haensel & Zdunik, 2008) to 3.0 MeV per nucleon. Although this slightly reduced the burst recurrence times, it was not enough to match the observed values.
Recently, Brown & Cumming (2009) investigated the cooling rates of several quasi-persistent transients during the quiescence. They found that, in order to fit the cooling light curves of these sources following an outburst, an inward-directed heat flux from the shallow outer crust was required. For several sources in their sample, Brown & Cumming (2009) estimated the strength of this shallow heat source to be in the range of 0.71.1 MeV per nucleon. Although the nature of this shallow heat source is not yet clear, Brown & Cumming (2009) suggest that its strength probably depends on the accretion rate.
Motivated by this result, we included an additional shallow heat source in our model. For a strength of 0.7 MeV per nucleon, the additional heat source’s effect was larger than that from the stronger heat produced deeper in the crust: it reduced the burst recurrence time from hours to hours (for ), approximately two times longer than observed. However, regardless of the heat source’s strength, the predicted ignition depth was always g cm-2, which is well above the observed values (Fig. 4). Indeed, we find that helium burns stably for a sufficiently large assumed strength of the shallow heating. The reason is the following (see, e.g., Paczynski, 1983; Fushiki & Lamb, 1987). Increasing the heat source’s strength raises the burning layer’s temperature, which decreases the column depth at which helium burning is thermally unstable (e.g., Bildsten, 1998). However, helium must survive to that ignition depth; increasing the temperature raises the burning rate and hence decreases the helium depletion depth. If the former exceeds the latter, helium burns stably.
6. Discussion
6.1. Comparison with the ignition model
The most striking feature of the thermonuclear bursts exhibited by 4U 172834, apart from their consistently short rise and decay times, is the short recurrence times compared to the predictions of the ignition model. The simplest way to explain this discrepancy is that the measured accretion rates are underestimated, for example if additional soft or hard spectral components are present outside the instrumental bands 555Another possibility is that the assumed distance of 5.2 kpc, measured from the photospheric radius expansion bursts by Galloway et al. (2008), is underestimated. Although no other independent estimates of the distance are available for this source, we note that the assumed Eddington limit is close to the empirical critical luminosity measured by Kuulkers et al. (2003). In addition, to match the model, the distance to 4U 172834 would have to be underestimated by a factor of 2–3.. This is certainly plausible for the very narrow Chandra band, but additional hard components are not possible for the RXTE or INTEGRAL measurements, unless they occur at very high energy ( keV). Such features have not been detected in LMXBs. Low energy spectral components appear more likely, and could easily be overlooked thanks to the combination of low-energy sensitivity limits for RXTE and INTEGRAL of 2–3 keV, the restriction of the Chandra spectral fits to keV, and the strong absorption towards 4U 172834. However, we note that similar discrepancies were found for 4U 182030 (Cumming, 2003; Cumming et al., 2006), which is also well-studied and has low line-of-sight absorption ( a few times ; Miller et al. 2009). Studies of the burst recurrence time – persistent flux relationship in GS 182624 indicate that soft spectral components contributing up to 40% of the broadband persistent flux can be present (e.g., Thompson et al., 2008). However, we note that for 4U 172834 this additional flux would have to be typically 3.6 and up to 6 times larger than our measured bolometric fluxes (see Section 5), which seems implausible. Furthermore, unless the burst flux was also underestimated by a similar degree, such inflated luminosities would lead to intrinsic values that were higher by the same factor, presenting additional difficulties.
An obvious way to increase the burst ignition columns, without increasing the global accretion rate, would be to restrict the neutron star area on which the nuclear burning takes place. The idea that strong magnetic fields could confine the accreted matter to a fraction of the NS surface was first suggested by Joss & Li (1980). Ayasli & Joss (1982) later expanded on this idea (see also Bildsten & Brown, 1997; Brown & Bildsten, 1998) although the observationally-inferred dipole magnetic fields of G (e.g., Lewin et al., 1995; Psaltis & Lamb, 1999) seem to be much lower than those required for the magnetic confinement.
Recently, Lamb et al. (2009) proposed a model to explain the observed properties of the accretion-powered oscillations detected in the accreting millisecond X-ray pulsars (AMXPs). According to this model, the accreted material is channeled to the regions (spots) on the NS surface near the magnetic poles, which are close to the rotation axis (i.e., the magnetic and rotational axes are nearly aligned). Lamb et al. (2009) argue that the mechanism that produces the nearly aligned axes could significantly reduce the dipole component of the stellar magnetic field, without reducing the the field’s total strength, which could be as high as G (i.e., strong enough to confine the accreted material). Furthermore, the changes in and the inner accretion disk structure alter the size and location of the X-ray emitting spots, which explains the low (sometimes undetectable) pulse amplitudes, nearly sinusoidal waveforms and other properties of the accretion-powered oscillations from AMXPs.
The effect of the accreted mass confinement on the burst ignition needs to be modelled in detail taking into account various effects (e.g., the non-radial thermal diffusion is zero in the spherically-symmetric case but nonzero in the confinement case; see, e.g., Payne & Melatos, 2006). Here, we make a simple assumption that the ignition condition will not change significantly if the accretion is restricted to only part of the neutron star surface, and investigate if the simple area scaling would be plausible for 4U 1728-34.
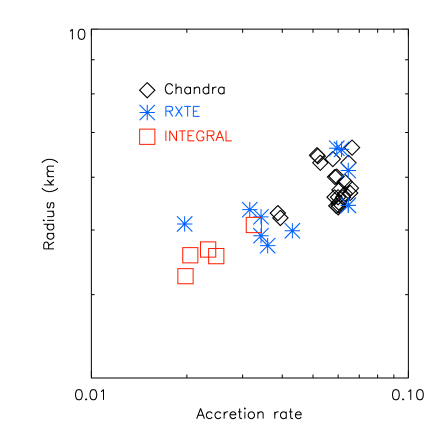
Fig. 5 (left) shows the radius of the restricted area, which would be required so that the recurrence time (i.e., the accreted column) would match our model shown on the left panels in Fig. 4. The radius of the restricted area changes from approximately 4.56 km, which seem to be consistent with the measurements of the black-body emitting regions from the time-resolved burst spectra (e.g., see Fig. 1; see also Fig. 5 in Galloway et al., 2008). Fig. 5 also suggests that the size of the restricted area may be correlated with the global accretion rate. This is predicted by the moving spot model of Lamb et al. (2009), suggesting that, perhaps, the nuclear burning in 4U 1728-34 is also concentrated to moving regions near the spin axis.
In general, a likely consequence of confinement of the nuclear burning is that strong oscillations should be observed during every burst. However, burst oscillations were detected in only six out of 11 RXTE bursts included in our sample (for more detail see Galloway et al., 2008). The absence of burst oscillations during some bursts may also be explained if the burst oscillations also arise from burning restricted to a region centered close to the spin axis and the latitude of this region varies slightly from burst to burst. Thus, the absence of strong burst oscillations during some of the bursts observed by RXTE from 4U 172834 does not necessarily rule out fuel confinement.
In addition to confining the accreted fuel to a smaller area, the area scaling would also work if we assume a neutron star with a smaller radius. In addition to accumulating the fuel over a smaller area, we also expect the additional effects (e.g., the higher gravity makes the pressure higher for a given column depth, and the higher pressure usually gives a higher burning rate, etc.). However, based on our calculation for the neutron star radius of 6 km, these additional effects are not significant.
6.2. The observed variations in the parameter
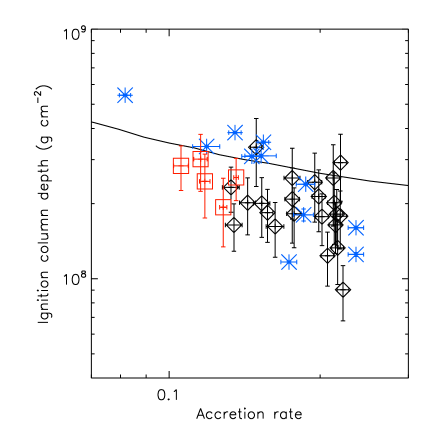
Here we address the problem of the large scatter of the values measured for 4U 1728-34 (see Figs. 3 and 4). The right panel of Fig. 5 shows the ignition column scatter after the area scaling. The model column and the column calculated from the measured accretion rate coincide, after scaling by the appropriate area (shown on the left panel). However, the ignition column calculated from the observed burst fluences and scaled by the same area shows a scatter.
Similar large deviations are observed in other X-ray bursters (e.g., Fujimoto, 1988, and references therein), and a model to explain it was suggested by Fujimoto et al. (1987). According to their model, the observed large deviations from burst to burst can be explained by a fuel buffer in the envelope. If the size of the fuel buffer is comparable to the total energy of the burst (which could easily be the case for the weak bursts observed from 4U 1728-34) the deviations could be large. However, as suggested by Fujimoto et al. (1987), the influence of the buffer can be reduced statistically if a large number of bursts is observed. If this mechanism is responsible for the observed scatter, for consecutive bursts we would expect a pattern of alternating high and low values following each other. Although our sample includes 13 consecutive Chandra bursts, the large uncertainties may have prevented us to observe this behavior. The uncertainties of the RXTE bursts are significantly smaller, but our sample does not include more than three consecutive RXTE bursts.
The mean value of the parameter measured from the 38 bursts in our sample is 180, and we do not see any variations of the mean value with the accretion rate, at least in our observed range of the accretion rates from . This is close to the value predicted by our model (180-190; see Fig. 3), which seems to include a small “leak” (less than 10%) due to some stable burning before each burst. Such a close agreement between the average and theoretical values implies that the accretion disk inclination angle with respect to the line of sight is approximately 60 degrees (or slightly less for ), as predicted in the model of angular distribution of radiation by Fujimoto (1988, see their Fig. 2 and formula 6). The model suggests that the emission is enhanced in the direction perpendicular to the accretion disk plane, due to scattering in the inner disk, and the degree of anisotropy is larger for the persistent emission. The angle of 60 degrees is consistent with the fact that the eclipses were never observed from this source. Fujimoto et al. (1987) also argue that the deviations are largest for the photospheric radius expansion bursts (PRE) because part of the outer envelope can be ejected, increasing the significantly. Our sample includes four possible PRE bursts detected by Chandra (see Galloway et al. 2010) and also two PRE bursts in the RXTE sample (Galloway et al., 2008), but their parameters are not exceptional. This may suggest that the mass loss due to the envelope ejection during PRE bursts is negligible compared to the fuel buffer size (e.g., see Weinberg et al., 2006).
The same mechanism that pushes the envelope buffer closer to the ignition zone (i.e., the turbulent mixing and dissipative heating associated with thermonuclear instabilities, caused by inflow of angular momentum with accreted gas; Fujimoto et al., 1987) could also explain weak, frequent bursts (“premature ignition”). A similar idea was also proposed recently by Piro & Bildsten (2007). The turbulent mixing model alone could, perhaps, explain the observed burst properties, without introducing the accretion confinement, but although its spin is slow (363 Hz; Strohmayer et al., 1996), we suspect that the observed accretion rates of 4U 172834 might be too small for this mechanism to work. According to this model, the mixing is most effective for large accretion rates and small spin rates. Figure 15 of Piro & Bildsten (2007) suggests that for the slow spin of 4U 172834, the required accretion rate to overcome the buoyancy barrier would be . However, the critical accretion rate depends sensitively on the conditions in the fuel layer and the strength of mixing (e.g., see equation 59 of Piro & Bildsten, 2007).
It is worth noting that our sample is highly selective for bursts with short recurrence times; the bursts observed with Chandra all have unusually short recurrence times, and for RXTE and INTEGRAL we only quote measurements for pairs of bursts for which there are no (or few) data gaps. If we relax this requirement, there is evidence for much higher (up to ) values of in the literature for 4U 172834 and other systems. Falanga et al. (2006) quote values up to almost 800, but these are upper limits only, since one or more data gaps occurred in between the bursts. However, Galloway et al. (2008) also found that the average -value for a group of bursts with short recurrence times (including 4U 172834) was . Such high values likely cannot arise from incomplete burning leaving behind a residual fuel buffer, since the required size of the buffer would be many times the amount of fuel burnt in the burst. Instead, such inefficient burning must arise from a more substantial energy leak, perhaps steady He-burning, as has also been suggested to play a role in the decrease in burst rate for most bursters at an accretion rate of around (Revnivtsev et al., 2001; Cornelisse et al., 2003; Galloway et al., 2008). Some degree of steady burning could also explain the scatter in the measured values in our sample, but we cannot rule out the other mechanisms discussed here.
6.3. Comparison with other bursters
Finally, we investigate whether the accreted fuel confinement proposed to explain the observed burst recurrence times of 4U 1728–34, and other mechanisms discussed here, may also be applicable to other bursters. In their study of 9 bursters observed with BeppoSAX, Cornelisse et al. (2003) found that the burst rate increases slowly up to the peak rate, reaching it at approximately erg s-1 (or for mixed fuel), after which it sharply drops. Cornelisse et al. (2003) attributed such a behavior to the onset of stable hydrogen burning, which occurs at the transition from the lowest to the medium accretion rates (i.e., from the burst ignition regime 3 to 2; Fujimoto et al., 1981).
The drop in the observed burst rate, at a slightly lower X-ray luminosity, was also later confirmed by Galloway et al. (2008), who studied a much larger sample of bursters covering a much wider range of accretion rates. However, Galloway et al. (2008) argue that the decreasing burst frequency is more likely due to onset of stable burning of helium (see also van Paradijs et al., 1988), which must occur at lower accretion rates than theoretically predicted. Galloway et al. (2008) also found that the burst rate continues to decrease further until the bursting entirely stops (at ). In addition, the parameter was found to remain constant or to slightly increase globally, rather than decrease as would be expected at the transition from the smallest accretion rate (ignition regime 3) to the medium accretion rate regime (2) and onset of stable burning of hydrogen (i.e., the transition of the H/He ignition to the He-ignition; Fujimoto et al., 1981).
Interpreting their results, Cornelisse et al. (2003) pointed out that there is a large discrepancy between the theoretically predicted () and measured boundary between the two regimes, and offered an alternative explanation, which was proposed earlier by Bildsten (2000) based on the Inogamov & Sunyaev (1999) model. Bildsten (2000) suggested that the observed burst rate drop is caused by the decrease of the local accretion rate. This would be possible if the nuclear burning is restricted to a smaller area, which increases with the global accretion rate. If the area increases faster than the global accretion rate, the local accretion rate may be decreasing. The correlation between the black-body emitting radius, measured in the burst cooling tail of EXO 0748–676 (Gottwald et al., 1986), and the corresponding accretion rate supports this hypothesis. The observed increase, following the burst drop (Galloway et al., 2008), is also consistent with the Bildsten (2000) interpretation (in this case the transition would be from the highest accretion rate regime (1) to regime 2, rather than from 3 to 2). Although the fractional covering of the accreted fuel may not be required to explain the bursting behavior of all sources, it certainly seems plausible at least for some bursters.
Finally, we note that the same mechanism, which we believe is responsible for the large scatter measured for 4U 1728-34 (i.e., the fuel storage and its ignition due to mixing; Fujimoto et al., 1987), is also the most likely explanation for the large scatter and weak frequent bursts with very short recurrence times of 10 minutes, observed in bursters accreting mixed fuel (e.g., 4U 1636–53, EXO 0748–676; Lewin et al., 1987; Gottwald et al., 1986, 1987). However, the scatter in for the latter sources (10–500 for 4U 1636–53, and 5–50 for EXO 0748–676) is somewhat larger than that measured for 1728-34, likely because the fuel composition for sources accreting mixed H/He can vary due to steady H-burning prior to ignition. Interestingly, while our results suggest that some fraction of the burst fuel is typically left unburnt in 4U 1728-34, short recurrence time bursts are not observed in this source, whereas the same mechanism is thought to give rise to such bursts in systems accreting mixed H/He (Keek et al., 2010).
7. Conclusions
We compared the observed properties of 38 bursts detected in Chandra, RXTE and INTEGRAL observations of the helium-rich accretor 4U 172834 with new ignition models. We find that the observationaly-inferred ignition depths, assuming complete fuel spreading on the neutron star surface, are significantly smaller than the theoretically-derived minimum possible ignition depth of g cm2.
One way to reconcile the observed and predicted burst recurrence times would be to assume that the observed X-ray luminosities underestimate the accretion rates (for example, due to a non-detection of the extremely soft or/and hard spectral components). However, for 4U 172834 this scenario is not plausable because these additional spectral components would have to be 26 times larger than the mesured bolometric luminosity. In addition, it would imply significantly larger values than theoretically predicted.
Alternatively, the ignition column could be increased, without increasing the global accretion rate, if we assume that the accreted material is confined to a resticted area on the neutron star surface. To match the observations with our ignition model, we find that the spot radii would have to be in the range 4.56 km, and that they seem to be correlated with the global accretion rate as predicted by the Lamb et al. (2009) model. However, detailed ignition models that include all possible effects of the magnetic confinement are needed to confirm this result. An additional confirmation could come from the comparison of the X-ray emission from the accretion disk with the nuclear oscillation amplitudes detected simultaneously from the source.
To explain the weak, frequent bursts observed from 4U 172834, we also consider shear-triggered mixing of the accreted helium to larger column depths (Fujimoto et al., 1987; Piro & Bildsten, 2007). However, while this mechanism could push the fuel buffer from the outer envelope closer to the burning zone and explain the observed large deviations, it might not be sufficient to explain the observed burst properties alone at the relatively low observed accretion rates.
We would like to thank Ed Brown, Maurizio Falanga and Stratos Boutloukos for helpful discussions. We would also like to thank the anonymous referee for the useful and constructive comments.
References
- Ayasli & Joss (1982) Ayasli, S., & Joss, P. C. 1982, ApJ, 256, 637
- Bildsten (1998) Bildsten, L. 1998, in NATO ASIC Proc. 515: The Many Faces of Neutron Stars., ed. R. Buccheri, J. van Paradijs, & A. Alpar, 419
- Bildsten (2000) Bildsten, L. 2000, in American Institute of Physics Conference Series, Vol. 522, American Institute of Physics Conference Series, ed. S. S. Holt & W. W. Zhang, 359
- Bildsten & Brown (1997) Bildsten, L., & Brown, E. F. 1997, ApJ, 477, 897
- Brown (2000) Brown, E. F. 2000, ApJ, 531, 988
- Brown & Bildsten (1998) Brown, E. F., & Bildsten, L. 1998, ApJ, 496, 915
- Brown & Cumming (2009) Brown, E. F., & Cumming, A. 2009, ApJ, 698, 1020
- Chelovekov et al. (2006) Chelovekov, I. V., Grebenev, S. A., & Sunyaev, R. A. 2006, Astronomy Letters, 32, 456
- Chou & Grindlay (2001) Chou, Y., & Grindlay, J. E. 2001, ApJ, 563, 934
- Chugunov & Haensel (2007) Chugunov, A. I., & Haensel, P. 2007, MNRAS, 381, 1143
- Cooper & Narayan (2005) Cooper, R. L., & Narayan, R. 2005, ApJ, 629, 422
- Cooper & Narayan (2006) Cooper, R. L., & Narayan, R. 2006, ApJ, 652, 584
- Cornelisse et al. (2003) Cornelisse, R., et al. 2003, A&A, 405, 1033
- Cumming (2003) Cumming, A. 2003, ApJ, 595, 1077
- Cumming (2004) Cumming, A. 2004, Nuclear Physics B Proceedings Supplements, 132, 435
- Cumming et al. (2006) Cumming, A., Macbeth, J., in ’t Zand, J. J. M., & Page, D. 2006, ApJ, 646, 429
- D’Aí et al. (2006) D’Aí, A., et al. 2006, A&A, 448, 817
- Daligault & Gupta (2009) Daligault, J., & Gupta, S. 2009, ApJ, 703, 994
- Di Salvo et al. (2000) Di Salvo, T., Iaria, R., Burderi, L., & Robba, N. R. 2000, ApJ, 542, 1034
- Falanga et al. (2006) Falanga, M., Götz, D., Goldoni, P., Farinelli, R., Goldwurm, A., Mereghetti, S., Bazzano, A., & Stella, L. 2006, A&A, 458, 21
- Fujimoto (1988) Fujimoto, M. Y. 1988, ApJ, 324, 995
- Fujimoto et al. (1981) Fujimoto, M. Y., Hanawa, T., & Miyaji, S. 1981, ApJ, 247, 267
- Fujimoto et al. (1987) Fujimoto, M. Y., Sztajno, M., Lewin, W. H. G., & van Paradijs, J. 1987, ApJ, 319, 902
- Fushiki & Lamb (1987) Fushiki, I., & Lamb, D. Q. 1987, ApJ, 323, L55
- Galloway et al. (2008) Galloway, D. K., Muno, M. P., Hartman, J. M., Psaltis, D., & Chakrabarty, D. 2008, ApJS, 179, 360
- Gottwald et al. (1986) Gottwald, M., Haberl, F., Parmar, A. N., & White, N. E. 1986, ApJ, 308, 213
- Gottwald et al. (1987) Gottwald, M., Haberl, F., Parmar, A. N., & White, N. E. 1987, ApJ, 323, 575
- Haberl et al. (1987) Haberl, F., Stella, L., White, N. E., Gottwald, M., & Priedhorsky, W. C. 1987, ApJ, 314, 266
- Haensel & Zdunik (2008) Haensel, P., & Zdunik, J. L. 2008, A&A, 480, 459
- Horowitz et al. (2007) Horowitz, C. J., Berry, D. K., & Brown, E. F. 2007, Phys. Rev. E, 75, 066101
- Horowitz et al. (2009) Horowitz, C. J., Caballero, O. L., & Berry, D. K. 2009, Phys. Rev. E, 79, 026103
- Inogamov & Sunyaev (1999) Inogamov, N. A., & Sunyaev, R. A. 1999, Astronomy Letters, 25, 269
- Itoh & Kohyama (1993) Itoh, N., & Kohyama, Y. 1993, ApJ, 404, 268
- Joss (1977) Joss, P. C. 1977, Nature, 270, 310
- Joss & Li (1980) Joss, P. C., & Li, F. K. 1980, ApJ, 238, 287
- Keek et al. (2010) Keek, L., Galloway, D. K., in ’t Zand, J. J. M., & Heger, A. 2010, ApJ submitted
- King & Watson (1986) King, A. R., & Watson, M. G. 1986, Nature, 323, 105
- Koike et al. (2004) Koike, O., Hashimoto, M., Kuromizu, R., & Fujimoto, S. 2004, ApJ, 603, 242
- Kuulkers et al. (2003) Kuulkers, E., den Hartog, P. R., in’t Zand, J. J. M., Verbunt, F. W. M., Harris, W. E., & Cocchi, M. 2003, A&A, 399, 663
- Lamb & Lamb (1978) Lamb, D. Q., & Lamb, F. K. 1978, ApJ, 220, 291
- Lamb et al. (2009) Lamb, F. K., Boutloukos, S., Van Wassenhove, S., Chamberlain, R. T., Lo, K. H., Clare, A., Yu, W., & Miller, M. C. 2009, ApJ, 706, 417
- Lewin et al. (1987) Lewin, W. H. G., Penninx, W., van Paradijs, J., Damen, E., Sztajno, M., Truemper, J., & van der Klis, M. 1987, ApJ, 319, 893
- Lewin et al. (1995) Lewin, W. H. G., van Paradijs, J., & Taam, R. E. 1995, in X-ray binaries,, ed. W. H. G. Lewin, J. van Paradijs, & E. P. J. van den Heuvel
- Maraschi & Cavaliere (1977) Maraschi, L., & Cavaliere, A. 1977, in X-ray Binaries and Compact Objects, 127
- Marshall et al. (2001) Marshall, H. L., et al. 2001, AJ, 122, 21
- Miller et al. (2009) Miller, J. M., Cackett, E. M., & Reis, R. C. 2009, ApJ, 707, L77
- Narayan & Heyl (2003) Narayan, R., & Heyl, J. S. 2003, ApJ, 599, 419
- Paczynski (1983) Paczynski, B. 1983, ApJ, 264, 282
- Page et al. (2006) Page, D., Geppert, U., & Weber, F. 2006, Nuclear Physics A, 777, 497
- Payne & Melatos (2006) Payne, D. J. B., & Melatos, A. 2006, ApJ, 652, 597
- Piro & Bildsten (2007) Piro, A. L., & Bildsten, L. 2007, ApJ, 663, 1252
- Podsiadlowski et al. (2002) Podsiadlowski, P., Rappaport, S., & Pfahl, E. D. 2002, ApJ, 565, 1107
- Priedhorsky & Terrell (1984) Priedhorsky, W., & Terrell, J. 1984, ApJ, 284, L17
- Psaltis & Lamb (1999) Psaltis, D., & Lamb, F. K. 1999, Astronomical and Astrophysical Transactions, 18, 447
- Revnivtsev et al. (2001) Revnivtsev, M., Churazov, E., Gilfanov, M., & Sunyaev, R. 2001, A&A, 372, 138
- Schatz et al. (2003) Schatz, H., Bildsten, L., & Cumming, A. 2003, ApJ, 583, L87
- Schatz et al. (1999) Schatz, H., Bildsten, L., Cumming, A., & Wiescher, M. 1999, ApJ, 524, 1014
- Shternin & Yakovlev (2006) Shternin, P. S., & Yakovlev, D. G. 2006, Phys. Rev. D, 74, 043004
- Shternin et al. (2007) Shternin, P. S., Yakovlev, D. G., Haensel, P., & Potekhin, A. Y. 2007, MNRAS, 382, L43
- Stella et al. (1984) Stella, L., Kahn, S. M., & Grindlay, J. E. 1984, ApJ, 282, 713
- Stella et al. (1987) Stella, L., Priedhorsky, W., & White, N. E. 1987, ApJ, 312, L17
- Strohmayer & Bildsten (2006) Strohmayer, T., & Bildsten, L. 2006, New views of thermonuclear bursts, ed. M. Lewin, W. H. G. & van der Klis 113
- Strohmayer et al. (1996) Strohmayer, T., Zhang, W., Smale, A., Day, C., Swank, J., Titarchuk, L., & Lee, U. 1996, IAU Circ., 6387, 2
- Thompson et al. (2008) Thompson, T. W. J., Galloway, D. K., Rothschild, R. E., & Homer, L. 2008, ApJ, 681, 506
- van Paradijs et al. (1988) van Paradijs, J., Penninx, W., & Lewin, W. H. G. 1988, MNRAS, 233, 437
- Weinberg et al. (2006) Weinberg, N. N., Bildsten, L., & Schatz, H. 2006, ApJ, 639, 1018
- Woosley et al. (2004) Woosley, S. E., et al. 2004, ApJS, 151, 75
- Woosley & Taam (1976) Woosley, S. E., & Taam, R. E. 1976, Nature, 263, 101
- Yakovlev & Pethick (2004) Yakovlev, D. G., & Pethick, C. J. 2004, ARA&A, 42, 169