The XMM Cluster Survey: Active Galactic Nuclei and Starburst Galaxies in XMMXCS J2215.9-1738 at
Abstract
We use Chandra X-ray and Spitzer infrared observations to explore the AGN and starburst populations of XMMXCS J2215.9-1738 at , one of the most distant spectroscopically confirmed galaxy clusters known. The high resolution X-ray imaging reveals that the cluster emission is contaminated by point sources that were not resolved in XMM-Newton observations of the system, and have the effect of hardening the spectrum, leading to the previously reported temperature for this system being overestimated. From a joint spectroscopic analysis of the Chandra and XMM-Newton data, the cluster is found to have temperature keV and luminosity erg s-1, extrapolated to a radius of 2 Mpc. As a result of this revised analysis, the cluster is found to lie on the relation, but the cluster remains less luminous than would be expected from self-similar evolution of the local relation. Two of the newly discovered X-ray AGN are cluster members, while a third object, which is also a prominent 24 source, is found to have properties consistent with it being a high redshift, highly obscured object in the background. We find a total of eight 24 sources associated with cluster members (four spectroscopically confirmed, and four selected using photometric redshifts), and one additional 24 source with two possible optical/near-infrared counterparts that may be associated with the cluster. Examining the IRAC colors of these sources, we find one object is likely to be an AGN. Assuming that the other 24 sources are powered by star formation, their infrared luminosities imply star formation rates M☉ yr-1. We find that three of these sources are located at projected distances of kpc from the cluster center, suggesting that a large amount of star formation may be taking place in the cluster core, in contrast to clusters at low redshift.
Subject headings:
X-rays: galaxies: clusters — galaxies: clusters: individual (XMMXCS J2215.91738) — galaxies: active — galaxies: star formation1. Introduction
The universe at high redshift is a much more active place than we see locally. Radio and far-infrared studies have shown that the comoving star formation rate density increases by a factor from to (e.g. Seymour et al., 2008; Magnelli et al., 2009), and continues rising towards higher redshifts, peaking at (Bouwens et al., 2009). The fraction of galaxies with Active Galactic Nuclei (AGN) is also seen to be much higher when the universe was young: current observations suggest that the space density of the brightest AGNs peaks at (Assef et al., 2010; Silverman et al., 2005). Observations in the local universe show that the stellar mass of galactic bulges is correlated with the mass of nuclear super-massive black holes (e.g. Ferrarese & Merritt, 2000; Gebhardt et al., 2000), suggesting that AGN play a major role in the growth of stellar mass. Simulations suggest that interactions and mergers between gas-rich galaxies drive this process, by providing both fuel for AGNs and triggering starburst activity in galactic nuclei (e.g. Granato et al., 2004; Hopkins et al., 2008). Eventually, gas heating by the AGN (feedback) reaches such a level that star formation is shut down, leaving the stellar population of the host galaxy to evolve passively. The quenching of star formation in massive galaxies by AGN feedback is a crucial ingredient in the latest semi-analytic models of galaxy formation, bringing the models into much closer agreement with observations (e.g. De Lucia et al., 2006; Croton et al., 2006; Bower et al., 2006; Somerville et al., 2008).
A connection between local environment, star formation and AGN is therefore expected in this theoretical picture. Intriguingly, recent studies of the dependence of star formation rate (SFR) on local galaxy density using large samples of field galaxies indicate that SFR increases with increasing local density at (Elbaz et al., 2007; Cooper et al., 2008) – whereas the opposite is observed in the local universe (e.g. Lewis et al., 2002; Balogh et al., 2004). This situation is mirrored to some extent in galaxy clusters. Although these systems are dominated by quiescent, early type galaxies – primarily ‘red-and-dead’ ellipticals – and continue to host substantial populations of these objects up to the highest redshifts observed (e.g. Blakeslee et al., 2003; Lidman et al., 2008; Mei et al., 2009; Hilton et al., 2009), an increasing fraction of star forming, late type galaxies are seen in clusters at higher redshifts (e.g Butcher & Oemler, 1984; van Dokkum et al., 2000; Ellingson et al., 2001; Smith et al., 2005). However, recent mid-infrared observations of clusters conducted using the Spitzer Space Telescope show that a significant amount of this increased star formation at high redshift is obscured by dust (Geach et al., 2006; Marcillac et al., 2007; Saintonge et al., 2008; Haines et al., 2009a), and therefore the amount of star formation in clusters has previously been underestimated.
The AGN fraction in clusters is also seen to rise with redshift. Martini, Sivakoff, & Mulchaey (2009) report an eight-fold increase in the number of AGNs in clusters at compared to in the local universe. Similarly, Galametz et al. (2009) find that IR-selected clusters in the IRAC Shallow Cluster Survey (Eisenhardt et al., 2008) show a clear excess of AGNs at high redshift, with the AGN fraction increasing by a factor of three from to . However, it is not yet clear if the AGN fraction is higher in clusters than in the field, nor if the AGN fraction is evolving more rapidly in dense environments.
In this paper we use Chandra X-ray observations and mid-infrared observations taken using the Spitzer Space Telescope to characterize the AGN and dusty star forming population of the cluster XMMXCS J2215.9-1738 (hereafter J2215), which was discovered in the ongoing optical follow-up of the XMM Cluster Survey (XCS; Romer et al., 2001; Sahlén et al., 2009). J2215 is the second highest redshift X-ray selected cluster known, following the recent discovery of a cluster in the Subaru/XMM-Newton Deep Field (Tanaka, Finoguenov, & Ueda 2010, Papovich et al. 2010). The discovery of J2215 and an analysis of its X-ray properties using XMM-Newton data was reported in Stanford et al. (2006, hereafter S06). We presented a first study of the dynamical state of the cluster and measurement of its velocity dispersion using additional VLT and Keck spectroscopy in Hilton et al. (2007, hereafter H07). Most recently, we have used Hubble Space Telescope (HST) imaging and ground-based near-infrared data obtained at the Subaru telescope to perform a detailed examination of the morphologies of the cluster galaxies and the red-sequence within Mpc of the cluster core (Hilton et al., 2009, hereafter H09).
The structure of this paper is as follows. In Section 2, we report revised measurements of the cluster X-ray properties obtained through a joint spectroscopic analysis of the Chandra and XMM-Newton data, taking into account the effect of X-ray point sources that were unresolved in the XMM-Newton data used in S06. In Section 3 we briefly review the optical and ground based near-infrared data used in this paper, before describing new photometry obtained using the Infrared Array Camera (IRAC; Fazio et al., 2004) that extends wavelength coverage of the cluster into the rest frame near-infrared. We describe additional spectroscopic observations obtained at the Keck and Gemini observatories during 2008-2009 in Section 4, where we also present an updated measurement of the cluster velocity dispersion. Mid-infrared (24 ) observations of the cluster obtained using the Multiband Imaging Photometer for Spitzer (MIPS) are described in Section 5. We characterize the properties of cluster 24 and X-ray sources in terms of star formation or AGN activity in Section 6. Finally, we discuss our findings in comparison with lower redshift studies of clusters in Section 7.
We assume a concordance cosmology of , , and km s-1 Mpc-1 throughout, where is the energy density associated with a cosmological constant. All magnitudes are on the AB system (Oke, 1974), unless otherwise stated.
2. X-ray Observations
2.1. Joint XMM-Chandra Spectroscopic Analysis
J2215 is detected as an extended X-ray source in the XCS, but the low resolution of XMM-Newton, especially off-axis, could lead to significant contamination of the cluster emission by unresolved point sources. The comoving space density of bright AGN rises steeply beyond and at is nearing its peak (Silverman et al., 2005). There is therefore a much higher probability of a high redshift cluster such as J2215 containing an X-ray bright AGN compared to clusters in the local universe.
To check for point source contamination, we obtained a 56.2 ks Chandra ACIS-S observation of the cluster111Chandra ObsID 7919 and 8566, resulting in 55.3 ks after cleaning to remove periods of high background. The ACIS-S image reveals two point sources within the 30 radius extraction region used for the XMM-Newton spectroscopic analysis described in S06. Another previously unidentified point source is detected outside the extraction region used in the S06 analysis, but some flux from this object is spread into the extraction region by the larger PSF of XMM-Newton.
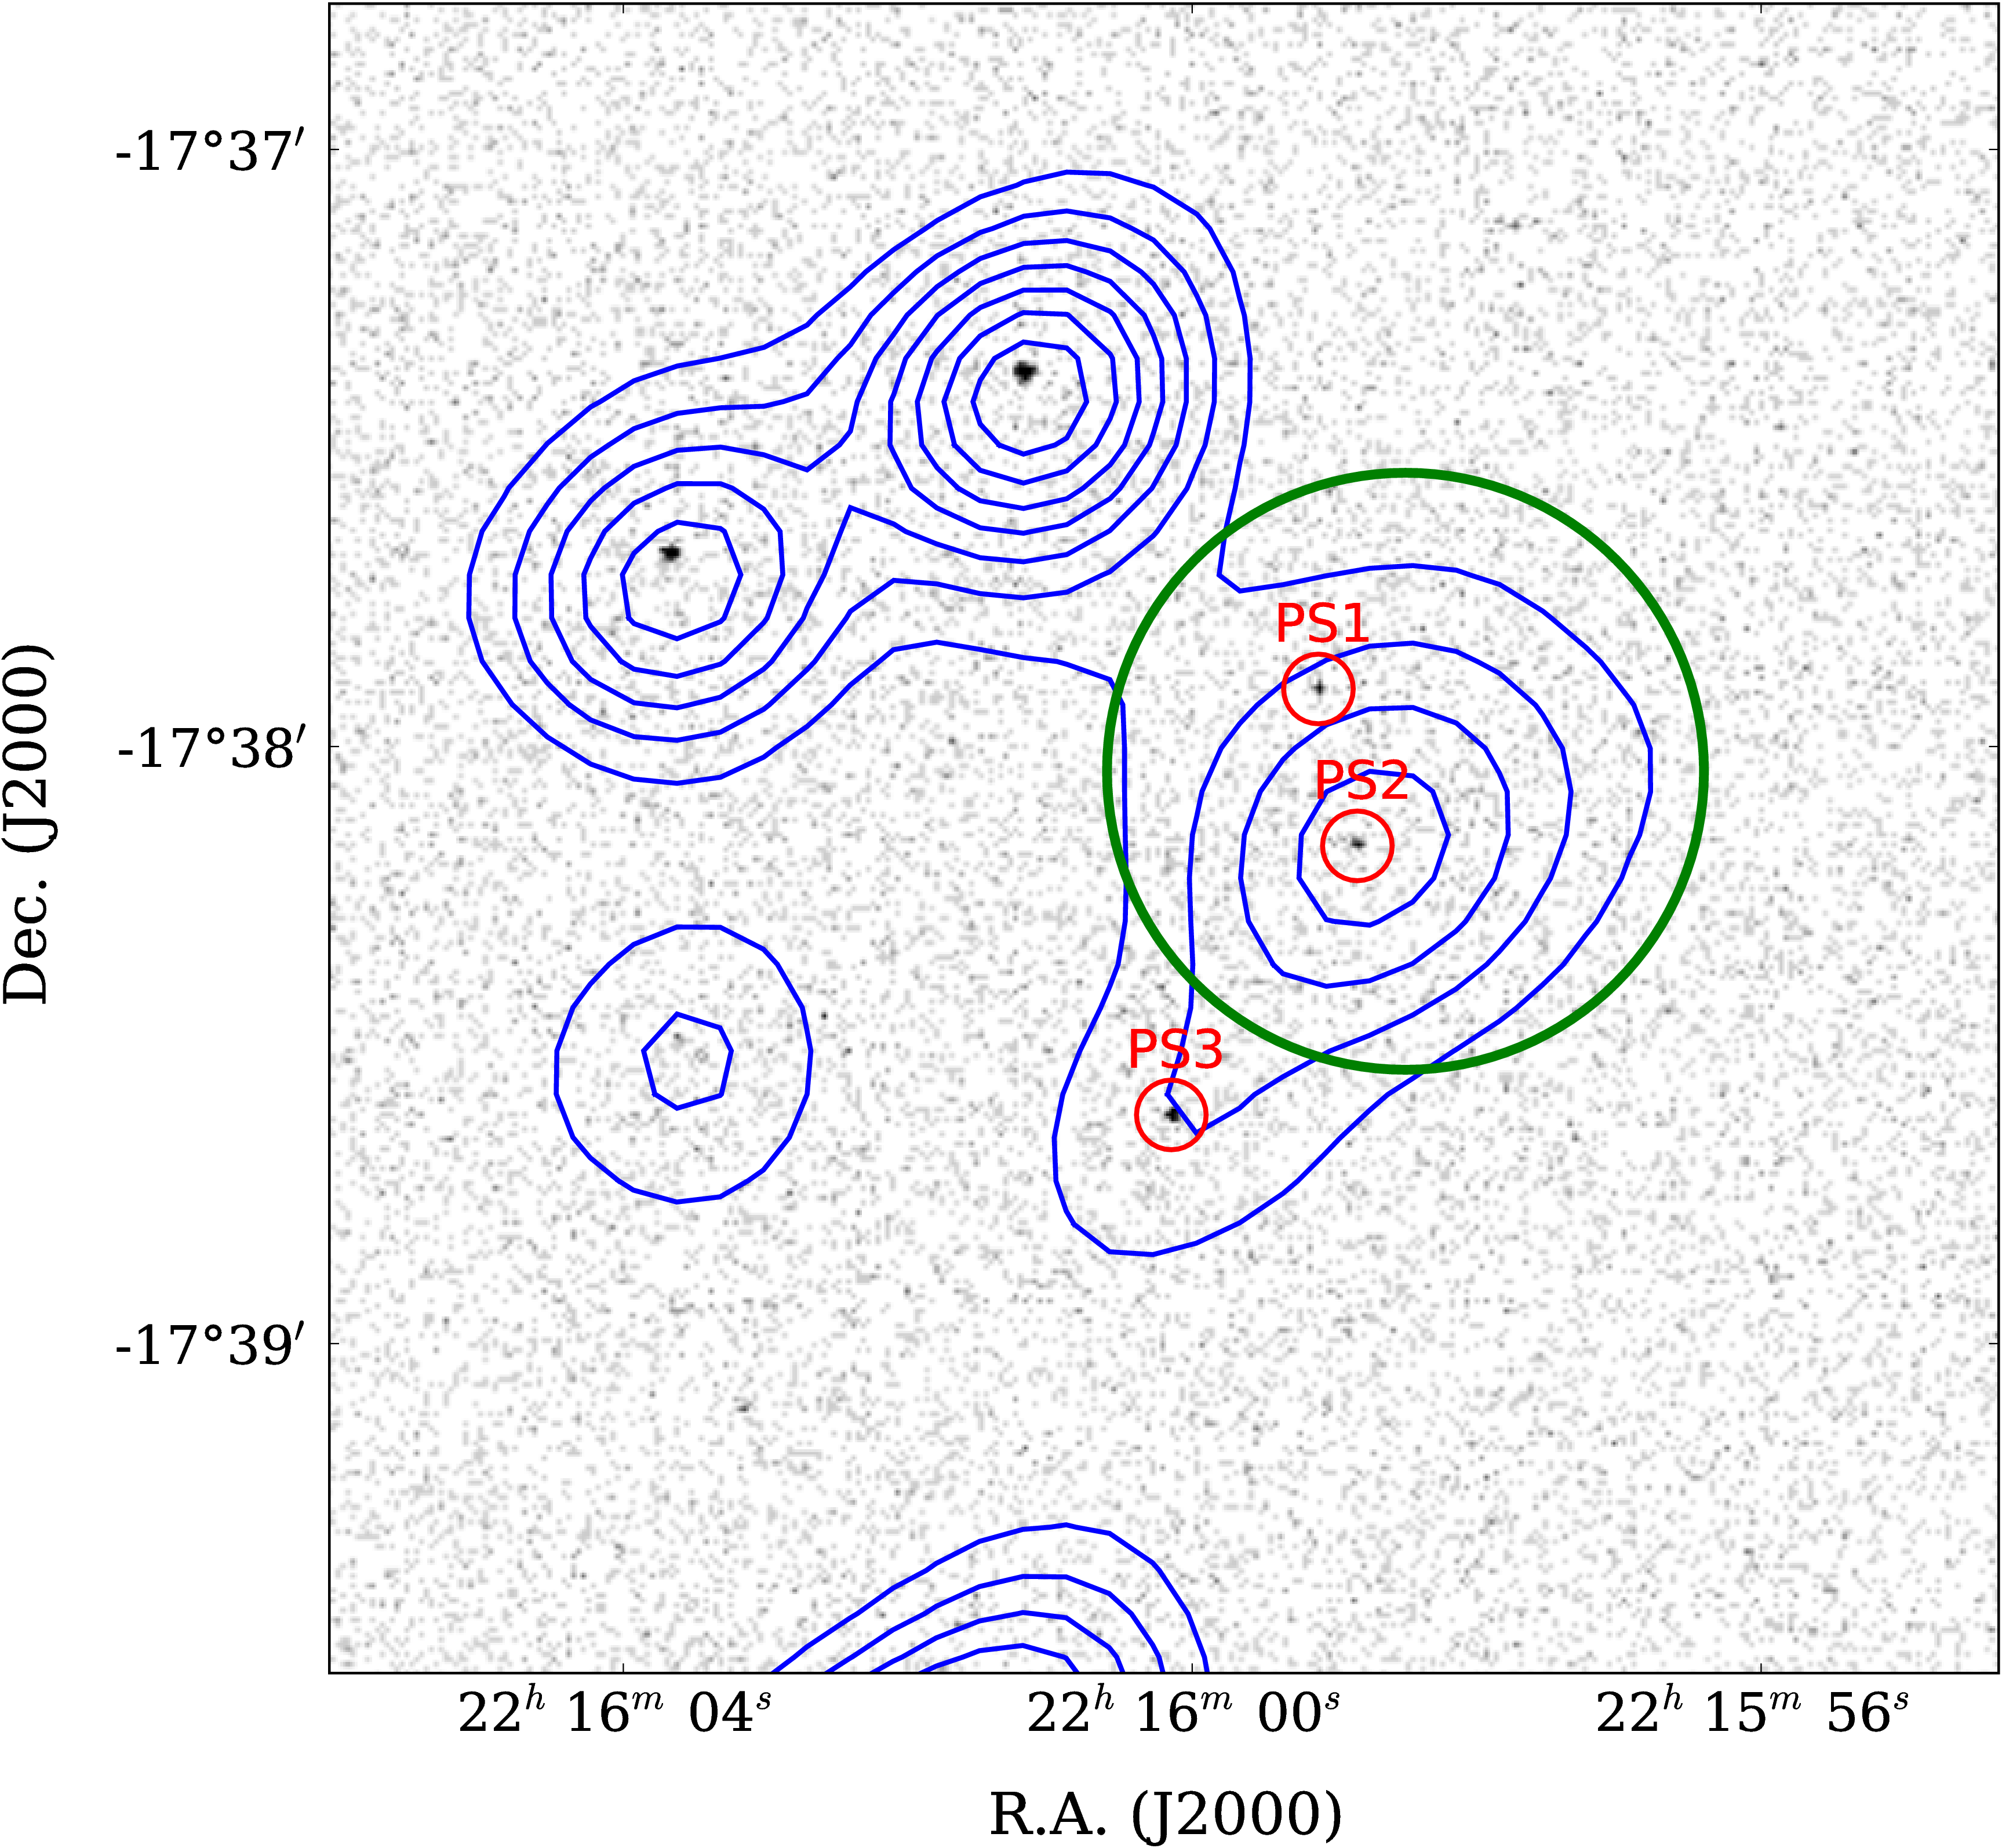
Figure 1 shows the ACIS-S image with the XMM-Newton contours overlaid (newly identified point sources in the Chandra data are marked PS1-3). The three sources are detected with only 23, 27 and 48 counts respectively, but despite this it is possible to fit their spectra with simple power law models including photoelectric absorption (WABS; using the XSPEC package, Arnaud 1996) in order to constrain their properties. The results of the spectral fitting are shown in Table 1.
The spectral properties are consistent with the sources being AGN, with power law indices in the typical range for these objects. The fluxes of the sources span the range erg s-1 cm-2 in the (0.5–2.0) keV band. Sources PS1 and PS2 are spectroscopically confirmed cluster members which show 3727 Å [O ii] emission but not broad lines (see Section 4). Source PS3 is also a source (see Section 5), but is not spectroscopically confirmed despite 8 hours of integration on this object being obtained at Gemini (see Section 4, below). The object does have a low confidence photometric redshift from the analysis of H09 placing the object in the background of the cluster at . Assuming these redshifts, we estimate luminosities for the X-ray point sources after removing the effects of intrinsic absorption within the host galaxies. We find that the sources have unabsorbed luminosities spanning the range erg s-1, typical of AGN rather than starburst galaxies. We list the source properties in Table 1, and discuss the properties of the AGN further in Section 6.1 below.
In order to calculate the fraction of flux from these point sources contaminating the cluster emission, we used the SCISIM222http://xmm.vilspa.esa.es/scisim/release/package to produce simulated images of the sources detected by Chandra blurred by the XMM-Newton PSF. The estimated fraction of the flux from each point source that falls within the XMM-Newton extraction region is also listed in Table 1. We find that the point sources contribute of the total flux measured within the extraction region.
| ID | R.A. | Dec. | aaHydrogen column density ( cm-2). | bbFlux ( erg s-1 cm-2), in the (0.5-2.0) keV band. The uncertainty in these values is 30–50%. | EFccThe fraction of the source flux that is estimated to be within the extraction region used for the XMM-Newton spectroscopic analysis. | CFddEstimate of the fraction that the source contributes to the cluster flux measured by Stanford et al. (2006). | eeUnabsorbed luminosity ( erg s-1) in the indicated energy band. | eeUnabsorbed luminosity ( erg s-1) in the indicated energy band. | ||
|---|---|---|---|---|---|---|---|---|---|---|
| PS1 | 22 15 59.115 | -17 37 54.24 | 1.462 | 1.6 | 2.3 | 1.0 | 0.75 | 0.065 | 0.36 | 0.25 |
| PS2 | 22 15 58.857 | -17 38 09.98 | 1.453 | 0.67 | 4.1 | 1.3 | 0.63 | 0.071 | 1.2 | 0.14 |
| PS3 | 22 16 00.148 | -17 38 37.04 | 2.5**The redshift for PS3 is a low confidence photometric estimate. | 44 | 1.9 | 1.3 | 0.09 | 0.009 | 5.4 | 6.7 |
Note. — Units of right ascension are hours, minutes and seconds, and units of declination are degrees, minutes, and seconds (J2000).
To take into account the effect of the point source contamination on the cluster properties measured using XMM-Newton (S06), it was necessary to undertake a joint fit of the XMM-Newton and Chandra data. A model consisting of three absorbed powerlaw plus an absorbed MEKAL (Mewe-Kaastra-Liedahl) plasma model was jointly fitted to the XMM-Newton spectra from the extraction region and Chandra spectra of the individual point sources with the flux fractions in the extraction region calculated from SCISIM taken into account. The resulting temperature from this analysis is keV.
A temperature keV (90% confidence) was measured in the analysis of S06 based on the XMM-Newton data alone. S06 also considered the possibility of contamination from an unresolved central point source, estimating a lower temperature of keV (90% confidence) in that case. Both of these temperature estimates are somewhat higher than the temperature measured from the joint Chandra-XMM analysis presented here.
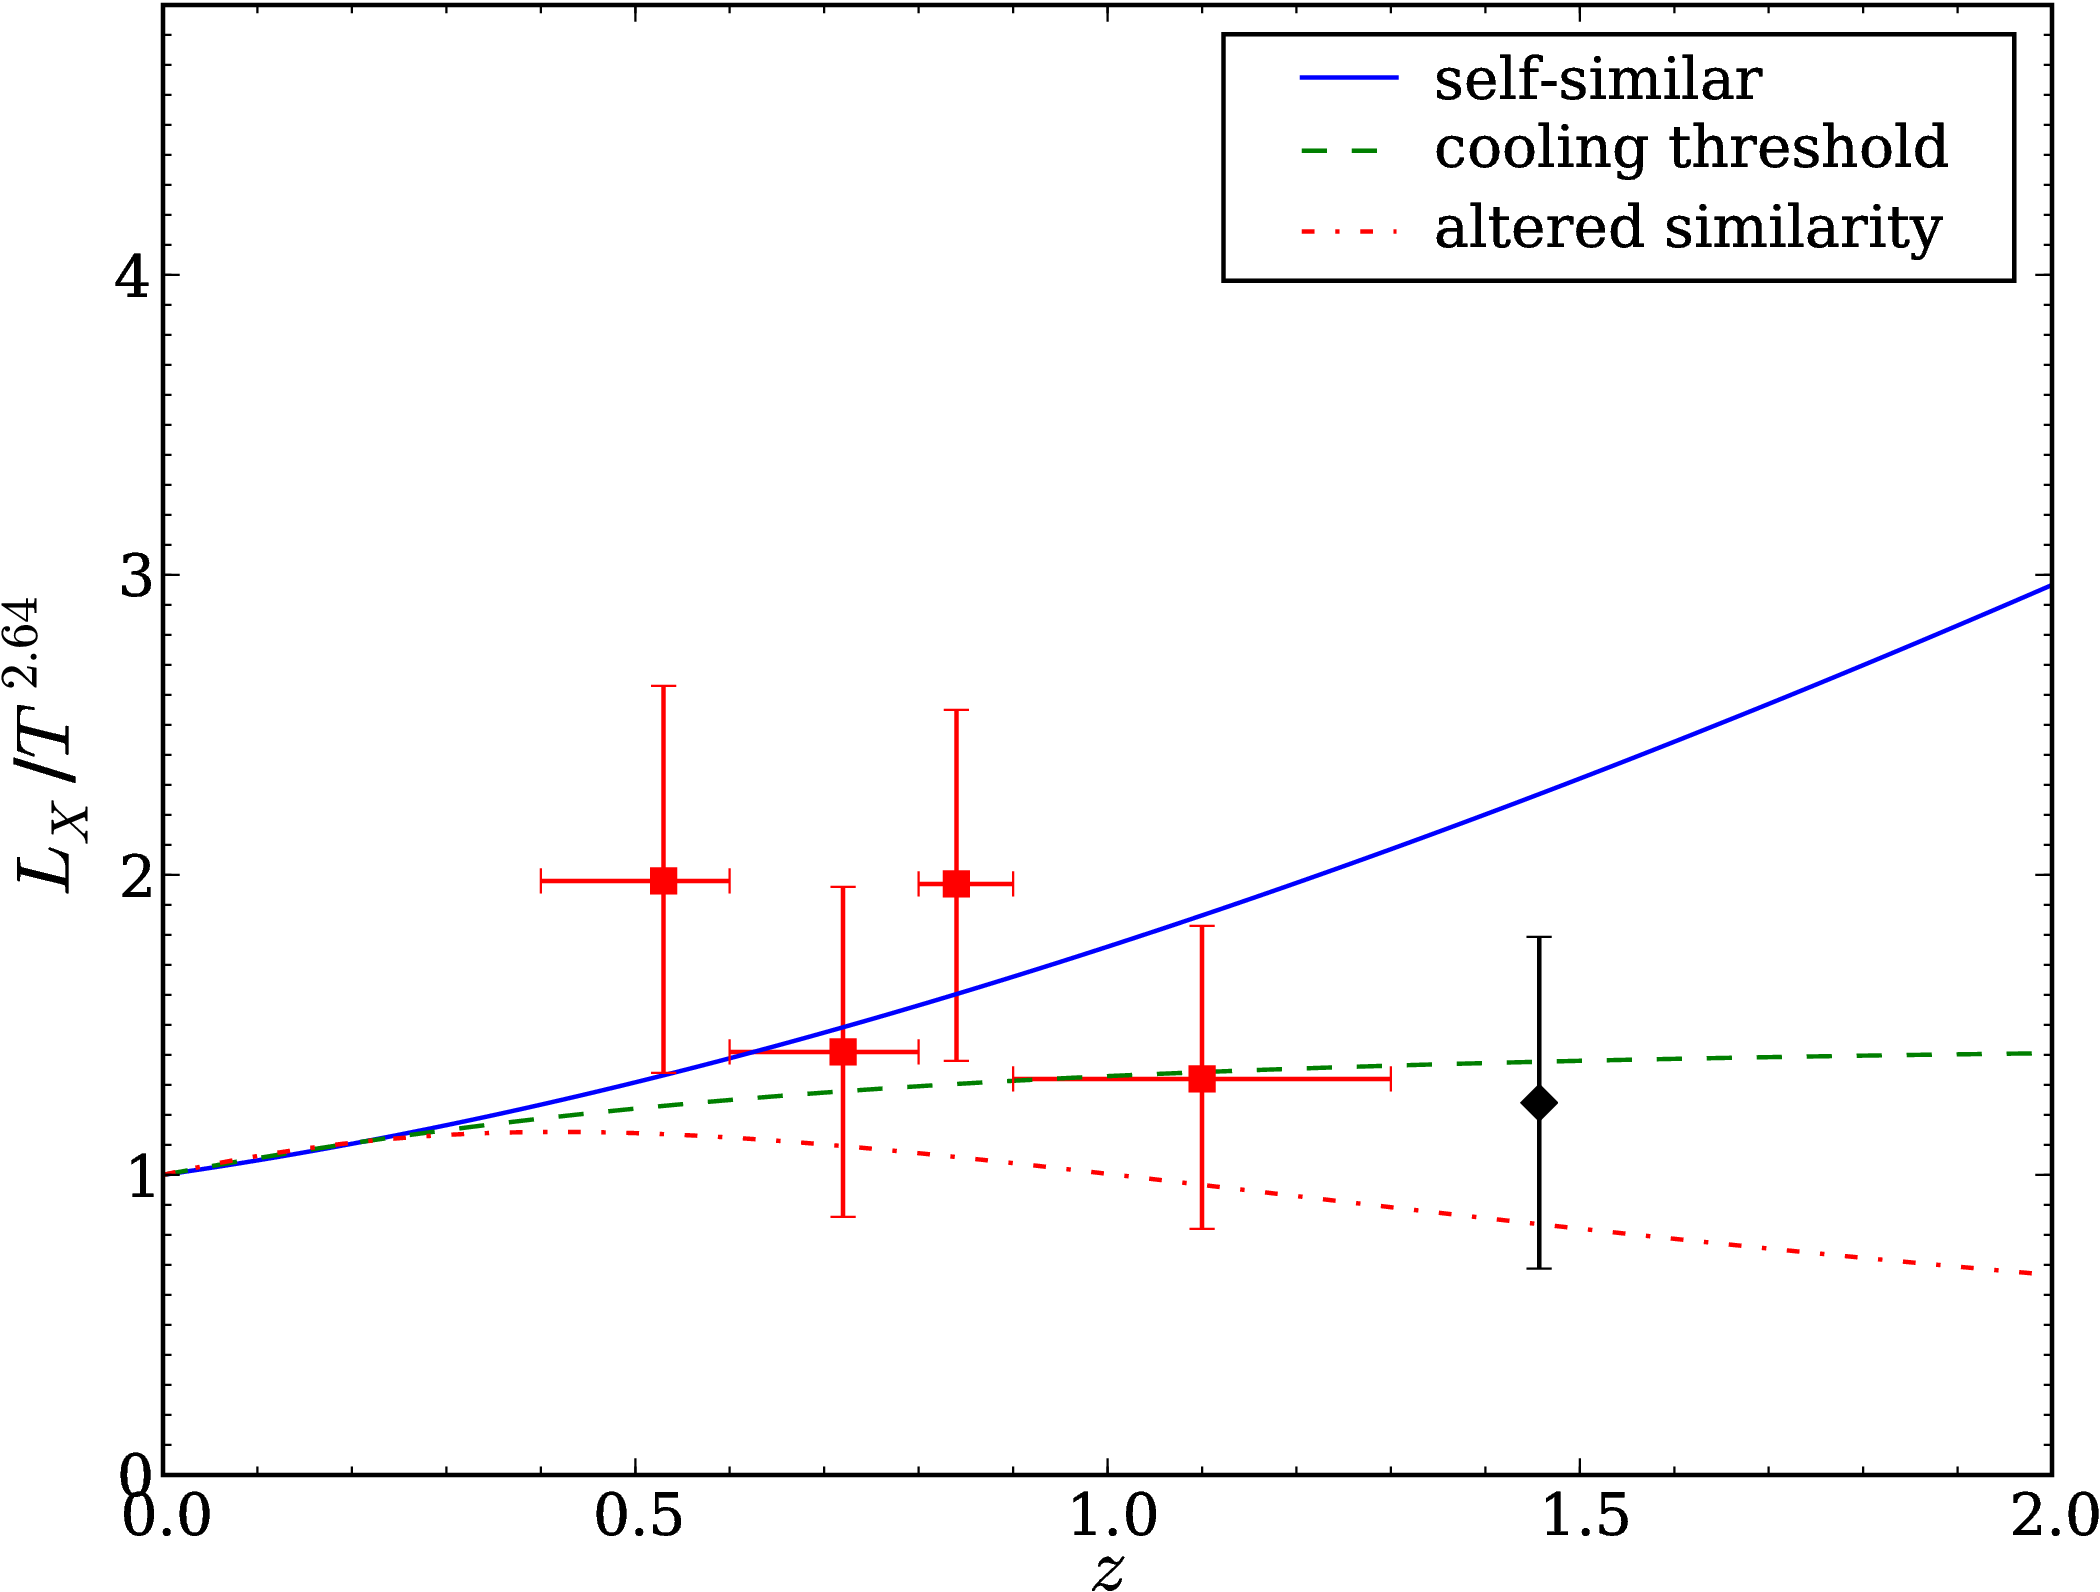
The bolometric luminosity of the cluster is found to be erg s-1, extrapolated to a radius of 2 Mpc assuming a model with and core radius kpc. This is % lower than the equivalent measurement reported in S06. As discussed in H07, a comparison of the S06 luminosity and temperature measurements indicates that the cluster is underluminous compared to the value expected if the relation evolves self-similarly with redshift. The cluster was found to follow the evolution expected in the Voit (2005) analytic models that include the effects of non-gravitational heating and radiative cooling (see also Voit & Ponman, 2003, and the discussion in Hilton et al. 2007). We find that this remains the case using the luminosity and temperature estimates obtained in the joint Chandra-XMM analysis presented here, although the size of the deviation from the self-similar scaling is reduced to the level. This is illustrated in Figure 2, which shows the predicted evolution of the normalization of the relation for the self-similar case, in comparison to the ‘cooling threshold’ () and ‘altered similarity’ () models of Voit (2005). We assume the slope of the relation measured by Markevitch (1998) in comparing the data to the models. The uncertainty on the value of inferred from the J2215 luminosity and temperature measurements is estimated using a bootstrap resampling technique.

2.2. Extended Emission
In addition to studying the point sources in the region of J2215, for which the Chandra telescope is most suited due to its high spatial resolution, we also attempted to identify extended emission from the cluster in the Chandra imaging data alone. Given the considerably lower effective area of Chandra and significantly lower exposure time for these observations compared to the XMM-Newton observations, the amount of information that can obtained from such a detection is limited, but does provide an independent confirmation of the cluster X-ray emission. In order to study extended emission in the Chandra data we first removed flux due to the detected point sources (an easy task given the small, well characterized point spread function of Chandra), and produced a (0.3-2.0 keV) band image (the energy band was chosen to maximize the signal-to-noise). The CIAO task csmooth was then used to adaptively smooth the image.
The resulting smoothed image can be seen in Figure 3, where we have highlighted the 30 radius spectral extraction region used for the XMM-Newton spectroscopic analysis. It can be seen that there is a strong extended source coincident with the position of J2215. The extended emission is detected at the level, with 123 counts in the (0.3-2.0 keV) band. Unfortunately, due to the low number of counts, we are unable to place comparable constraints on the cluster temperature to those obtained with the XMM-Newton data from the Chandra data alone, although the spectrum is consistent with the temperature being in the 3-6 keV range.
3. Optical and Near-Infrared Imaging
We have previously obtained imaging of J2215 at both optical and near-infrared wavelengths using a variety of different telescopes and instruments. Wide field coverage is provided by -band data taken from the ESO Imaging Survey (Dietrich et al., 2006), and by -band imaging from the Palomar 5 m telescope: these data are described in S06, and the overlapping area between them covers an area centered on the cluster. The -band data in this case reach a 5 limiting magnitude of (AB). Much deeper observations of the central of the cluster field have been obtained using HST (, ) and Subaru (, ). These data reach magnitudes deeper at than the Palomar data, and were used to construct a photometric redshift catalog (H09). The HST data were obtained as part of a supernova search in high-redshift clusters (Dawson et al., 2009). In the present study we add imaging with the Spitzer IRAC instrument to this dataset, which extends the wavelength coverage into the rest-frame near-infrared at the cluster redshift.
3.1. Spitzer IRAC Data
IRAC imaging of J2215 was obtained through Program 50333 using all four channels (3.6, 4.5, 5.8, 8.0 ) on 2008 July 12. The frame time was 100 s and 15 exposures were obtained in a medium scale cycling dither pattern. The Basic Calibrated Data (BCD) images were corrected for muxbleed and pulldown and then mosaiced using MOPEX (Makovoz & Khan, 2005).
Photometry was performed using SExtractor (Bertin & Arnouts, 1996) in a two stage process. In the first stage, an initial set of catalogs were generated for each IRAC band, which were then merged by associating objects located within of each other across the catalogs (note the astrometry of the IRAC mosaics is accurate to ). The positions of objects in these catalogs were used to register the IRAC mosaics to a common pixel coordinate system. These registered mosaics were then trimmed to a region of with coverage in all IRAC bands, centered on the cluster X-ray position. In the second stage, we ran SExtractor in dual image mode, extracting a 3.6 selected catalog from the registered and trimmed IRAC images in each band using a consistent set of photometric apertures.
We measured fluxes through diameter circular apertures, adopting aperture corrections to total magnitudes of , , , magnitudes for IRAC channels 1–4 respectively, as measured by Barmby et al. (2008, note that aperture corrections consistent with these values were also found by and ). We use these aperture corrected magnitudes to measure colors between the IRAC bands (see Section 6.1).
The uncertainties in the aperture corrections were added in quadrature to the photometric uncertainties reported by SExtractor; however, at this stage the photometric errors are underestimated due to the effect of resampling the IRAC images during the production of the mosaics, which introduces correlations in the noise between adjacent pixels. This additional source of uncertainty is not taken into account in the SExtractor photometric errors. We correct for this effect using simulations, in a similar manner to that described by Barmby et al. (2008). We measure the background flux through 100 non-overlapping diameter apertures placed at random locations in each IRAC mosaic that do not coincide with detected objects, repeating this process 1000 times. We scale the aperture corrected SExtractor photometric errors by the median rms background flux measured from these simulations divided by the median SExtractor flux error of the detected objects. The scale factors applied to the uncertainties in the total aperture magnitudes were 2.2, 1.8, 2.5, 1.9 across IRAC channels 1–4 respectively.
The IRAC catalog was cross matched against the -selected catalogs described above using a 1.2 matching radius. Clearly, given the much larger PSF of IRAC () compared to these other catalogs, many sources are blended in the cluster center: in each case we choose the nearest match, and will note such affected objects where necessary in the subsequent analysis.
4. Optical Spectroscopy
4.1. Observations and Data Reduction
Redshifts for 17 galaxies concordant with the cluster redshift were reported in H07. We have observed J2215 using a further six slit masks since that work: five with the DEep Imaging and Multi-Object Spectrograph (DEIMOS; Faber et al., 2003) on the 10 m Keck II telescope, plus one additional mask observed with the Gemini Multi-Object Spectrograph (GMOS; Hook et al., 2003) on the 8 m Gemini South telescope. Redshifts for galaxies within of the cluster center from three of the additional DEIMOS masks (obtained in 2007 September and 2008 September) were included in the catalog included in H09. The two DEIMOS masks and the GMOS mask observed in 2009 were designed to prioritize objects detected in our mid-infrared imaging (see Section 5 below). We now describe the observations and data reduction for each instrument in turn.
4.1.1 DEIMOS
For all masks, DEIMOS was used with the 600ZD grating, which is blazed at 7500 Å and has dispersion 0.65 Å pixel-1, in conjunction with the OG515 order sorting filter. This setup provides typical wavelength coverage from Å. Slits of width and minimum length were used in all slit masks. Each mask contained typically slitlets, spread across the field of view of DEIMOS.
A total of five masks were observed with DEIMOS subsequent to the analysis presented in H07. We observed one mask on UT 2007 September 10, obtaining sec exposures in clear conditions with seeing. Two masks were observed on UT 2008 September 01-02 in mostly clear conditions. The seeing was typically on September 01, rising to on the following night. In these masks we preferentially targeted galaxies close to the red-sequence with photometric redshifts concordant with the cluster redshift from the catalog presented in H09. We obtained sec of integration time through the mask observed on September 01 and sec through the second mask, which was observed on the following night. Finally, on UT 2009 October 18-19 we observed two more masks, in which 24 sources (see Section 5 below) were prioritized. These observations were carried out in clear conditions with seeing. We obtained sec exposures for each of these masks, observing one mask on each night.
4.1.2 GMOS
| ID | R.A. (J2000) | Dec. (J2000) | aaThe redshift uncertainity is measured to be , see Section 4.2. | QbbAn additional 14 objects with (insecure) redshifts are not listed in this table. | MethodccRedshift measurement method: V = from visually identified features; X = from cross correlation with spectral templates (see Section 4.2). | ddMeasured in ESO Imaging Survey data (Dietrich et al., 2006); magnitudes have been converted to the AB system using . If no value is given, the object was not detected. ID 65 is detected in HST imaging of the cluster (described in Hilton et al. 2009). | eeTaken from the catalog presented in Hilton et al. (2009) where H09 ID is given; otherwise measured from the Palomar -band data described in Stanford et al. (2006). If no value is given, the object was not detected in either -selected catalog. | H09ffID in the catalog of Hilton et al. (2009). | r (arcmin) | r (Mpc) | [O ii]gg indicates 3727 Å [O ii] emission was identified in the object spectrum. |
|---|---|---|---|---|---|---|---|---|---|---|---|
| 1 | 22 15 58.464 | -17 37 58.58 | 1.452 | 3 | V | 23.63 | 20.90 | 742 | 0.066 | 0.033 | |
| 3 | 22 15 58.872 | -17 37 59.26 | 1.451 | 3 | V | 23.30 | 21.05 | 748 | 0.104 | 0.053 | |
| 4 | 22 15 58.056 | -17 38 04.59 | 1.465 | 2 | V | 23.60 | 789 | 0.111 | 0.057 | ||
| 5 | 22 15 59.040 | -17 38 02.54 | 1.454 | 2 | V | 22.72 | 20.86 | 770 | 0.129 | 0.065 | |
| 6 | 22 15 58.488 | -17 38 10.53 | 1.465 | 3 | X | 23.73 | 20.57 | 824 | 0.134 | 0.068 | |
| 7 | 22 15 59.080 | -17 38 02.40 | 1.459 | 2 | V | 22.72 | 20.86 | 770 | 0.138 | 0.070 | |
| 10 | 22 15 58.848 | -17 38 09.85 | 1.453 | 2 | V | 22.75 | 21.77 | 821 | 0.148 | 0.075 | |
| 16 | 22 15 59.136 | -17 37 54.22 | 1.462 | 3 | X | 24.36 | 20.72 | 712 | 0.205 | 0.104 | |
| 18 | 22 15 59.376 | -17 38 09.88 | 1.467 | 3 | V | 24.56 | 23.89 | 823 | 0.242 | 0.123 | |
| 19 | 22 15 57.432 | -17 37 57.90 | 1.454 | 2 | V | 23.05 | 754 | 0.266 | 0.135 | ||
| 30 | 22 15 57.192 | -17 38 07.80 | 1.450 | 3 | X | 23.24 | 22.05 | 810 | 0.324 | 0.164 | |
| 35 | 22 15 57.240 | -17 37 53.22 | 1.454 | 3 | V | 23.69 | 21.41 | 708 | 0.338 | 0.171 | |
| 36 | 22 15 57.720 | -17 37 45.55 | 1.451 | 2 | V | 24.17 | 20.91 | 653 | 0.338 | 0.172 | |
| 38 | 22 15 58.752 | -17 37 40.76 | 1.460 | 2 | X | 22.33 | 631 | 0.367 | 0.186 | ||
| 39 | 22 15 56.928 | -17 38 04.70 | 1.445 | 3 | V | 23.03 | 21.82 | 786 | 0.376 | 0.191 | |
| 44 | 22 15 58.344 | -17 37 37.30 | 1.453 | 3 | V | 24.11 | 22.71 | 629 | 0.422 | 0.214 | |
| 53 | 22 16 00.384 | -17 37 50.59 | 1.451 | 3 | X | 23.52 | 20.99 | 692 | 0.491 | 0.249 | |
| 57 | 22 16 00.648 | -17 37 51.67 | 1.471 | 2 | V | 23.66 | 21.17 | 696 | 0.543 | 0.275 | |
| 59 | 22 15 56.184 | -17 37 49.90 | 1.454 | 3 | X | 23.64 | 20.57 | 688 | 0.590 | 0.300 | |
| 62 | 22 15 56.016 | -17 37 55.05 | 1.460 | 2 | V | 24.41 | 23.88 | 723 | 0.605 | 0.307 | |
| 63 | 22 16 00.096 | -17 37 33.92 | 1.454 | 3 | V | 22.86 | 591 | 0.609 | 0.309 | ||
| 65 | 22 15 56.058 | -17 37 49.90 | 1.461 | 2 | V | 0.618 | 0.314 | ||||
| 66 | 22 15 59.472 | -17 38 37.39 | 1.457 | 3 | X | 23.09 | 22.77 | 1018 | 0.626 | 0.318 | |
| 77 | 22 16 00.096 | -17 38 42.61 | 1.463 | 2 | V | 23.57 | 22.25 | 1047 | 0.769 | 0.390 | |
| 82 | 22 15 56.544 | -17 37 21.36 | 1.446 | 2 | V | 23.67 | 21.49 | 526 | 0.829 | 0.421 | |
| 105 | 22 16 00.360 | -17 38 57.69 | 1.456 | 2 | V | 21.64 | 1130 | 1.021 | 0.518 | ||
| 106 | 22 15 55.200 | -17 37 22.36 | 1.460 | 2 | V | 23.65 | 21.36 | 538 | 1.032 | 0.524 | |
| 120 | 22 16 03.432 | -17 37 51.24 | 1.462 | 2 | V | 24.11 | 22.82 | 697 | 1.190 | 0.604 | |
| 161 | 22 15 54.000 | -17 39 01.65 | 1.464 | 2 | V | 23.19 | 21.29 | 1149 | 1.457 | 0.739 | |
| 162 | 22 15 52.464 | -17 37 46.05 | 1.461 | 2 | V | 22.77 | 20.99 | 1.464 | 0.743 | ||
| 176 | 22 15 56.160 | -17 36 37.80 | 1.455 | 3 | V | 24.98 | 23.03 | 96 | 1.518 | 0.770 | |
| 203 | 22 16 05.400 | -17 38 17.48 | 1.465 | 3 | X | 22.75 | 859 | 1.663 | 0.844 | ||
| 232 | 22 15 51.648 | -17 37 11.74 | 1.461 | 3 | X | 24.07 | 20.77 | 1.839 | 0.933 | ||
| 264 | 22 16 02.448 | -17 39 53.46 | 1.456 | 2 | V | 21.12 | 2.075 | 1.053 | |||
| 292 | 22 15 57.960 | -17 40 20.35 | 1.465 | 3 | V | 22.17 | 19.36 | 2.301 | 1.168 | ||
| 301 | 22 16 02.424 | -17 40 09.08 | 1.475 | 2 | X | 22.67 | 2.308 | 1.171 | |||
| 303 | 22 15 54.864 | -17 40 12.97 | 1.475 | 2 | X | 23.71 | 2.341 | 1.188 | |||
| 358 | 22 16 09.504 | -17 38 26.16 | 1.461 | 3 | X | 23.81 | 2.651 | 1.345 | |||
| 371 | 22 16 09.888 | -17 38 26.41 | 1.459 | 2 | V | 20.67 | 2.742 | 1.392 | |||
| 400 | 22 15 58.944 | -17 41 01.28 | 1.470 | 2 | V | 23.41 | 21.33 | 2.982 | 1.513 | ||
| 439 | 22 16 10.296 | -17 36 22.96 | 1.463 | 3 | X | 23.54 | 3.264 | 1.656 | |||
| 494 | 22 16 10.728 | -17 40 24.31 | 1.463 | 3 | V | 23.43 | 22.42 | 3.751 | 1.904 | ||
| 505 | 22 16 04.104 | -17 34 23.37 | 1.474 | 3 | X | 23.41 | 3.889 | 1.973 | |||
| 883 | 22 15 50.832 | -17 29 09.45 | 1.458 | 3 | X | 22.54 | 9.070 | 4.603 |
Note. — Units of right ascension are hours, minutes and seconds, and units of declination are degrees, minutes, and seconds.
Service mode observations of J2215 were obtained using GMOS over the period UT 2009 August 23–September 23. GMOS was used in nod-and-shuffle mode (Glazebrook & Bland-Hawthorn, 2001), which allows both improved sky subtraction and shorter slit lengths compared to more conventional techniques. We used the R400 grating, which for our observations has dispersion 1.34 Å pixel-1 due to binning of the detectors. The OG515 order blocking filter was used, giving a nominal wavelength coverage of Å when used in combination with our chosen grating. One mask was observed, containing 34 target slitlets of length and width . A total of sec exposures were obtained, divided equally among three different central wavelengths (7500, 7550, 7600 Å), in order to obtain coverage over the gaps between the GMOS CCDs. We also varied the detector translation assembly offset by pixels in the -direction to mitigate against defects in the CCDs that cause artifacts in very deep nod-and-shuffle observations. The nod-and-shuffle cycle time of our observations was 120 sec, and our offset size was chosen such that the object was visible in the slit at both nod positions, to maximize the on-source integration time. Each of our 1920 sec exposures therefore consisted of 16 nod-and-shuffle cycles. The relevant observing constraints chosen for the queue mode observations were: 85%-ile image quality (i.e. seeing in the -band); and 50%-ile sky transparency (i.e. photometric conditions).
The data were reduced using routines from v1.8 of the Gemini IRAF333IRAF is distributed by the National Optical Astronomy Observatories, which are operated by the Association of Universities for Research in Astronomy, Inc., under cooperative agreement with the National Science Foundation.package. The data for each night and grating angle combination were processed separately. Briefly, the data were bias subtracted in the standard manner, sky subtracted (using the gnsskysub task), and then flatfielded. Data from individual chips were then mosaiced together, before being cut into separate FITS extensions corresponding to each slitlet using a custom written tool. Wavelength calibration was performed using a cross correlation technique, which was found to be accurate to 0.3 Å. All data were then combined using a median average, rejecting bad pixels using a mask constructed from nod-and-shuffle dark frames. Finally, the pairs of spectra corresponding to each nod position were combined appropriately and one-dimensional spectra were extracted using a simple boxcar algorithm.
4.2. Redshift Measurements
Redshifts were measured using a similar technique to that described in H07. Briefly, the spectra were cross correlated against a subset of the SDSS spectral templates444http://www.sdss.org/dr5/algorithms/spectemplates/index.html, plus the Luminous Red Galaxy template of Eisenstein et al. (2003), using the xcsao task in the rvsao IRAF package (Kurtz & Mink, 1998). All spectra were visually inspected to check the accuracy of the redshift solution; where the cross correlation redshift solution was clearly incorrect, the redshift was measured from visually identified spectral features. Due to the limited wavelength coverage of the SDSS templates at blue wavelengths in the rest frame at the cluster redshift, and the additional complication of residual sky emission at wavelengths approaching Å, most () of the redshifts for cluster members were measured by the visual inspection method rather than using the cross correlation method. However, the cross correlation technique is very efficient for measuring the redshifts of lower redshift galaxies, of which a significant number are contained in our masks, each of which typically targeted galaxies out to away from the cluster center.
Redshifts were assigned a quality flag according to the following scheme: (completely unambiguous, at least two positively identified spectral features); (high confidence that the redshift is correct, one clearly detected feature); (significant doubt that the redshift is correctly identified, one or more weakly detected features). As discussed below, a significant fraction of the cluster members are identified as 3727 Å [O ii] emitters, including 15 objects with rather than redshifts. Although the redshifts of these objects are in most cases determined from a single emission line, we are reasonably confident that the line identification is correct, as no emission lines are seen blueward down to Å.
A total of 16 objects now have multiple reasonably secure redshift measurements () across different slit masks. We adopt the rms scatter of the residuals between these multiple redshift measurements as our estimate of the total (i.e. random+systematic) redshift error, finding . We list the redshifts of all galaxies found within km s-1 of the recession velocity corresponding to the cluster redshift of in Table 2. A total of 44 galaxies now have redshifts in the range , an increase of 26 galaxies over the catalog presented in H07.
Approximately two thirds of the galaxies for which spectroscopic redshifts have been obtained show 3727 Å [O ii] emission (see Table 2). This includes 13 galaxies located within a projected distance of kpc from the cluster center, and implies that a significant amount of star formation could be taking place even in the inner regions of the cluster, which is not found to be the case in lower redshift clusters. However, several studies have shown that [O ii] emission is often not due to star formation at high redshift, and is instead associated with Seyfert-type AGNs or Low Ionization Nuclear Emission Line Regions (LINERs; Heckman, 1980), which can also be found in otherwise passively evolving galaxies (Yan et al., 2006; Lemaux et al., 2010). A significant fraction of [O ii] emitting galaxies in the cluster core has also been found by Hayashi et al. (2010), using narrow band imaging that reaches to an [O ii] flux limit erg s-1 (corresponding to equivalent width Å), allowing galaxies with SFR M☉ yr-1 to be detected. Hayashi et al. (2010) report that % of the cluster members within a projected distance of 250 kpc from the cluster center are [O ii] emitters. Given the heterogeneous nature of our spectroscopic target selection, and the potential for selection biases (for example, the relative ease of identifying [O ii] emission at the cluster redshift compared to securing redshifts for passively evolving member galaxies), it is unfortunately not possible to infer the fraction of star forming galaxies within the cluster based on our spectroscopic data alone.
4.3. Cluster Line of Sight Velocity Distribution

We plot the velocity distribution of all 44 galaxies with redshifts listed in Table 2 in Figure 4. Calculating the velocity dispersion for the whole sample of 44 galaxies using a biweight scale estimator (Beers et al., 1990), and applying the Danese, de Zotti, & di Tullio (1980) correction for broadening of the distribution due to redshift measurement errors (see Section 4.2 above), we measure the line of sight velocity dispersion to be km s-1. However, this includes galaxies located up to Mpc away from the cluster center, and not all galaxies at large radial distances may be gravitationally bound to the cluster. Using the iterative method of calculating and from the redshift data as described in H07, we obtain a lower value of km s-1 using only the 31 galaxies within , which we estimate to be Mpc. We estimate the cluster redshift to be by applying the biweight location estimator to this galaxy sample, in agreement with the result of H07. We highlight the velocity distribution corresponding to this membership selection in Figure 4.
The value of quoted here is higher than the value of km s -1 estimated using the smaller redshift catalog presented in H07, but agrees with the previous measurement at better than . In H07, we noted a discrepancy between the temperature implied by the galaxy velocity dispersion and the X-ray temperature measured in S06, suggesting that the cluster gas has 2–3 times the kinetic energy of the cluster galaxies. The joint XMM-Chandra spectroscopic X-ray analysis presented in Section 2 now reconciles the velocity and X-ray measurements: for km s-1, the predicted X-ray temperature is keV, compared to the revised X-ray measurement of keV, and therefore agrees at . The cluster lies on the relation expected if there is equipartition of gravitational potential energy between the gas and the galaxies following this revised analysis.
In H07, we also presented mild evidence that the cluster velocity distribution is bimodal, and it is clear from inspection of Figure 4 that the additional redshift data has not erased this signal. We performed the Hartigan & Hartigan (1985) test of unimodality using the sample of 31 galaxies within as estimated above, measuring the value of the dip statistic to be 0.0668. Simulations show that the probability to exceed this dip value when drawing from a Gaussian distribution with equal to the measured line of sight velocity dispersion is . Therefore, the expanded spectroscopic catalog does not strongly favor a bimodal velocity distribution using this sample. We also used the KMM algorithm (Kaye’s Mixture Model; Ashman, Bird, & Zepf, 1994) to test for bimodality. This algorithm tests whether a mixture of Gaussian distributions is a better description of a given population than a single Gaussian. For , we found that the sample of 31 galaxies within does not favor a bimodal Gaussian distribution (), and this remains the case when considering galaxy samples out to larger radius.
We conclude that despite the significantly increased size of the redshift catalog, there is no clear evidence from the velocity distribution that the cluster consists of two kinematically distinct structures. However, the fact that the Hartigan & Hartigan (1985) dip test still mildly favors a bimodal distribution suggests that the cluster may not be completely relaxed.
5. Mid-IR Observations
5.1. Data Reduction and Photometry
J2215 was observed at 24 using MIPS on 2008 June 21 as part of the same program that obtained the IRAC observations described in Section 3.1. The angular resolution of MIPS is , which corresponds to a physical scale of 51 kpc at the cluster redshift in our adopted cosmology. A total of 60 frames each of 30 sec integration time were obtained using a large field size dither pattern of 15 cycles centered on the cluster. The basic calibrated data (BCDs) as processed by the Spitzer Science Center were corrected for the effects of bright and dark latents, gradients, and the “jailbar” effect using a flatfield calibration generated from the data itself. The calibrated data were then mosaiced together using the MOPEX package (Makovoz & Khan, 2005) to produce a final image at 1.25 pixelization roughly centered on the cluster position. A significant fraction of the pixels in the top left corner of many of the individual BCD frames were flagged as suffering from soft saturation, amounting to % of the total data collected. These pixels were rejected in the mosaicing process and are therefore not included in the final science frame. Consequently, the noise level is higher in this region, which is located away from the cluster position towards the North East. As a result, the median exposure time in the final mosaic is reduced to sec per pixel, although the exposure time over % of the mosaic, including the cluster center, is sec per pixel.
Photometry was performed using the APEX package (Makovoz & Marleau, 2005), where we adopt Point Response Function (PRF) fitted fluxes as measurements of the total source flux, since at the cluster redshift the member galaxies are unresolved by MIPS. The PRF model used was estimated from point sources detected at in an initial pass over the mosaic. We checked that the PRF estimate was of sufficient accuracy by visual inspection of a residual image in which all detected point sources had been subtracted. Our final 24 catalog contains a total of 152 sources detected at .
We checked the flux detection and completeness limits of our 24 mosaic using simulations. We inserted 10 artificial point sources, covering a wide range in flux, at random positions in the point source subtracted mosaic (which should have the same noise properties as our science mosaic), and attempted to recover them using the same extraction procedure used to make the catalog from the science mosaic. This process was repeated 300 times. We estimate that the 50% completeness limit of our observations is approximately 70 Jy on the basis of these simulations. Using the Dale & Helou (2002) spectral templates, this translates into a corresponding infrared luminosity limit of at the cluster redshift. Assuming the Kennicutt (1998) law, this implies that we will detect cluster members with SFR M☉ yr-1 (see Section 6 below) at this completeness level. Thus, we are only able to detect starburst galaxies at the cluster redshift.
5.2. Source Matching
We cross matched the 24 catalog against the optical and near-IR catalogs described in Section 3, using a 2 matching radius (Bai et al., 2007). For some objects, multiple possible counterparts were identified within the matching radius; we adopt the nearest source as the match where this occurs. Matches were found for a total of 118 24 sources in this process. We estimated the probability of spurious matches by randomizing the positions of all the 24 sources in the catalog and repeating the cross matching procedure. We estimate a % chance of a given 24 source being randomly associated with an optical/near-IR source, following 100 trials.

Our interest is restricted to sources identified as cluster members, and we find that a total of four objects in the spectroscopic redshift catalog (Table 2) are associated with 24 detections. All of these objects show some evidence of [O ii] emission in their spectra. We supplement this sample with a further four objects identified as being cluster members through their photometric redshifts (see Hilton et al., 2009, we assume these objects are all at ). The typical scatter in the photometric redshift residuals (, where and are the spectroscopic and photometric redshifts respectively) is (Hilton et al., 2009). Note that one object thought to be a spurious detection has been removed from this sample after visual inspection of all cluster members. None of the objects in this sample have alternative optical/near-infrared counterparts within the 2 matching radius used.
In addition to these objects, we found that there is a very prominent, bright (2399 Jy) 24 source located away ( Mpc at ) from the cluster center that is not included by the above sample selection criteria. It has an insecure () spectroscopic redshift that hints it could be a cluster member, and in addition, is not unambiguously identified with a single optical/near-infrared object: an object with a photometric redshift consistent with cluster membership from the H09 catalog is also located within the matching radius. Furthermore, the local environment of this object is somewhat crowded, as Figure 5 shows; there are two other galaxies within that were selected as photometric members of the cluster in the H09 catalog. This suggests that the source is likely to be physically associated with the cluster. We will refer to this object (SSTU J221559.68-173758.9) as the ‘unconfirmed source’ in the following discussion of the nature of the sources. It is possible that both of the candidate optical/near-infrared counterparts of this object contribute to the measured 24 flux.
We also cross matched the MIPS source list against the X-ray point sources identified in our Chandra observations (Section 2, above). We find that none of the 24 sources associated with cluster members are X-ray sources. However, one bright 24 source with flux density Jy (SSTU J221600.14-173836.8) is associated with the Chandra source PS3 (see Table 1), which is located only from the cluster center. As mentioned in Section 2.1, this object is likely to be a high redshift () obscured AGN behind the cluster.
6. Nature of the Cluster X-ray and Mid-infrared Sources
6.1. Infrared Colors
Re-radiation by dust is the source of the 24 flux from the cluster mid-infrared sources, but this emission can be powered primarily by either star formation or AGN. Studies of both the field (e.g. Pérez-González et al., 2008b) and lower redshift clusters (e.g. Geach et al., 2006; Marcillac et al., 2007) suggest that % of the 24 emitters are likely to be powered by AGN rather than star formation; here we perform some simple tests to determine the nature of the sources in J2215.
Luminous ( erg s-1) X-ray point sources are powered by AGN rather than starburst activity (e.g. Georgakakis et al., 2007). As mentioned above (Section 5.2), none of the sample of 24 emitting cluster members are associated with X-ray point sources detected in our Chandra data, which reaches a limiting flux of erg s-1 cm-2 (roughly corresponding to erg s-1 at the cluster redshift, assuming spectral index and cm-2).
| SSTU | Alt. IDaaThe ID number in this column corresponds to the ID given in Table 2 for objects with spectroscopic redshifts. For objects with photometric redshifts and SSTU J221559.68-173758.9, this ID number corresponds to that in the catalog of Hilton et al. (2009). | CE01 | CE01 SFR | DH02 | DH02 SFR | r | |
|---|---|---|---|---|---|---|---|
| (Jy) | ( L☉) | (M☉ yr-1) | ( L☉) | (M☉ yr-1) | (Mpc) | ||
| Spectroscopic members: | |||||||
| J221557.24-173753.2 | 35 | 159 10 | 9.0 | 160 | 7.7 | 130 | 0.17 |
| J221556.92-173804.7 | 39 | 98 9 | 5.6 | 100 | 4.7 | 80 | 0.19 |
| J221600.38-173750.5**This object is more likely to be an AGN rather than a star forming galaxy, based on its IRAC colors (see Section 6.1). | 53 | 159 9 | 9.0 | 155 | 7.7 | 131 | 0.25 |
| J221609.88-173826.4 | 371 | 93 9 | 5.3 | 90 | 4.5 | 80 | 1.39 |
| J221558.94-174101.2 | 400 | 122 12 | 7.0 | 120 | 6.0 | 100 | 1.51 |
| Photometric members: | |||||||
| J221558.22-173822.1 | 899 | 108 9 | 6.2 | 110 | 5.2 | 90 | 0.17 |
| J221556.80-173721.9 | 529 | 244 10 | 13.9 | 240 | 11.8 | 200 | 0.40 |
| J221554.62-173855.0 | 1118 | 73 9 | 4.2 | 70 | 3.5 | 60 | 0.65 |
| Unconfirmed sources: | |||||||
| J221559.68-173758.9 | 744/747 | 239 9 | 13.7 | 240 | 11.6 | 200 | 0.15 |
Note. — Columns labelled CE01 have quantities derived using the Chary & Elbaz (2001) spectral templates; likewise, quantities in columns labelled DH02 are calculated using the Dale & Helou (2002) templates. The minimum and maximum derived infrared luminosities from each template library are quoted as the error bars on and SFR.
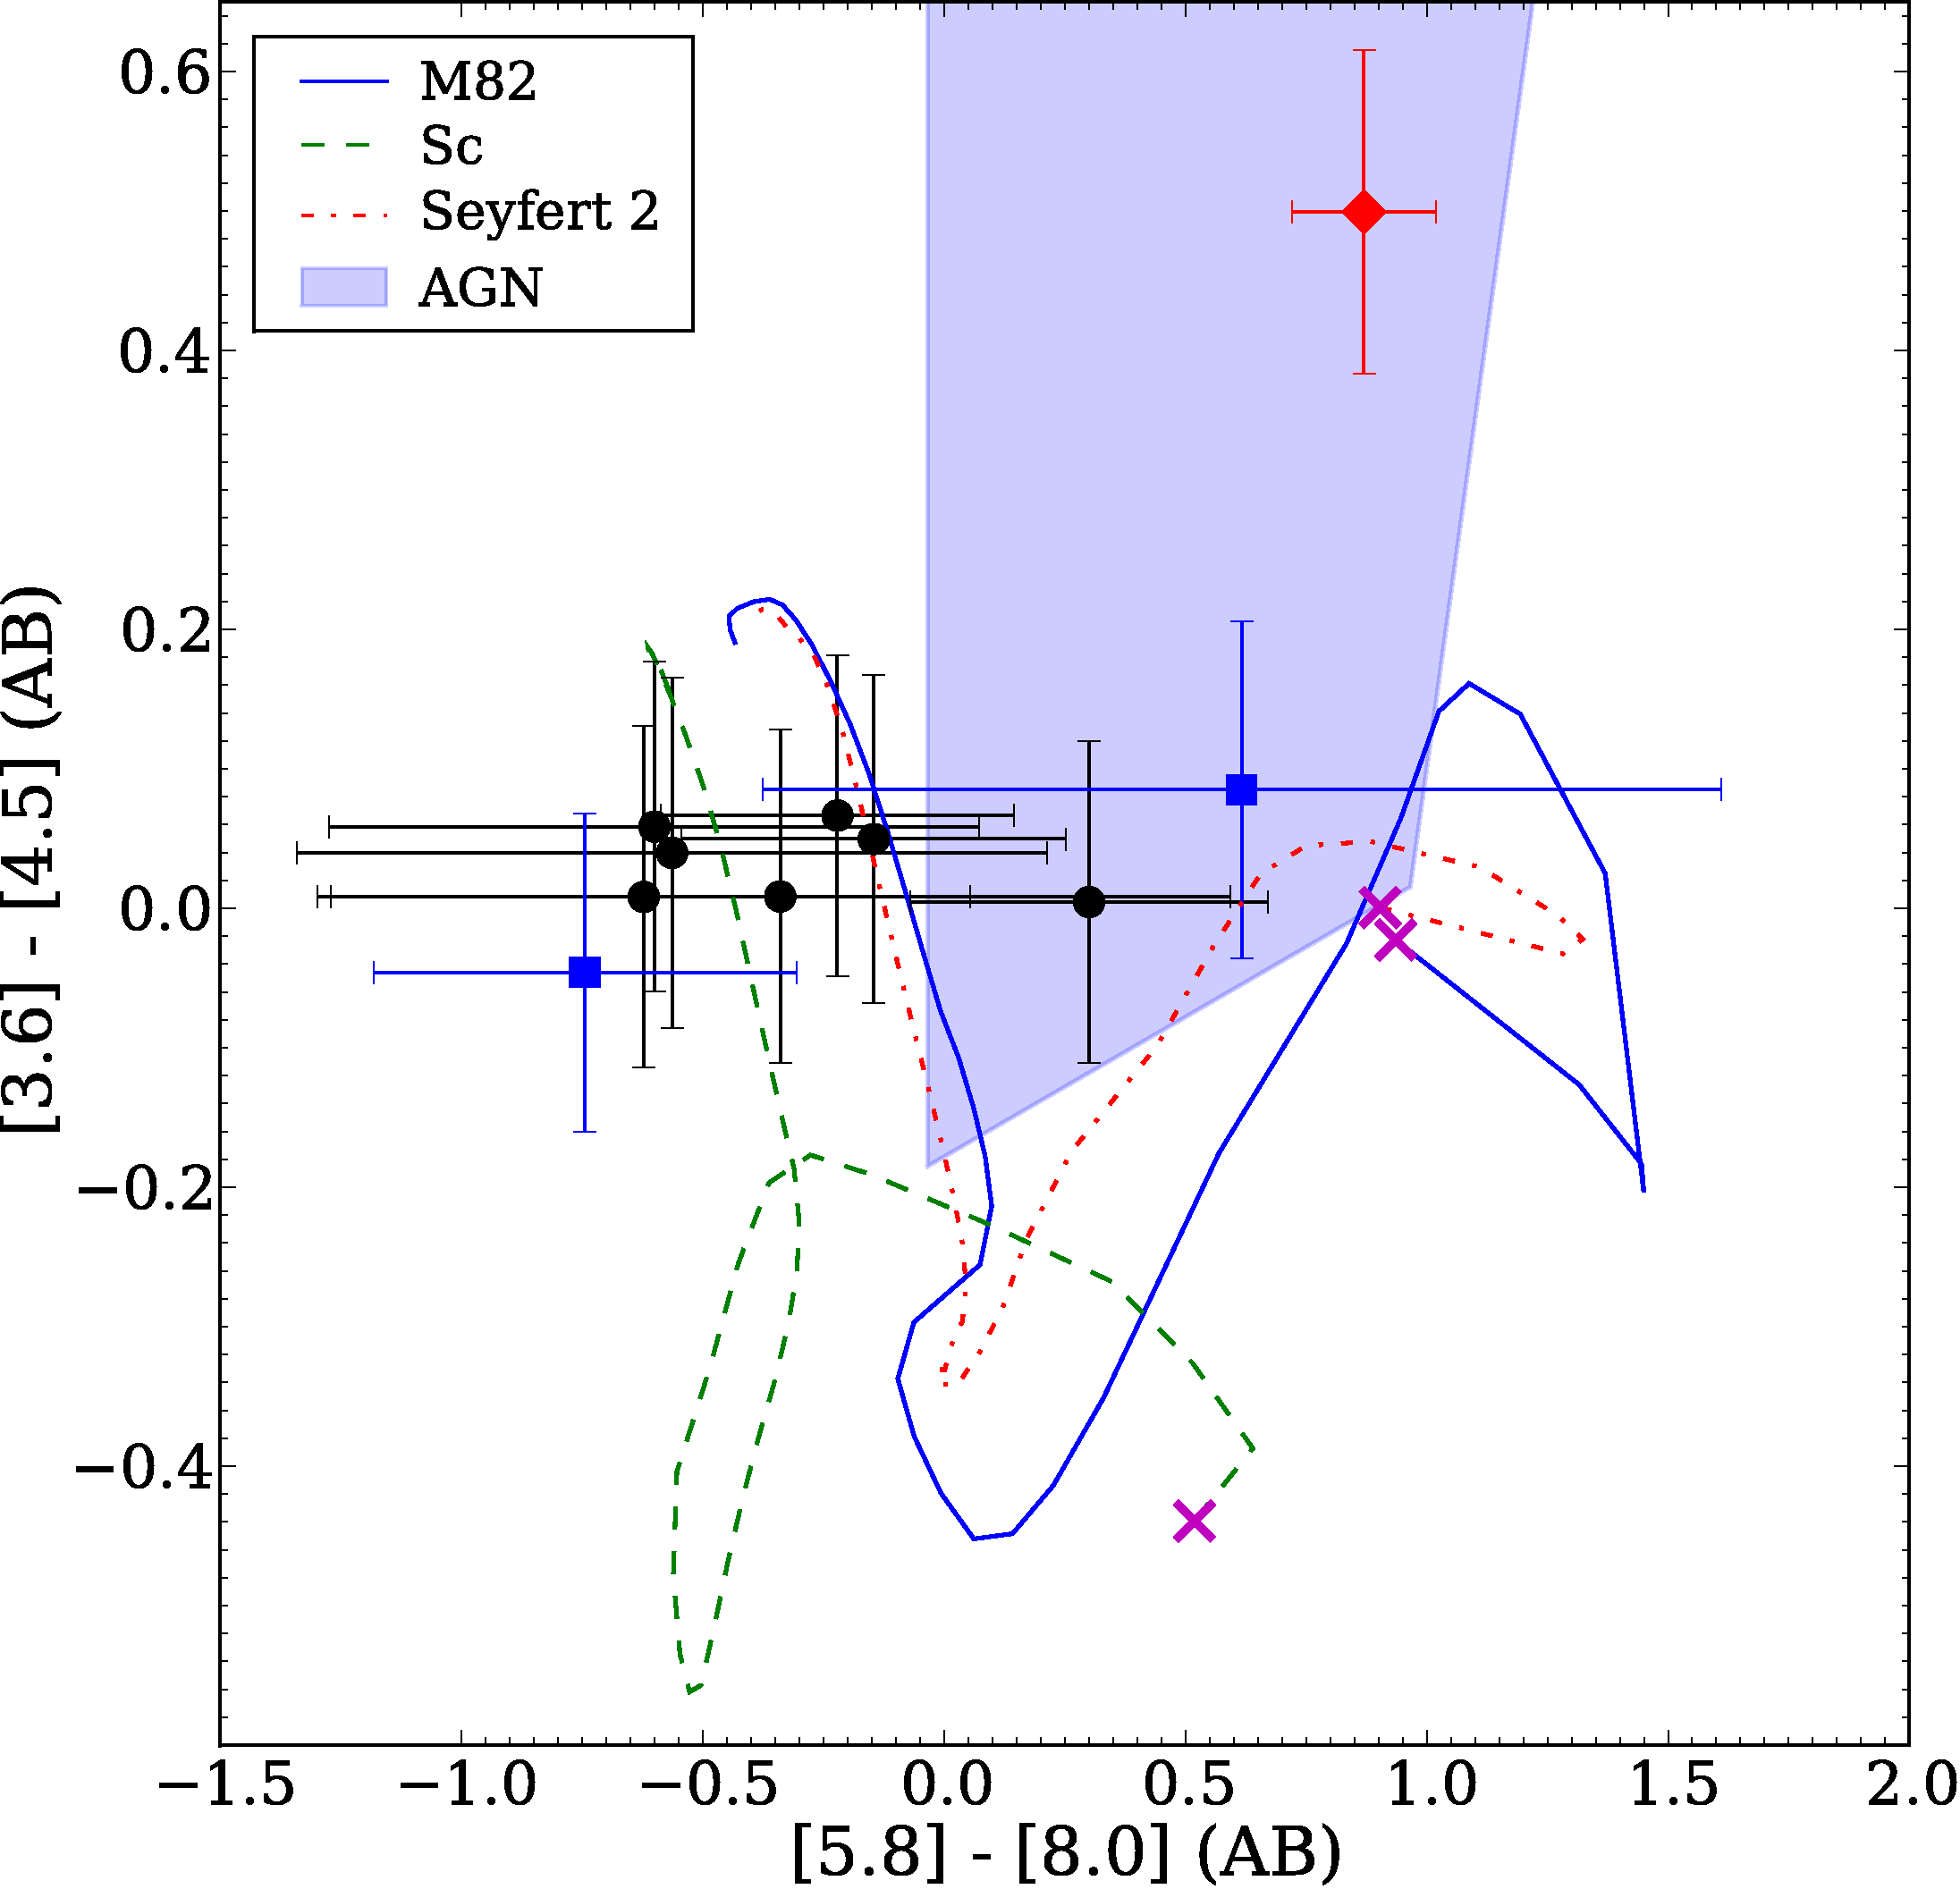
Another way to identify AGN is through their infrared colors (Stern et al., 2005). Figure 6 shows the [3.6]-[4.5], [5.8]-[8.0] color–color plot of the 24 emitting cluster members. Unfortunately, the uncertainties on the [5.8]-[8.0] colors are large: the mean error is mag, which limits our ability to draw firm conclusions from this test. This is driven by the fact that only three of the 24 sources are detected at in the 8.0 channel. One source (SSTU J221558.94-174101.2) is not detected at either 5.8 or 8.0 . We overplot in this figure the non-evolving tracks of several spectral templates taken from the library of Polletta et al. (2007). The shaded area shows the region of color–color space occupied primarily by broad-lined AGN according to the criteria of Stern et al. (2005). Figure 6 shows that only one of the cluster 24 sources falls within this region (SSTU J221600.38-173750.5). The other 24 sources have colors consistent with star forming galaxies at this redshift.
We also plot the positions of the X-ray point sources identified in the Chandra data (Section 2) in Figure 6. The source which is detected in both the X-ray and 24 data is very red in [5.8]-[8.0] color, consistent with it being an obscured, high redshift AGN. Of the two Chandra sources that are spectroscopically confirmed cluster members, one lies inside the QSO region of color–color space, whereas the other has similar colors in the IRAC bands to the cluster 24 sources. However, as with the 24 sources, the color uncertainties are large.
The IRAC colors do not allow us to distinguish between normal galaxies and narrow lined AGN such as the Seyfert 2 class, as shown by the template tracks in Figure 6. However, galaxies of this class are often host to significant star forming activity, generally being dominated by signatures of star formation at optical and infrared wavelengths (e.g. Della Ceca et al., 2001; Cid Fernandes et al., 2004; Panessa et al., 2005).
6.2. Star Formation
We now proceed to estimate infrared luminosity () derived star formation rates for cluster 24 sources that were not classified as AGN due to either their infrared colors or the presence of X-ray emission. We include the ‘unconfirmed source’ (SSTU J221559.68-173758.9, Section 5.2 above and Figure 5) and the source undetected in the 5.8 and 8.0 channels (SSTU J221558.94-174101.2) in this sample. We first derive 8-1000 luminosities () from the measured 24 flux densities using the full range of templates in the libraries of Chary & Elbaz (2001) and Dale & Helou (2002). Throughout this analysis we treat each template library independently. Because we lack the longer wavelength data needed to constrain the SEDs, we take the median value derived from each template set as the best estimate of , and adopt the minimum and maximum values of as error bars. These systematic errors dominate over the random error due to uncertainty in the 24 flux measurements. The values are then converted into star formation rates using the Kennicutt (1998) law. The derived infrared luminosities and star formation rates for each cluster galaxy in the sample are listed in Table 3.
As Table 3 shows, all of the 24 sources in J2215 can be classified as Luminous Infrared Galaxies (LIRGs; galaxies with ), and have very high star formation rates, typically M☉ yr-1. If the unconfirmed 24 source (Section 5.2 above) is actually a cluster member, it is an Ultra Luminous Infrared Galaxy (ULIRG; ) – although this luminosity may be overestimated somewhat due to the presence of a neighboring galaxy within (Figure 5). Neglecting the unconfirmed 24 source, there are three objects at projected clustercentric radii kpc with very high SFRs, and so intense star formation may be taking place in the heart of the cluster, as also hinted at by the narrowband [O ii] imaging of Hayashi et al. (2010). Studies of the environmental dependence of star formation rate in the field have shown that SFR actually increases with increasing local galaxy density at , whereas the opposite trend is observed in the local universe (Elbaz et al., 2007; Cooper et al., 2008). However, these studies also show that the SFR falls off beyond a critical peak galaxy density. There is Gyr difference in look back time between the redshift of J2215 and , and so perhaps it is possible that we are seeing the peak of the local density–SFR relation shift to higher densities as redshift increases.
The median values of and SFR that we estimate for each galaxy are consistent between both the template libraries of Chary & Elbaz (2001) and Dale & Helou (2002), although we note that the upper limit of and SFR estimated using the Dale & Helou (2002) templates is significantly higher. It is possible that the lower limit on the values in Table 3 may be overestimated, if neither of the template libraries, which are based on observations at considerably lower redshift, are representative of galaxies at . Murphy et al. (2009) show that this is likely to be the case from mid-infrared spectroscopic observations of galaxies in this redshift regime. In particular, the equivalent widths of features due to polycyclic aromatic hydrocarbons (PAHs) seem to be underestimated by the Chary & Elbaz (2001) templates compared to observed high redshift galaxies, and for galaxies with M☉ and this leads to an overestimate of by a factor when is derived from 24 data alone. For J2215 at , a broad PAH feature at 8.6 is redshifted into the MIPS 24 band, and so this may be an issue for the measurements reported in Table 3. Longer wavelength data (e.g. at 70 ) are required to investigate this issue further, and it has been shown that such data significantly improves the constraints on inferred from template fitting, particularly at high redshifts (see Figure 2 of Murphy et al. 2009).
Other lower redshift studies have used 24 observations to quantify the fraction of star forming galaxies in clusters, finding to increase from % at to % by (e.g. Saintonge et al., 2008; Haines et al., 2009a). Given the depth of our 24 observations, and the fact that sample definitions used to estimate vary, we are only able to attempt a very rough estimate of in J2215. We find % for galaxies within and brighter than in the galaxy luminosity function, using only galaxies with (i.e., SFR M☉ yr-1) to define the star forming sample. Note that we exclude the ‘unconfirmed source’ (SSTU J221559.68-173758.9) in making this estimate. The higher cut in used here compared to that used in e.g. Haines et al. (2009a) to define ( ) suggests that the star forming fraction in J2215 may be even higher, if an equivalent, lower cut in was used.
6.3. Optical Properties
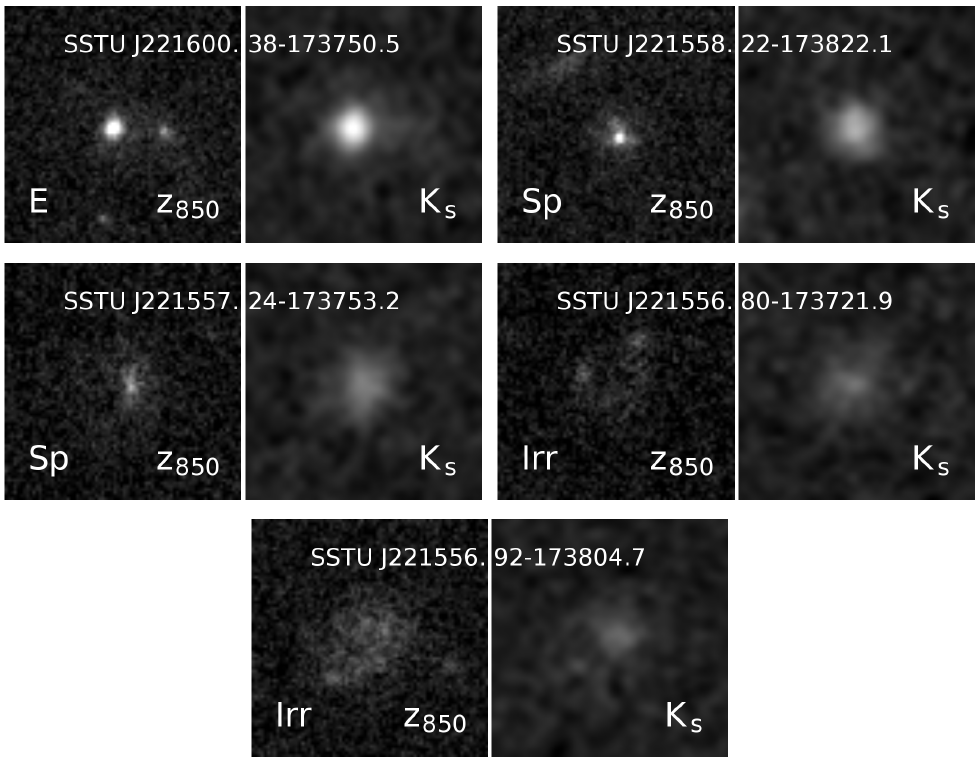
Using the catalog from H09, we can investigate the optical properties of the six 24 emitting cluster galaxies within , in addition to the objects detected in the Chandra X-ray observations. Figure 7 shows the color–magnitude diagram of the cluster with the 24 cluster members highlighted. Three of these galaxies are within of the cluster red-sequence. Lower redshift studies have also found a significant number of 24 emitting, presumably star forming, cluster members close to the red-sequence, and that the contribution of these galaxies to the total star forming population in clusters increases with redshift (Saintonge et al., 2008). However, the brightest of these objects in J2215 is likely to be an AGN based on its infrared colors (SSTU J221600.38-173750.5, see Section 6.1 above). This object was also morphologically classified as an elliptical galaxy by H09. All of the other 24 sources, which are most likely powered predominantly by star formation, have late-type morphologies (spiral or irregular; see Figure 8).
The two possible optical counterparts to the unconfirmed 24 source (SSTU J221559.68-173758.9, Figure 5) are highlighted in Figure 7. These objects are both slightly redder than the cluster red-sequence, but lie within of it, and were morphologically classified as late type galaxies by H09. If this source is truly within the cluster, it is therefore likely to be an example of a red-sequence galaxy with high SFR.
We also plot the positions of the X-ray sources in Figure 7. The cluster member X-ray sources (PS1 and PS2; Section 2) are both within of the red-sequence, whereas the high redshift, obscured QSO in the background of the cluster is considerably bluer than the red-sequence.

6.4. Stellar Population Modelling and Specific Star Formation Rates
We investigated the stellar populations of the 24 sources located within by fitting their broadband spectral energy distributions (SEDs) to the models of Bruzual & Charlot (2003). We combined the IRAC photometry (Section 3.1 above) with the rest-frame optical photometry presented in H09, using the SExtractor MAG_AUTO magnitudes in the latter case as estimates of total magnitude. Note that the cross matching between the IRAC and the selected catalog described in Section 3.1 showed that each of the six 24 sources is uniquely associated with a single corresponding object across both catalogs. However, the IRAC photometry for one object (SSTU J221558.22-173822.1) suffers from blending with another galaxy away. The blended galaxy is mag fainter at , and so we expect that this should lead to only a small overestimate of the stellar mass of this object.
We followed a similar approach to Shapley et al. (2005) in performing the SED fitting. We use a grid of solar metallicity models with exponentially declining star formation histories with 20 values of in the range 0.1–20 Gyr, and 50 ages in range 0.001–4 Gyr, i.e. constrained such that the maximum allowed age is less than that of the universe at . We adopt a Chabrier (2003) Initial Mass Function (IMF). We include the effect of dust extinction using the Calzetti et al. (2000) law, allowing the value of to vary between 0.0–0.5 in steps of 0.02. We fitted the SEDs by analytically calculating the normalization for each model SED where , adopting the model with the lowest value as the best fit. The stellar mass is then estimated from the value of . We therefore fit for a total of four parameters (age, , , ).
We estimated the errors on parameters through Monte-Carlo simulations; we generated 1000 fake SEDs for each object by replacing each flux measurement with a random variate drawn from a Gaussian distribution consistent with the observed photometric uncertainties, and fitted them using the same method used for the real data as described above. We adopt 68.3-%-ile confidence intervals as our error estimates, measured as the corresponding fraction of the fits to the Monte-Carlo realizations.

Figure 9 shows the results. The SEDs of the 24 emitting cluster members are in most cases best fit by young (age Myr) stellar populations, with large dust extinction values (). However, there are many degeneracies between the fitted parameters (such as between and ; see the discussion in e.g. Shapley et al., 2005) and different stellar population models yield systematically different results; for example, if we instead fit the SEDs using the Maraston (2005) models, we generally obtain higher values and younger ages. We note that in most cases the reduced values indicate that the fits are not especially good. The worst case (J221600.38-173750.5 with ) was classified as an AGN based on its infrared colors (see Section 6.1 above), and so the poor fit for this object is not surprising.
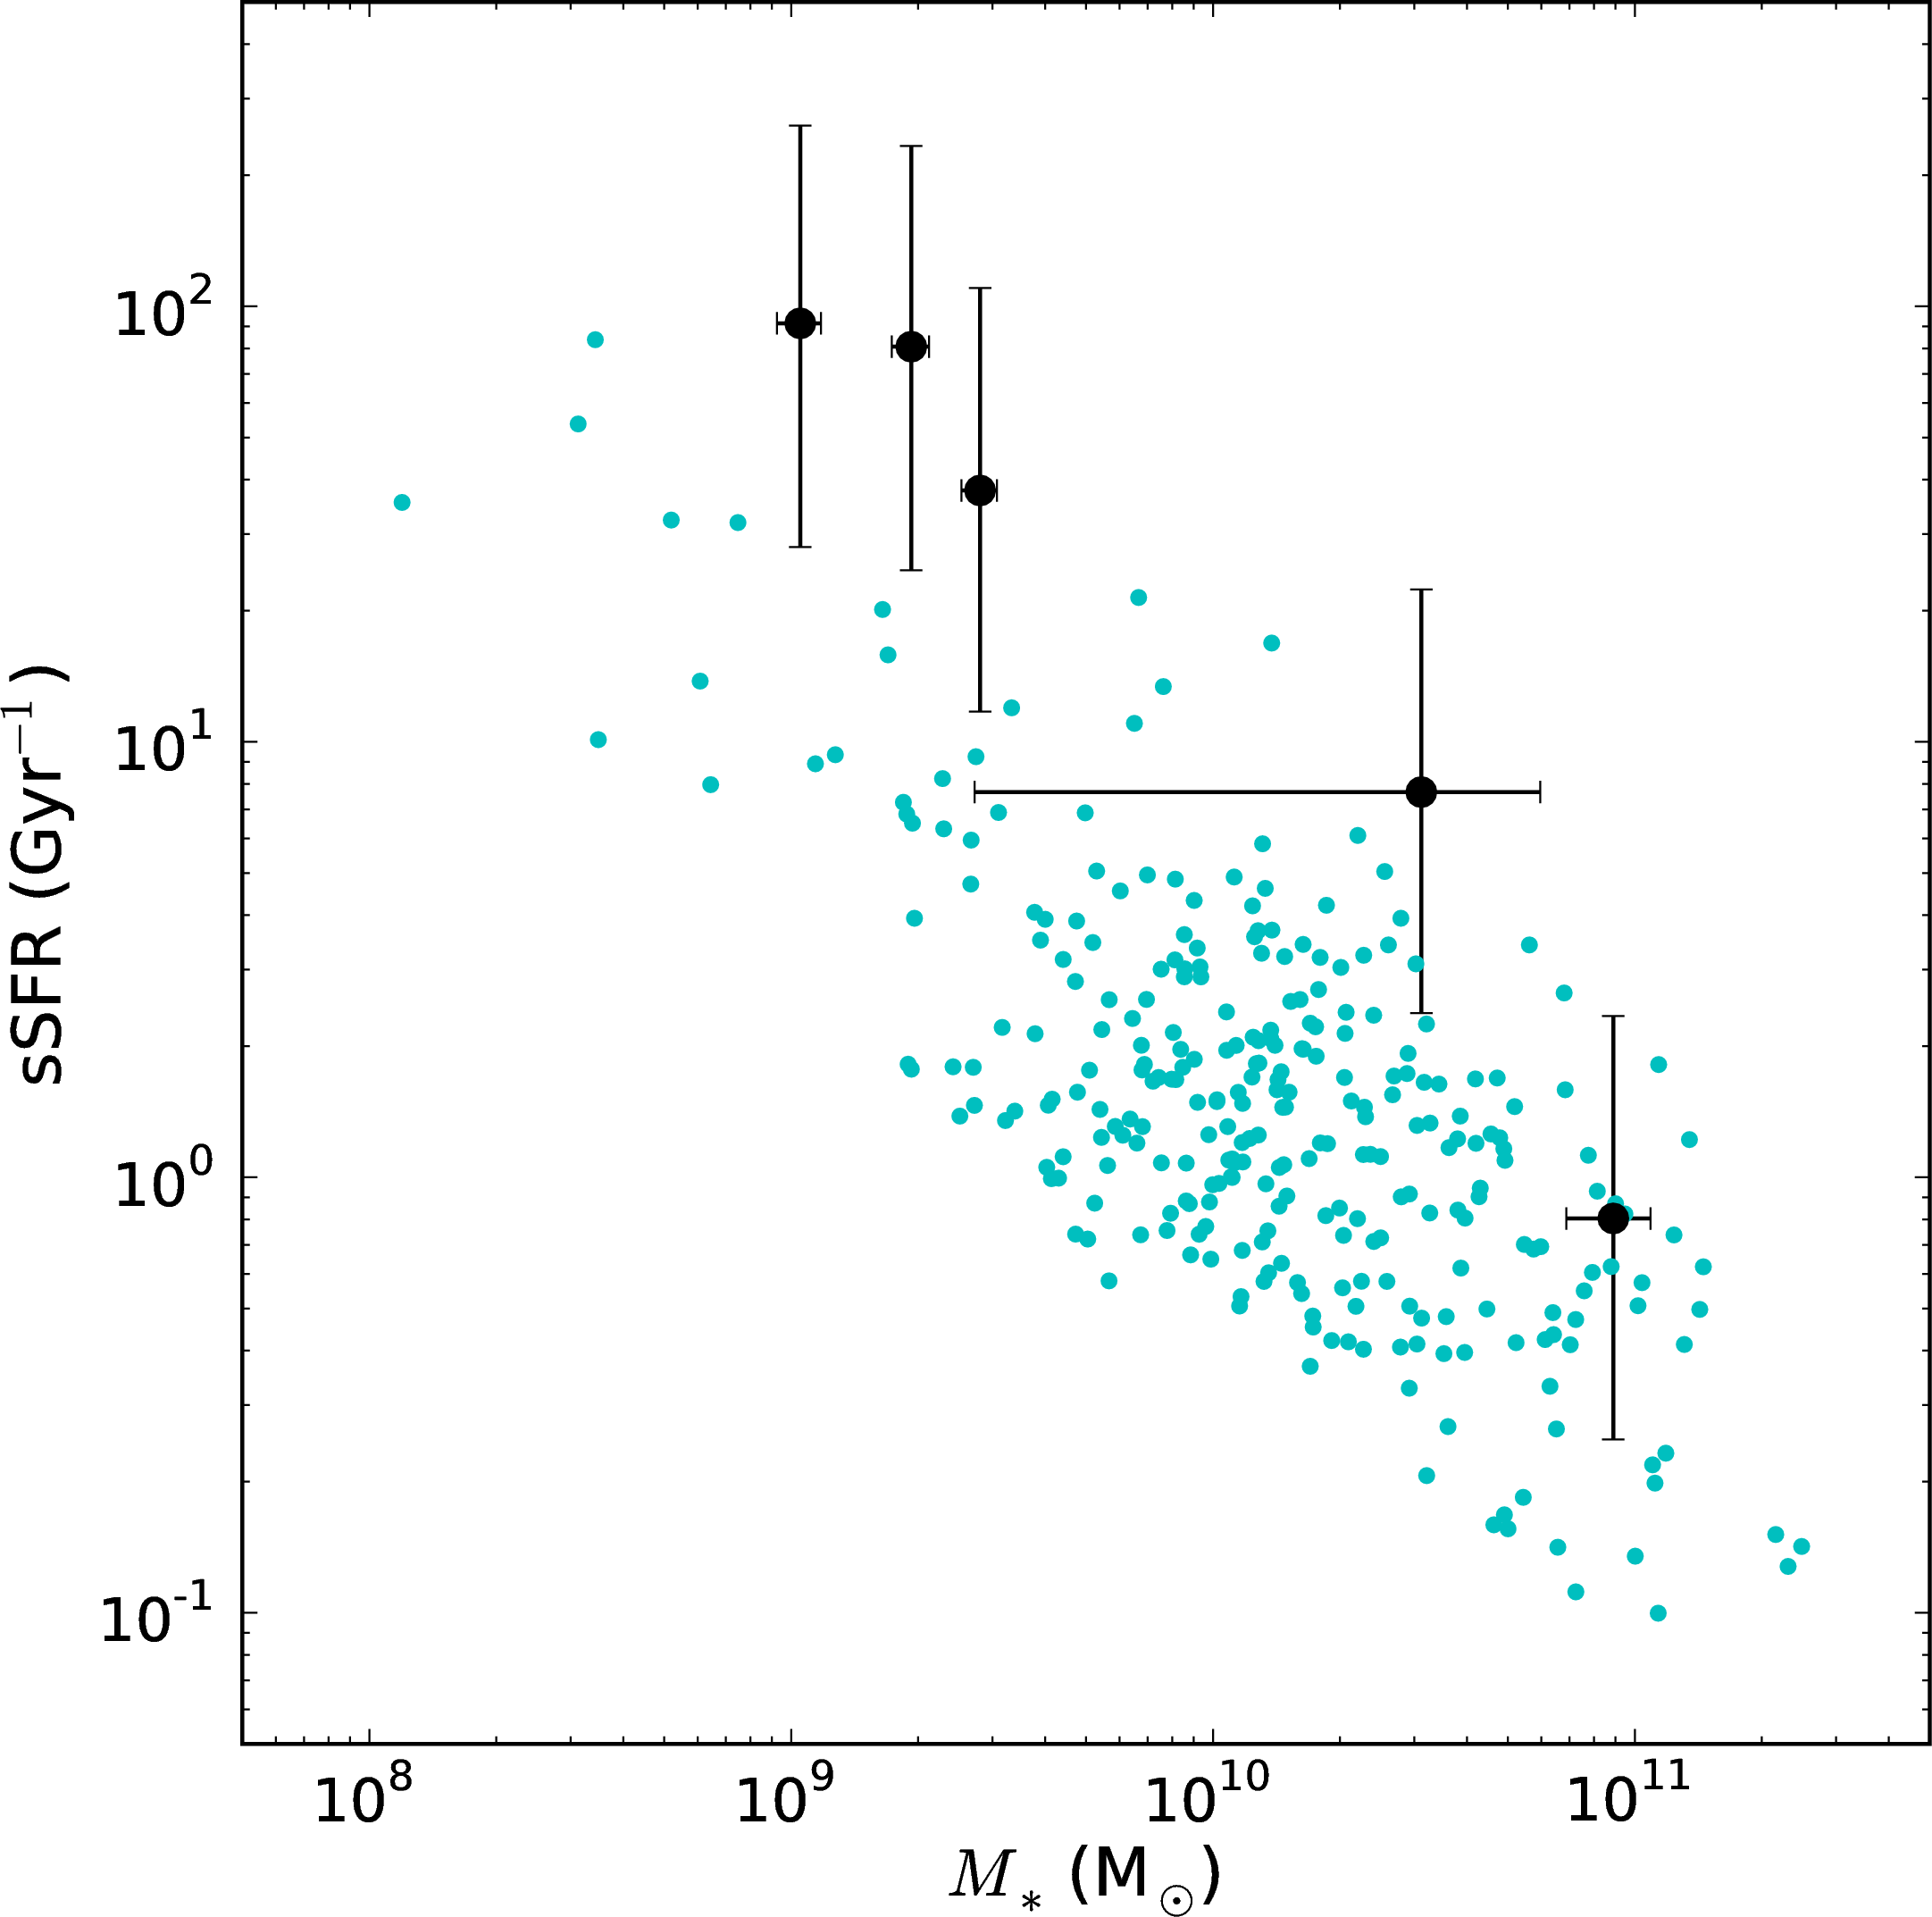
A number of authors have found that SED-based stellar mass estimates are reasonably robust, despite degeneracies between other stellar population parameters (e.g. Shapley et al., 2005; Muzzin et al., 2009). We used the stellar mass measurements derived from the SED fitting to estimate specific star formation rates (sSFR) for the cluster 24 sources. Figure 10 shows the results. Despite the very small sample size, we recover the well known result that the lowest mass galaxies are building up their stellar mass most rapidly, having the highest sSFRs. The cluster 24 sources follow a similar sSFR– relation to that measured in the field at (e.g. Santini et al., 2009), although the sSFRs of the cluster sources appear to be biased high compared to the field sample. However, the field galaxy sample contains relatively fewer objects at compared to the low end of the sample redshift range, and the locus of the relation moves upward in Figure 10 as redshift increases. It is also possible that the cluster galaxy SFRs, which are derived from the 24 fluxes alone, may be overestimated (see the discussion in Section 6.2).
7. Discussion
7.1. The Impact of Unresolved Point Sources On High-Redshift X-ray Cluster Surveys
As the results of this paper show, the presence of emission from unresolved point sources in X-ray observations of high-redshift clusters of galaxies can lead to significant biases in temperature measurements if unaccounted for. As cosmological analyses of X-ray cluster surveys rely on temperature as a mass proxy, the increase in the X-ray AGN population with redshift is therefore likely to also bias any cosmological interpretation that includes such high redshift objects. This issue is not likely to affect XCS, as it is planned to exclude clusters from the cosmological analysis, as few such systems will be detected (Sahlén et al., 2009). However, this may be an issue for larger scale, low resolution X-ray surveys such as the upcoming all-sky eROSITA mission (Predehl et al., 2010), which will detect tens of thousands of galaxy clusters out to , including at . To extract the full cosmological information from this sample will therefore require either a follow-up program of high resolution pointed observations of detected high redshift clusters, or could alternatively perhaps be addressed statistically, using the existing data in the Chandra archive to derive the amount of contamination by AGN in clusters as a function of redshift (e.g. Martini et al., 2009; Gilmour et al., 2009).
7.2. Star Formation in High Redshift Galaxy Clusters
The results of our analysis suggest that the core of J2215 may contain galaxies with very high SFRs, as 24 sources which are likely to be powered by star formation are found within projected distances of kpc of the cluster X-ray position. Significant star forming activity in the cluster core is also suggested by the narrowband [O ii] observations by Hayashi et al. (2010), which are sensitive to galaxies with lower SFRs ( M☉ yr-1) than is probed by our MIPS observations.
Studies of clusters at lower redshift have revealed a significant amount of obscured star formation in clusters; however, this activity seems to take place mostly in the infall regions, and not in the cluster cores (Geach et al., 2006; Marcillac et al., 2007; Saintonge et al., 2008; Haines et al., 2009a; Koyama et al., 2010). This suggests that triggered star formation, driven by the interaction of infalling galaxies with the cluster potential, is one of the main channels for transforming star forming, late type galaxies in clusters into passively evolving early type galaxies. In this scenario, the gas within infalling galaxies is compressed upon entering the cluster, leading to a burst of star formation which rapidly uses up the available gas reservoir, eventually leading to star formation being quenched. If this is the general case, then why are high SFRs observed in the center of J2215?
Perhaps environmental differences between clusters are responsible, as the amount of star formation in clusters is seen to vary significantly from cluster to cluster (e.g. Geach et al., 2006). At low redshift, there are hints that the dynamical state of the cluster plays a role. Braglia et al. (2009) examined star formation in two clusters of opposite dynamical state: one of their targets was a relaxed, cool core cluster, while the other appears to be a merger. They found a significantly increased fraction of star forming galaxies within in this latter system. Similarly, Haines et al. (2009b) examined star formation in the merging system A1758 at , finding significant dust obscured star formation taking place within kpc of the core of one of the components of this system, suggesting that cluster mergers can trigger star formation in cluster galaxies.
Although J2215 is not resolved into two kinematically distinct components with the current spectroscopic sample of members (Section 4.3, above), the limited data currently available hints that the cluster may be dynamically somewhat disturbed. In addition to the cluster velocity distribution, the cluster lacks an obvious BCG, and the BCG candidate selected in the study by Collins et al. (2009) is located at a significant offset of kpc from the cluster X-ray position.
It will be interesting to compare our results for J2215 to the properties of star forming galaxies in the few other clusters that are currently known (Mullis et al., 2005; Stanford et al., 2005; Eisenhardt et al., 2008; Wilson et al., 2009; Papovich et al., 2010; Tanaka et al., 2010). In particular, XMMU J2235.3-2557 at (Mullis et al., 2005) appears to be a very relaxed and mature system already at this epoch, showing evidence of a cool core X-ray morphology (Rosati et al., 2009), and the core of this cluster is dominated by a group of massive, passively evolving galaxies, the brightest of which are significantly brighter than the BCG in J2215 (Lidman et al., 2008; Hilton et al., 2009). Furthermore, this cluster appears to be times more massive than J2215 based on a comparison of the cluster X-ray temperatures (Rosati et al., 2009; Jee et al., 2009), and may therefore be expected to have a lower fraction of star forming galaxies than J2215 if star formation is truncated earlier in more massive systems.
8. Conclusions
We have explored the AGN and star forming populations of the cluster J2215.9-1738 at using high resolution X-ray data from the Chandra satellite and infrared observations from the Spitzer Space Telescope. This is the first study of star formation as traced by mid-infrared observations in a cluster at . We found:
-
1.
The cluster emission is contaminated by X-ray point sources, leading to the X-ray temperature being overestimated in the analysis presented in S06; however, these point sources only contribute % to the total flux. Two of the X-ray point sources revealed by the Chandra observations are cluster members, while a third has properties consistent with it being a high redshift, highly obscured AGN in the background. The cluster has temperature keV and bolometric luminosity erg s-1 (extrapolated to 2 Mpc radius) from a joint analysis of the XMM-Newton and Chandra data. The cluster is less luminous than expected from self similar evolution of the local relation at the level.
-
2.
The velocity dispersion of the cluster is measured to be km s-1, from 31 galaxies within . There is no clear evidence that the cluster velocity distribution is composed of two kinematically distinct components, although the Hartigan & Hartigan (1985) dip test of unimodality still hints that the cluster is not completely relaxed. Following the revised X-ray analysis presented in this paper, the cluster is found to lie on the relation, contrary to the result reported in H07.
-
3.
Mid-infrared imaging reveals a total of eight 24 sources that are cluster members, selected using spectroscopic or photometric redshifts. In addition, there is a prominent 24 source (J221559.68-173758.9) with two possible optical/near-infrared counterparts located from the cluster center that may be associated with the cluster. One of the 24 sources is found to have the infrared colors expected of an AGN, and has an elliptical morphology. The remaining objects are most likely powered by star formation, and if this is the case have SFRs M☉ yr-1, adopting the Chary & Elbaz (2001) spectral templates and assuming that the Kennicutt (1998) law holds at this redshift.
-
4.
The cluster member AGN identified in the X-ray and infrared observations are located within of the cluster red-sequence, as are three (possibly four) 24 sources assumed to be powered by star formation. Three of the 24 sources are also found within a projected distance of kpc from the cluster center, suggesting that the core of J2215 may be host to galaxies with very high star formation rates, in contrast to clusters at lower redshift.
References
- Arnaud (1996) Arnaud, K. A. 1996, in Astronomical Society of the Pacific Conference Series, Vol. 101, Astronomical Data Analysis Software and Systems V, ed. G. H. Jacoby & J. Barnes, 17–+
- Ashman et al. (1994) Ashman, K. M., Bird, C. M., & Zepf, S. E. 1994, AJ, 108, 2348
- Assef et al. (2010) Assef, R. J., Kochanek, C. S., Ashby, M. L. N., Brodwin, M., Brown, M. J. I., Cool, R., Forman, W., Gonzalez, A. H., Hickox, R. C., Jannuzi, B. T., Jones, C., Le Floc’h, E., Moustakas, J., Murray, S. S., & Stern, D. 2010, ArXiv:1001.4529
- Bai et al. (2007) Bai, L., Marcillac, D., Rieke, G. H., Rieke, M. J., Tran, K., Hinz, J. L., Rudnick, G., Kelly, D. M., & Blaylock, M. 2007, ApJ, 664, 181
- Balogh et al. (2004) Balogh, M., Eke, V., Miller, C., Lewis, I., Bower, R., Couch, W., Nichol, R., Bland-Hawthorn, J., Baldry, I. K., Baugh, C., Bridges, T., Cannon, R., Cole, S., Colless, M., Collins, C., Cross, N., Dalton, G., de Propris, R., Driver, S. P., Efstathiou, G., Ellis, R. S., Frenk, C. S., Glazebrook, K., Gomez, P., Gray, A., Hawkins, E., Jackson, C., Lahav, O., Lumsden, S., Maddox, S., Madgwick, D., Norberg, P., Peacock, J. A., Percival, W., Peterson, B. A., Sutherland, W., & Taylor, K. 2004, MNRAS, 348, 1355
- Barmby et al. (2008) Barmby, P., Huang, J., Ashby, M. L. N., Eisenhardt, P. R. M., Fazio, G. G., Willner, S. P., & Wright, E. L. 2008, ApJS, 177, 431
- Beers et al. (1990) Beers, T. C., Flynn, K., & Gebhardt, K. 1990, AJ, 100, 32
- Bertin & Arnouts (1996) Bertin, E. & Arnouts, S. 1996, A&AS, 117, 393
- Blakeslee et al. (2003) Blakeslee, J. P., Franx, M., Postman, M., et al. 2003, ApJL, 596, L143
- Bouwens et al. (2009) Bouwens, R. J., Illingworth, G. D., Franx, M., Chary, R., Meurer, G. R., Conselice, C. J., Ford, H., Giavalisco, M., & van Dokkum, P. 2009, ApJ, 705, 936
- Bower et al. (2006) Bower, R. G., Benson, A. J., Malbon, R., Helly, J. C., Frenk, C. S., Baugh, C. M., Cole, S., & Lacey, C. G. 2006, MNRAS, 370, 645
- Braglia et al. (2009) Braglia, F. G., Pierini, D., Biviano, A., & Böhringer, H. 2009, A&A, 500, 947
- Bruzual & Charlot (2003) Bruzual, G. & Charlot, S. 2003, MNRAS, 344, 1000
- Butcher & Oemler (1984) Butcher, H. & Oemler, Jr., A. 1984, ApJ, 285, 426
- Calzetti et al. (2000) Calzetti, D., Armus, L., Bohlin, R. C., Kinney, A. L., Koornneef, J., & Storchi-Bergmann, T. 2000, ApJ, 533, 682
- Chabrier (2003) Chabrier, G. 2003, PASP, 115, 763
- Chary & Elbaz (2001) Chary, R. & Elbaz, D. 2001, ApJ, 556, 562
- Cid Fernandes et al. (2004) Cid Fernandes, R., Gu, Q., Melnick, J., Terlevich, E., Terlevich, R., Kunth, D., Rodrigues Lacerda, R., & Joguet, B. 2004, MNRAS, 355, 273
- Collins et al. (2009) Collins, C. A., Stott, J. P., Hilton, M., Kay, S. T., Stanford, S. A., Davidson, M., Hosmer, M., Hoyle, B., Liddle, A., Lloyd-Davies, E., Mann, R. G., Mehrtens, N., Miller, C. J., Nichol, R. C., Romer, A. K., Sahlén, M., Viana, P. T. P., & West, M. J. 2009, Nature, 458, 603
- Cooper et al. (2008) Cooper, M. C., Newman, J. A., Weiner, B. J., Yan, R., Willmer, C. N. A., Bundy, K., Coil, A. L., Conselice, C. J., Davis, M., Faber, S. M., Gerke, B. F., Guhathakurta, P., Koo, D. C., & Noeske, K. G. 2008, MNRAS, 383, 1058
- Croton et al. (2006) Croton, D. J., Springel, V., White, S. D. M., De Lucia, G., Frenk, C. S., Gao, L., Jenkins, A., Kauffmann, G., Navarro, J. F., & Yoshida, N. 2006, MNRAS, 365, 11
- Dale & Helou (2002) Dale, D. A. & Helou, G. 2002, ApJ, 576, 159
- Danese et al. (1980) Danese, L., de Zotti, G., & di Tullio, G. 1980, A&A, 82, 322
- Davis et al. (2003) Davis, M., Faber, S. M., Newman, J., Phillips, A. C., Ellis, R. S., Steidel, C. C., Conselice, C., Coil, A. L., Finkbeiner, D. P., Koo, D. C., Guhathakurta, P., Weiner, B., Schiavon, R., Willmer, C., Kaiser, N., Luppino, G. A., Wirth, G., Connolly, A., Eisenhardt, P., Cooper, M., & Gerke, B. 2003, in Presented at the Society of Photo-Optical Instrumentation Engineers (SPIE) Conference, Vol. 4834, Society of Photo-Optical Instrumentation Engineers (SPIE) Conference Series, ed. P. Guhathakurta, 161–172
- Dawson et al. (2009) Dawson, K. S., Aldering, G., Amanullah, R., Barbary, K., Barrientos, L. F., Brodwin, M., Connolly, N., Dey, A., Doi, M., Donahue, M., Eisenhardt, P., Ellingson, E., Faccioli, L., Fadeyev, V., Fakhouri, H. K., Fruchter, A. S., Gilbank, D. G., Gladders, M. D., Goldhaber, G., Gonzalez, A. H., Goobar, A., Gude, A., Hattori, T., Hoekstra, H., Huang, X., Ihara, Y., Jannuzi, B. T., Johnston, D., Kashikawa, K., Koester, B., Konishi, K., Kowalski, M., Lidman, C., Linder, E. V., Lubin, L., Meyers, J., Morokuma, T., Munshi, F., Mullis, C., Oda, T., Panagia, N., Perlmutter, S., Postman, M., Pritchard, T., Rhodes, J., Rosati, P., Rubin, D., Schlegel, D. J., Spadafora, A., Stanford, S. A., Stanishev, V., Stern, D., Strovink, M., Suzuki, N., Takanashi, N., Tokita, K., Wagner, M., Wang, L., Yasuda, N., Yee, H. K. C., & Supernova Cosmology Project, T. 2009, AJ, 138, 1271
- De Lucia et al. (2006) De Lucia, G., Springel, V., White, S. D. M., et al. 2006, MNRAS, 366, 499
- Della Ceca et al. (2001) Della Ceca, R., Pellegrini, S., Bassani, L., Beckmann, V., Cappi, M., Palumbo, G. G. C., Trinchieri, G., & Wolter, A. 2001, A&A, 375, 781
- Dietrich et al. (2007) Dietrich, J. P., Erben, T., Lamer, G., Schneider, P., Schwope, A., Hartlap, J., & Maturi, M. 2007, A&A, 470, 821
- Dietrich et al. (2006) Dietrich, J. P. et al. 2006, A&A, 449, 837
- Eisenhardt et al. (2008) Eisenhardt, P. R. M., Brodwin, M., Gonzalez, A. H., et al. 2008, ApJ, 684, 905
- Eisenstein et al. (2003) Eisenstein, D. J., Hogg, D. W., Fukugita, M., Nakamura, O., Bernardi, M., Finkbeiner, D. P., Schlegel, D. J., Brinkmann, J., Connolly, A. J., Csabai, I., Gunn, J. E., Ivezić, Ž., Lamb, D. Q., Loveday, J., Munn, J. A., Nichol, R. C., Schneider, D. P., Strauss, M. A., Szalay, A., & York, D. G. 2003, ApJ, 585, 694
- Elbaz et al. (2007) Elbaz, D., Daddi, E., Le Borgne, D., Dickinson, M., Alexander, D. M., Chary, R., Starck, J., Brandt, W. N., Kitzbichler, M., MacDonald, E., Nonino, M., Popesso, P., Stern, D., & Vanzella, E. 2007, A&A, 468, 33
- Ellingson et al. (2001) Ellingson, E., Lin, H., Yee, H. K. C., & Carlberg, R. G. 2001, ApJ, 547, 609
- Faber et al. (2003) Faber, S. M., Phillips, A. C., Kibrick, R. I., et al. 2003, in Proceedings of the SPIE, Vol. 4841, 1657–1669
- Fazio et al. (2004) Fazio, G. G., Hora, J. L., Allen, L. E., Ashby, M. L. N., Barmby, P., Deutsch, L. K., Huang, J., Kleiner, S., Marengo, M., Megeath, S. T., Melnick, G. J., Pahre, M. A., Patten, B. M., Polizotti, J., Smith, H. A., Taylor, R. S., Wang, Z., Willner, S. P., Hoffmann, W. F., Pipher, J. L., Forrest, W. J., McMurty, C. W., McCreight, C. R., McKelvey, M. E., McMurray, R. E., Koch, D. G., Moseley, S. H., Arendt, R. G., Mentzell, J. E., Marx, C. T., Losch, P., Mayman, P., Eichhorn, W., Krebs, D., Jhabvala, M., Gezari, D. Y., Fixsen, D. J., Flores, J., Shakoorzadeh, K., Jungo, R., Hakun, C., Workman, L., Karpati, G., Kichak, R., Whitley, R., Mann, S., Tollestrup, E. V., Eisenhardt, P., Stern, D., Gorjian, V., Bhattacharya, B., Carey, S., Nelson, B. O., Glaccum, W. J., Lacy, M., Lowrance, P. J., Laine, S., Reach, W. T., Stauffer, J. A., Surace, J. A., Wilson, G., Wright, E. L., Hoffman, A., Domingo, G., & Cohen, M. 2004, ApJS, 154, 10
- Ferrarese & Merritt (2000) Ferrarese, L. & Merritt, D. 2000, ApJL, 539, L9
- Galametz et al. (2009) Galametz, A., Stern, D., Eisenhardt, P. R. M., Brodwin, M., Brown, M. J. I., Dey, A., Gonzalez, A. H., Jannuzi, B. T., Moustakas, L. A., & Stanford, S. A. 2009, ApJ, 694, 1309
- Geach et al. (2006) Geach, J. E., Smail, I., Ellis, R. S., Moran, S. M., Smith, G. P., Treu, T., Kneib, J., Edge, A. C., & Kodama, T. 2006, ApJ, 649, 661
- Gebhardt et al. (2000) Gebhardt, K., Bender, R., Bower, G., Dressler, A., Faber, S. M., Filippenko, A. V., Green, R., Grillmair, C., Ho, L. C., Kormendy, J., Lauer, T. R., Magorrian, J., Pinkney, J., Richstone, D., & Tremaine, S. 2000, ApJL, 539, L13
- Georgakakis et al. (2007) Georgakakis, A., Rowan-Robinson, M., Babbedge, T. S. R., & Georgantopoulos, I. 2007, MNRAS, 377, 203
- Gilmour et al. (2009) Gilmour, R., Best, P., & Almaini, O. 2009, MNRAS, 392, 1509
- Glazebrook & Bland-Hawthorn (2001) Glazebrook, K. & Bland-Hawthorn, J. 2001, PASP, 113, 197
- Granato et al. (2004) Granato, G. L., De Zotti, G., Silva, L., Bressan, A., & Danese, L. 2004, ApJ, 600, 580
- Haines et al. (2009a) Haines, C. P., Smith, G. P., Egami, E., Ellis, R. S., Moran, S. M., Sanderson, A. J. R., Merluzzi, P., Busarello, G., & Smith, R. J. 2009a, ApJ, 704, 126
- Haines et al. (2009b) Haines, C. P., Smith, G. P., Egami, E., Okabe, N., Takada, M., Ellis, R. S., Moran, S. M., & Umetsu, K. 2009b, MNRAS, 396, 1297
- Hartigan & Hartigan (1985) Hartigan, J. A. & Hartigan, P. M. 1985, The Annals of Statistics, 13, 70
- Hayashi et al. (2010) Hayashi, M., Kodama, T., Koyama, Y., Tanaka, I., Shimasaku, K., & Okamura, S. 2010, MNRAS, 55
- Heckman (1980) Heckman, T. M. 1980, A&A, 87, 152
- Hilton et al. (2007) Hilton, M., Collins, C. A., Stanford, S. A., Lidman, C., Dawson, K. S., Davidson, M., Kay, S. T., Liddle, A. R., Mann, R. G., Miller, C. J., Nichol, R. C., Romer, A. K., Sabirli, K., Viana, P. T. P., & West, M. J. 2007, ApJ, 670, 1000
- Hilton et al. (2009) Hilton, M., Stanford, S. A., Stott, J. P., Collins, C. A., Hoyle, B., Davidson, M., Hosmer, M., Kay, S. T., Liddle, A. R., Lloyd-Davies, E., Mann, R. G., Mehrtens, N., Miller, C. J., Nichol, R. C., Romer, A. K., Sabirli, K., Sahlén, M., Viana, P. T. P., West, M. J., Barbary, K., Dawson, K. S., Meyers, J., Perlmutter, S., Rubin, D., & Suzuki, N. 2009, ApJ, 697, 436
- Hook et al. (2003) Hook, I., Allington-Smith, J. R., Beard, S. M., Crampton, D., Davies, R. L., Dickson, C. G., Ebbers, A. W., Fletcher, J. M., Jorgensen, I., Jean, I., Juneau, S., Murowinski, R. G., Nolan, R., Laidlaw, K., Leckie, B., Marshall, G. E., Purkins, T., Richardson, I. M., Roberts, S. C., Simons, D. A., Smith, M. J., Stilburn, J. R., Szeto, K., Tierney, C., Wolff, R. J., & Wooff, R. 2003, in Presented at the Society of Photo-Optical Instrumentation Engineers (SPIE) Conference, Vol. 4841, Society of Photo-Optical Instrumentation Engineers (SPIE) Conference Series, ed. M. Iye & A. F. M. Moorwood, 1645–1656
- Hopkins et al. (2008) Hopkins, P. F., Cox, T. J., Kereš, D., & Hernquist, L. 2008, ApJS, 175, 390
- Jee et al. (2009) Jee, M. J., Rosati, P., Ford, H. C., Dawson, K. S., Lidman, C., Perlmutter, S., Demarco, R., Strazzullo, V., Mullis, C., Böhringer, H., & Fassbender, R. 2009, ApJ, 704, 672
- Kennicutt (1998) Kennicutt, Jr., R. C. 1998, ARA&A, 36, 189
- Koyama et al. (2010) Koyama, Y., Kodama, T., Shimasaku, K., Hayashi, M., Okamura, S., Tanaka, I., & Tokoku, C. 2010, MNRAS, 191
- Kurtz & Mink (1998) Kurtz, M. J. & Mink, D. J. 1998, PASP, 110, 934
- Lemaux et al. (2010) Lemaux, B. C., Lubin, L. M., Shapley, A. E., Kocevski, D. D., Gal, R. R., & Squires, G. K. 2010, arXiv:1003.1780
- Lewis et al. (2002) Lewis, I., Balogh, M., De Propris, R., Couch, W., Bower, R., Offer, A., Bland-Hawthorn, J., Baldry, I. K., Baugh, C., Bridges, T., Cannon, R., Cole, S., Colless, M., Collins, C., Cross, N., Dalton, G., Driver, S. P., Efstathiou, G., Ellis, R. S., Frenk, C. S., Glazebrook, K., Hawkins, E., Jackson, C., Lahav, O., Lumsden, S., Maddox, S., Madgwick, D., Norberg, P., Peacock, J. A., Percival, W., Peterson, B. A., Sutherland, W., & Taylor, K. 2002, MNRAS, 334, 673
- Lidman et al. (2008) Lidman, C., Rosati, P., Tanaka, M., et al. 2008, A&A, 489, 981
- Magnelli et al. (2009) Magnelli, B., Elbaz, D., Chary, R. R., Dickinson, M., Le Borgne, D., Frayer, D. T., & Willmer, C. N. A. 2009, A&A, 496, 57
- Makovoz & Khan (2005) Makovoz, D. & Khan, I. 2005, in Astronomical Society of the Pacific Conference Series, Vol. 347, Astronomical Data Analysis Software and Systems XIV, ed. P. Shopbell, M. Britton, & R. Ebert, 81–+
- Makovoz & Marleau (2005) Makovoz, D. & Marleau, F. R. 2005, PASP, 117, 1113
- Maraston (2005) Maraston, C. 2005, MNRAS, 362, 799
- Marcillac et al. (2007) Marcillac, D., Rigby, J. R., Rieke, G. H., & Kelly, D. M. 2007, ApJ, 654, 825
- Markevitch (1998) Markevitch, M. 1998, ApJ, 504, 27
- Martini et al. (2009) Martini, P., Sivakoff, G. R., & Mulchaey, J. S. 2009, ApJ, 701, 66
- Maughan et al. (2006) Maughan, B. J., Jones, L. R., Ebeling, H., & Scharf, C. 2006, MNRAS, 365, 509
- Mei et al. (2009) Mei, S., Holden, B. P., & Blakeslee, J. P. o. 2009, ApJ, 690, 42
- Mullis et al. (2005) Mullis, C. R., Rosati, P., Lamer, G., et al. 2005, ApJL, 623, L85
- Murphy et al. (2009) Murphy, E. J., Chary, R.-R., Alexander, D. M., Dickinson, M., Magnelli, B., Morrison, G., Pope, A., & Teplitz, H. I. 2009, ApJ, 698, 1380
- Muzzin et al. (2009) Muzzin, A., Marchesini, D., van Dokkum, P. G., Labbé, I., Kriek, M., & Franx, M. 2009, ApJ, 701, 1839
- Oke (1974) Oke, J. B. 1974, ApJS, 27, 21
- Panessa et al. (2005) Panessa, F., Wolter, A., Pellegrini, S., Fruscione, A., Bassani, L., Della Ceca, R., Palumbo, G. G. C., & Trinchieri, G. 2005, ApJ, 631, 707
- Papovich et al. (2010) Papovich, C., Momcheva, I., Willmer, C. N. A., Finkelstein, K. D., Finkelstein, S. L., Tran, K., Brodwin, M., Dunlop, J. S., Farrah, D., Khan, S. A., Lotz, J., McCarthy, P., McLure, R. J., Rieke, M., Rudnick, G., & Sivanandam, S. 2010, arXiv:1002.3158
- Papovich et al. (2006) Papovich, C., Moustakas, L. A., Dickinson, M., Le Floc’h, E., Rieke, G. H., Daddi, E., Alexander, D. M., Bauer, F., Brandt, W. N., Dahlen, T., Egami, E., Eisenhardt, P., Elbaz, D., Ferguson, H. C., Giavalisco, M., Lucas, R. A., Mobasher, B., Pérez-González, P. G., Stutz, A., Rieke, M. J., & Yan, H. 2006, ApJ, 640, 92
- Pérez-González et al. (2008a) Pérez-González, P. G., Rieke, G. H., Villar, V., Barro, G., Blaylock, M., Egami, E., Gallego, J., Gil de Paz, A., Pascual, S., Zamorano, J., & Donley, J. L. 2008a, ApJ, 675, 234
- Pérez-González et al. (2008b) Pérez-González, P. G., Trujillo, I., Barro, G., Gallego, J., Zamorano, J., & Conselice, C. J. 2008b, ApJ, 687, 50
- Polletta et al. (2007) Polletta, M., Tajer, M., Maraschi, L., Trinchieri, G., Lonsdale, C. J., Chiappetti, L., Andreon, S., Pierre, M., Le Fèvre, O., Zamorani, G., Maccagni, D., Garcet, O., Surdej, J., Franceschini, A., Alloin, D., Shupe, D. L., Surace, J. A., Fang, F., Rowan-Robinson, M., Smith, H. E., & Tresse, L. 2007, ApJ, 663, 81
- Predehl et al. (2010) Predehl, P., Boehringer, H., Brunner, H., Brusa, M., Burwitz, V., Cappelluti, N., Churazov, E., Dennerl, K., Freyberg, M., Friedrich, P., Hasinger, G., Kendziorra, E., Kreykenbohm, I., Schmid, C., Wilms, J., Lamer, G., Meidinger, N., Muehlegger, M., Pavlinsky, M., Robrade, J., Santangelo, A., Schmitt, J., Schwope, A., Steinmetz, M., Strueder, L., Sunyaev, R., & Tenzer, C. 2010, arXiv:1001.2502
- Romer et al. (2001) Romer, A. K., Viana, P. T. P., Liddle, A. R., & Mann, R. G. 2001, ApJ, 547, 594
- Rosati et al. (2009) Rosati, P., Tozzi, P., Gobat, R., Santos, J. S., Nonino, M., Demarco, R., Lidman, C., Mullis, C. R., Strazzullo, V., Böhringer, H., Fassbender, R., Dawson, K., Tanaka, M., Jee, J., Ford, H., Lamer, G., & Schwope, A. 2009, A&A, 508, 583
- Sahlén et al. (2009) Sahlén, M., Viana, P. T. P., Liddle, A. R., Romer, A. K., Davidson, M., Hosmer, M., Lloyd-Davies, E., Sabirli, K., Collins, C. A., Freeman, P. E., Hilton, M., Hoyle, B., Kay, S. T., Mann, R. G., Mehrtens, N., Miller, C. J., Nichol, R. C., Stanford, S. A., & West, M. J. 2009, MNRAS, 397, 577
- Saintonge et al. (2008) Saintonge, A., Tran, K.-V. H., & Holden, B. P. 2008, ApJL, 685, L113
- Santini et al. (2009) Santini, P., Fontana, A., Grazian, A., Salimbeni, S., Fiore, F., Fontanot, F., Boutsia, K., Castellano, M., Cristiani, S., de Santis, C., Gallozzi, S., Giallongo, E., Menci, N., Nonino, M., Paris, D., Pentericci, L., & Vanzella, E. 2009, A&A, 504, 751
- Seymour et al. (2008) Seymour, N., Dwelly, T., Moss, D., McHardy, I., Zoghbi, A., Rieke, G., Page, M., Hopkins, A., & Loaring, N. 2008, MNRAS, 386, 1695
- Shapley et al. (2005) Shapley, A. E., Steidel, C. C., Erb, D. K., Reddy, N. A., Adelberger, K. L., Pettini, M., Barmby, P., & Huang, J. 2005, ApJ, 626, 698
- Silverman et al. (2005) Silverman, J. D., Green, P. J., Barkhouse, W. A., Cameron, R. A., Foltz, C., Jannuzi, B. T., Kim, D., Kim, M., Mossman, A., Tananbaum, H., Wilkes, B. J., Smith, M. G., Smith, R. C., & Smith, P. S. 2005, ApJ, 624, 630
- Smith et al. (2005) Smith, G. P., Treu, T., Ellis, R. S., et al. 2005, ApJ, 620, 78
- Somerville et al. (2008) Somerville, R. S., Hopkins, P. F., Cox, T. J., Robertson, B. E., & Hernquist, L. 2008, MNRAS, 391, 481
- Stanford et al. (2005) Stanford, S. A., Eisenhardt, P. R., Brodwin, M., et al. 2005, ApJL, 634, L129
- Stanford et al. (2006) Stanford, S. A., Romer, A. K., Sabirli, K., et al. 2006, ApJL, 646, L13
- Stern et al. (2005) Stern, D., Eisenhardt, P., Gorjian, V., Kochanek, C. S., Caldwell, N., Eisenstein, D., Brodwin, M., Brown, M. J. I., Cool, R., Dey, A., Green, P., Jannuzi, B. T., Murray, S. S., Pahre, M. A., & Willner, S. P. 2005, ApJ, 631, 163
- Tanaka et al. (2010) Tanaka, M., Finoguenov, A., & Ueda, Y., 2010, ApJL in press. (arXiv:1004.3606)
- van Dokkum et al. (2000) van Dokkum, P. G., Franx, M., Fabricant, D., et al. 2000, ApJ, 541, 95
- Voit (2005) Voit, G. M. 2005, Reviews of Modern Physics, 77, 207
- Voit & Ponman (2003) Voit, G. M. & Ponman, T. J. 2003, ApJL, 594, L75
- Wilson et al. (2009) Wilson, G., Muzzin, A., Yee, H. K. C., Lacy, M., Surace, J., Gilbank, D., Blindert, K., Hoekstra, H., Majumdar, S., Demarco, R., Gardner, J. P., Gladders, M. D., & Lonsdale, C. 2009, ApJ, 698, 1943
- Yan et al. (2006) Yan, R., Newman, J. A., Faber, S. M., Konidaris, N., Koo, D., & Davis, M. 2006, ApJ, 648, 281