Ultrafast (but Many-Body) Relaxation in a Low-Density Electron Glass
Abstract
We present a study of the relaxation dynamics of the photoexcited conductivity of the impurity states in the low-density electronic glass, phosphorous-doped silicon Si:P. Using subband gap optical pump-terahertz probe spectroscopy we find strongly temperature and fluence dependent glassy power-law relaxation occurring over sub-nanosecond time scales. Such behavior is in contrast to the much longer time scales found in higher electron density glassy systems. We also find evidence for both multi-particle relaxation mechanisms and/or coupling to electronic collective modes and a low temperature quantum relaxational regime.
pacs:
72.20.Ee, 71.30.+h, 71.45.Gm, 72.40.+w, 72.15.RnGlasses are ubiquitous states of matter with positionally or rotationally randomized frozen degrees of freedom. Their inherently frustrated interactions give rise to the existence of many energetically low-lying metastable states, which have a wide distribution of potential barriers separating them in configuration space. At low temperatures, such systems are kinematically constrained from reaching their true ground-state on typical experimental time scales. They are characterized by long relaxation times, memory, and aging effects Struik (1978); Bouchaud (1998); Vincent et al. (1997); Ben-Chorin et al. (1993).
In analogy with structural glasses, electronic glasses can be defined as systems with a random distribution of localized charges Davies et al. (1982); Mott and Davis (1979); Pollak and Ortuno (1982). Here long relaxation times and glassy phenomena derive from a combination of disorder and long-range unscreened Coulomb interaction. The motion of any one charge manifestly necessitates a many-particle rearrangement of the other electron occupations to reach lower energy. Such many-particle processes are inherently slow and inefficient at finding the true ground-state configuration. Electronic glasses or ‘Coulomb glasses’ may be realized in granular metals and amorphous and lightly doped semiconductors, which are all expected to exhibit certain similar qualitative behavior. In addition to explicit glassy effects, there are also predictions for their equilibrium properties like the DC hopping conductivity Efros and Shklovskii (1975) and the power-law dependencies of the AC response Shklovskii and Efros (1981); Lee and Stutzmann (2001); Helgren et al. (2002, 2004).
Recently there has been great progress in the understanding of how glassy non-equlibirum effects manifest themselves in these systems. In amorphous compounds like In2O3-x the natural history-free relaxation law of the DC conductivity after excitation is logarithmic over more than five decades in time Vaknin et al. (2000), a behavior that may be rooted in a broad distribution of relaxation times. Interesting temperature dependencies have been found at low temperature, which have been ascribed to quantum tunneling instead of thermally activated hopping Ovadyahu (2007).
The majority of such experiments have been on systems such as microcrystalline In2O3-x or granular metals Vaknin et al. (2000); Ben-Chorin et al. (1993); Grenet et al. (2007) in which the charge density is high. It would be interesting to look for such phenomena in systems with much lower densities like doped semiconductors. Although the equilibrium transport properties expected for electronic glasses have been reported in systems like Si:B or Si:P Lee and Stutzmann (2001); Helgren et al. (2002); Lee et al. (1999); Dai et al. (1991), as far as we know, evidence for true glassy behavior in the conductivity, i.e. long-time non-exponential relaxation indicative of metastability and frustration has not been observed. This is likely due to their much faster time scales owing to the much smaller charge densities, which is crucial for their quantum dynamics Ovadyahu (2007). So while in principle glassy relaxation should exist in such systems, it is expected to be too fast to be resolved with usual techniques.
In this Letter we report the use of ultrafast optical pump-terahertz probe (OPTP) spectroscopy to resolve glassy relaxation in the doped semiconductor Si:P. Terahertz time-domain spectroscopy is an ultrafast optical technique in which electric field transients are used to measure the conductivity of a material. Here a sample is optically excited with a laser pulse and then probed at a later time with a terahertz (THz) pulse to measure the induced conductivity changes with picosecond resolution. While OPTP has been successfully applied to correlated electron systems such as high-Tc’s, manganites and semiconductors Averitt and Taylor (2002); Jepsen et al. (2001) in unraveling the various dynamics by their different relaxation time scales, this is the first such study on glasses. In this work, we find strongly temperature and fluence dependent glassy non-exponential relaxation occurring on a sub-nanosecond time scale, which is in contrast to the much longer time scales observed in high electron density glassy systems.
Experiments were performed on nominally uncompensated phosphorous-doped silicon samples, which were cut from a Czochralski grown boule grown by Recticon Enterprises Inc. to a specification of 5 cm in diameter with a P-dopant gradient along the axis. This boule was subsequently sliced and then polished down to 100 m. Samples from this boule have previously been used for an extensive study of the THz-range conductivity in the phononless regime Helgren et al. (2002, 2004). In this study, we concentrated on a particular Si:P sample with a 300 K resistivity of 0.0202 cm. According to the Thurber scale Thurber et al. (1980) this corresponds to an estimated phosphorus concentration of dopant atoms/cm3, which puts it at 39 of the way to the MIT. This sample’s Helgren et al. (2004) localization length ( 13 nm) is slightly larger than the interdopant spacing of 9 nm and its static dielectric constant ( 14) is enhanced over that of undoped silicon (11.7) demonstrating that collective quantum effects may play a role. Although nominally uncompensated, it is also generally believed that this doping level is high enough that the material self-compensates i.e. the long-range Coulomb interaction ionizes a substantial fraction of P sites.
The experiments utilized a regeneratively amplified Ti:Al2O3 laser system operating at 1 kHz, producing nominally 1.0 mJ, 150 fs pulses at 1.5 eV. The Si:P sample was excited at 1500 nm (0.82 eV) an optical parametric amplifier with pump fluences ranging from 4.2 to 424.4 J/cm2 producing photoexcited carrier densities Den cm-3. The experiments were performed in transmission (T) with the Si:P sample inside an optical He cryostat capable of reaching 4 K. The THz ‘probe’ pulses were generated and detected using electro-optic techniques. A schematic of the THz setup is given in Ref. Thorsmølle et al., 2007. Fig. 1a shows the transmitted electric field of the THz pulse before and after optical excitation. The decrease in the transmitted electric field is associated with the change in conductivity (i.e., ). From an analysis of the skin-depth, the sample is presumed to be homogeneously excited at low temperature. In equilibrium, the THz range conductivity in these materials derives from transitions between localized levels and is believed to be proportional to a high power of the localization length as where is the non-interacting density of states Shklovskii and Efros (1981); Lee and Stutzmann (2001); Helgren et al. (2002, 2004).
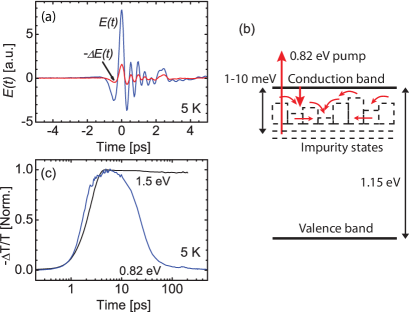
The excitation process is shown in Fig. 1b. Electrons are excited from the impurity band to a relatively large energy in the conduction band (0.8 eV). However, they quickly decay back into impurity states d through successive many-body hops find lower energy orbitals, slowly reducing the transmission. In order to probe only impurity band states it is essential that the pump laser’s energy is below the band gap threshold (1.5 eV). Note that the dynamics of conduction band-valence band recombination is completely different as shown in Fig. 1c. Recombination of 1.5 eV electron-hole pairs produced by above-gap excitation occur on time scales of millisecond or longer, while 0.8 eV excitations decay on sub-nanosecond time scales. While recombination of conduction band - valence band pairs from a 1.5 eV excitation pulse is slow it can be described by a simple exponential, and is glassy.
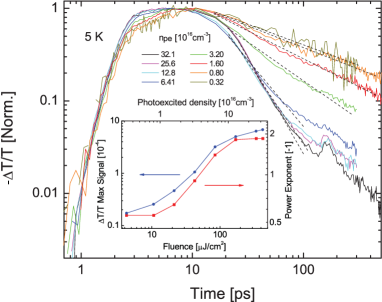
In Fig. 2 we show the peak normalized photoinduced dynamics at various ’s at K with 0.8 eV excitation. All the data present a fast 1 picosecond rise, a plateau, and then a much slower decay. As we will discuss below, the data have a number of unusual features consistent with glassy dynamics. At high the decay is power-law with an exponent of -2 until 180 ps. At below cm-3, the relaxation is still power-law (Fig. 2 inset) with an exponent leveling off at -0.5 below cm-3 that persists out to at least 500 picosecond str .
The plateau region in is associated with the decay of charge into the impurity band into quasi-equilbrium. All subsequent relaxation concerns the rearrangement of charge within this band of localized states. Relaxation occurs within localized states as the form of the THz conductivity does not change after photoexcitation, as shown by the essentially identical shape of E-field transients in Fig. 1a. Therefore 0 as 0 just as in the equilibrium case and as one expects for AC transport within localized states. Therefore 0 as 0 just as in the equilibrium case and as one expects for AC transport within localized states. Note also that despite excited charge densities of at most 23 of , the overall scale of the transmission change (Fig. 2 inset) never reaches more than 0.1 of the unpumped transmission even at the highest . This gives additional evidence that the decay should be associated with relaxation within a localized band of low intrinsic conductivity.
The strong dependence of the instantaneous decay rate and power-law is unusual and evidence for multi-particle relaxation. Still, even in many systems where two-particle recombination kinetics are important, the Rothwarf-Taylor “phonon-bottleneck” effect typically sets in, which decreases the dependence Rothwarf and Taylor (1967). In such a case, the phonons created electron-hole pair decay are available to make new electron-hole pairs, which limits the net energy flow out of the electronic system and diminishes the role of two-particle reactions as a rate limiting step. Effects of this kind apparently are not dominant here. The dependence is also different than relaxation from above gap excitations in other disordered semiconductors like microcrystal silicon Jepsen et al. (2001) where the decay rate with increasing . There, with increasing , the available trapping sites are filled up and only slow conduction band - valence band recombination is available as a decay channel. Obviously, the functional dependencies here are very different.
We propose that the power-law decay and the strong tendency towards a smaller exponent at low is consistent with glassy many-body relaxation. After initial photoexcitation charges fall back to the impurity band into a quasi-equilibrium configuration, which necessarily occupies higher energy levels where localization is weaker. The system is constrained through large potential barriers from reaching lower energy configurations expeditiously. It is only through rare and intrinsically slow many-particle rearrangements that electrons find lower energy configurations thereby reducing the conductivity. These relaxations may occur through Auger-like rearrangements Landsberg (1987) of a discrete number of electrons or through a coupling to collective electronic modes Mueller and Ioffe (2007).
Although we find power-law and not logarithmic decay as in the DC experiments on In2O3 Vaknin et al. (2000), note that power-law decay with has a dependence very close to logarithmic. Like the logarithmic dependence the power-law presumably derives also from an average over a broad distribution of relaxation times. Although a power-law decay is by definition scale invariant, it is in the sense of the small power-law exponent that the relaxation can be considered ‘slow’ and glassy.
In the present case, despite the decay’s scale-free nature we can compare the rough time scales in our experimental range to other natural relaxational scales. At 5 K and cm-3, it takes 200 ps for to decay to 30 of its maximum. This is much longer than for instance, the natural scale for phonon assisted relaxation, which should be of order 9 picosecond in this sample at 5 K Mott and Davis (1979). Here is the Debye frequency of silicon and is the characteristic Efros-Shklovskii temperature . It is also interesting to compare to the ‘Maxwell time’ , which is the classical expectation for spatial charge relaxation Ben-Chorin et al. (1993). calculated from the 5 K DC resistivityHelgren et al. (2004) is approximately 0.9 millisecond (), which is far in excess of any scale we observe. However, it may be possible to define an ‘AC Maxwell time’ from the equilibrium THz range resistivity associated with short length scale relaxation. Such a time calculated from older data at our central THz frequency (600 GHz) Helgren et al. (2004) is 14 ps. The difference between these time scales and the experimental ones may also be evidence for glassy effects.
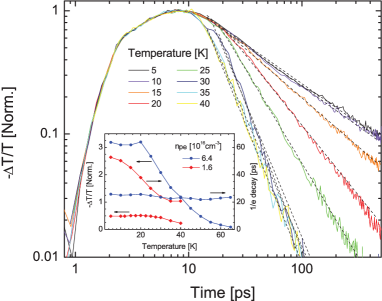
The temperature dependence supports our claim of glassy relaxation. Fig. 3 shows the normalized time-resolved photoinduced at various temperatures for cm-3. It features a 1 picosecond rise, followed by a nearly constant signal over 7 picosecond after which it displays a temperature dependent power-law decay. At the lowest temperature the power-law exponent for this is -0.6, and becomes about -2.5 above 25 K. The inset shows the dependence of the transmission maximum for both cm-3 and cm-3. In Fig. 4a we show a compilation of the temperature dependent fits of the power-law decay at different . Above a threshold temperature of around 25 K and cm-3, the dynamics shows no significant changes with as is expected for such a system out of the glassy regime. Below 25 K, the power-law relaxation becomes slower. As noted previously the very lowest measured exhibits a power-law very close to 0.5 at the lowest temperature. Note that all measured curves show a low temperature region where the exponent saturates. This region shrinks slightly with decreasing temperature, but remains finite even in the limit of low . This is consistent with quantum tunneling as means to relaxation. In contrast, if the relaxation was purely due to thermal effects or dependent on the energy deposited from the pump pulse, one would expect that the temperature threshold for saturation and the exponent to go to zero continuously at low T and .
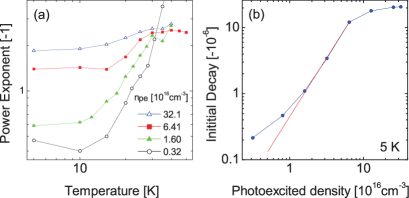
We have shown evidence for a highly temperature and dependent relaxation consistent with glassy dynamics. What can we say more precisely about the nature of the relaxation? In materials where two-particle recombination is the principle relaxation channel, one expects a term in the rate equations and an instantaneous decay rate that goes as . This is what has been found in systems like some superconductors where electron-hole recombination dominates Averitt and Taylor (2002); Gedik et al. (2004). In glassy systems, simultaneous multi-particle hoppings should contribute terms to the rate equations as a high order in and hence the instantaneous rates would be proportional to to a power larger than unity. One may also expect a super-linear dependence if relaxation is driven by excited collective electronic modes Mueller and Ioffe (2007).
In Fig. 4b we plot the instantaneous decay rate from a 10 picosecond time span after the transmission plateau vs. . Strictly exponential decay would be linear and two-particle relaxation quadratic on this plot. The data shows a dependence faster than linear and at intermediate ’s goes like the power. This is consistent with multi-particle relaxation. Due to the previously mentioned temperature and independence at low , for a full description it seems essential to incorporate quantum relaxation effects. These are not normally considered in relaxation models and theoretical input is essential for a more rigorous interpretation.
We thank J. Demsar, E. Helgren, D. Hilton, M. Müller, M. Pollak, and Z. Ovadyahu for helpful discussions and/or careful reading of this manuscript. The research at JHU was supported by NSF DMR-0847652.
References
- Struik (1978) L. Struik, Physical aging in amorphous polymers and other materials (Elsevier Scientific Pub. Co, 1978).
- Bouchaud (1998) J. Bouchaud, Spin glasses and random fields p. 161 (1998).
- Vincent et al. (1997) E. Vincent et al., Complex Behaviour of Glassy Systems pp. 184–219 (1997).
- Ben-Chorin et al. (1993) M. Ben-Chorin, Z. Ovadyahu, and M. Pollak, Phys. Rev. B 48, 15025 (1993).
- Davies et al. (1982) J. H. Davies, P. A. Lee, and T. M. Rice, Phys. Rev. Lett. 49, 758 (1982).
- Mott and Davis (1979) N. Mott and E. Davis, Electronic processes in non-crystalline materials (Clarendon Press Oxford, 1979).
- Pollak and Ortuno (1982) M. Pollak and M. Ortuno, Sol. Energy Mater. 8, 81 (1982).
- Efros and Shklovskii (1975) A. Efros and B. Shklovskii, J. Phys. C 8, L49 (1975).
- Shklovskii and Efros (1981) B. I. Shklovskii and A. L. Efros, Sov. Phys. JETP 54, 218 (1981).
- Lee and Stutzmann (2001) M. Lee and M. L. Stutzmann, Phys.Rev.Lett. 87, 056402 (2001).
- Helgren et al. (2002) E. Helgren, N. P. Armitage, and G. Grüner, Phys. Rev. Lett. 89, 246601 (2002).
- Helgren et al. (2004) E. Helgren, N. P. Armitage, and G. Grüner, Phys. Rev. B 69, 014201 (2004).
- Vaknin et al. (2000) A. Vaknin, Z. Ovadyahu, and M. Pollak, Phys. Rev. B 61, 6692 (2000).
- Ovadyahu (2007) Z. Ovadyahu, Phys. Rev. Lett. 99, 226603 (2007).
- Grenet et al. (2007) T. Grenet et al., Euro. Phys. Jour. B 56, 183 (2007).
- Lee et al. (1999) M. Lee et al., Phys. Rev. B 60, 1582 (1999).
- Dai et al. (1991) P. Dai, Y. Zhang, and M. Sarachik, Phys. Rev. Lett. 66, 1914 (1991).
- Averitt and Taylor (2002) R. Averitt and A. Taylor, Journal of Physics: Condensed Matter 14, R1357 (2002).
- Jepsen et al. (2001) P. Jepsen et al., App. Phys. Lett. 79, 1291 (2001).
- Thurber et al. (1980) W. Thurber et al., J. Electrochem. Soc. 127, 1807 (1980).
- (21) was obtained using , where is fluence, excitation wavelength, and thickness.
- Thorsmølle et al. (2007) V. K. Thorsmølle et al., Chimia 61, 631 (2007).
- (23) In practice it is quite difficult to exclude functional forms such as stretched exponential, but we were only able to fit stretched exponential to the lowest and T data.
- Rothwarf and Taylor (1967) A. Rothwarf and B. N. Taylor, Phys. Rev. Lett. 19, 27 (1967).
- Landsberg (1987) P. Landsberg, Solid-State Electronics 30, 1107 (1987).
- Mueller and Ioffe (2007) M. Mueller and L. Ioffe, arXiv:0711.2668 (2007).
- Gedik et al. (2004) N. Gedik et al., Phys. Rev. B 70, 014504 (2004).