Upsilon Productions at STAR
Abstract
The cross section is measured at mid-rapidity () in collisions and in d collisions at center-of-mass energy = 200 GeV with the STAR detector at RHIC. In , the measured cross section is found to be consistent with the world data trend as a function of , in agreement with the Color Evaportaion Model (CEM), and underestimated by the Color Singlet Model (CSM) up to the Next-to-Leading-Order Quantum Chromodynamics (NLO QCD) calculations. In d+, the measured cross section is in agreement with the CEM prediction with anti-shadowing effects, and the nuclear modification factor indicates that production follows binary scaling within the current uncertainties. These measurements provide a benchmark for the future measurements of production in collisions.
1 Introduction
The measurement of heavy quarkonia (, , , etc) is considered as one of the most promising probes of the formed medium at the Relativistic Heavy Ion Collider (RHIC). The force between the constituents of a quarkonium state, a heavy quark and its antiquark, is weakened by the color screening produced by the light quarks and gluons [1]. Accordingly the quarkonium yields are expected to suppress in collisions compared to those in collisions. Recent calculations based on Lattice QCD predict a sequential disappearance of the heavy quarkonia and its excited states with the temperature of the strongly interacting systems. Therefore, the heavy quarkonia and its excited states are considered as a thermometer for such system [2]. In particular, the measurement of is recognized as a cleaner probe due to its low cross section where the roles of the competing effects that either reduce the yield [3], or enhance it [4], are negligible in contrast to the and its excited states. Furthermore, the contributions from the higher states “feed-down” of is small compared to the states, where the B meson decays have significant contributions. Since the collisions serve as a baseline for the collisions, it is important to understand the quarkonia production mechanisms in , where almost all of the models have difficulties to reproduce the cross sections, transverse momentum p⟂ spectra, and polarization simultaneously [5].
In this article, we report the STAR measurement of the cross section at midrapidity in collisions at = 200 GeV. In addition, we address the cold nuclear matter effect by performing similar measurements in d collisions at the same .
2 Data and Analysis
The STAR experiment is adapted for the quarkonium measurements, through the dielectron channels, due to the capabilities of the Time Projection Chamber (TPC) [6] and the Barrel Electromagnetic Calorimeter (BEMC) [7] for electron identification and triggering. The TPC and BEMC have a large acceptance in pseudorapidity 1 and full coverage in azimuth . The TPC is a tracker detector that measures the particles’ momenta and energy loss per unit length (dE/dx) and therefore provides particle identification. The BEMC is divided in into 4800 projective towers. The geometrical acceptance of the STAR BEMC for detecting both electrons from an decay is maximum in the rapidity range 0.5.
The STAR trigger is composed of two components, level-0 (L0) hardware component and level-2 (L2) software component [8]. Using a dedicated trigger algorithm exploiting the capabilities of the STAR BEMC, the STAR experiment sampled an integrated luminosity of 7.9 pb-1 of collisions and 32 nb-1 of d collisions at = 200 GeV.
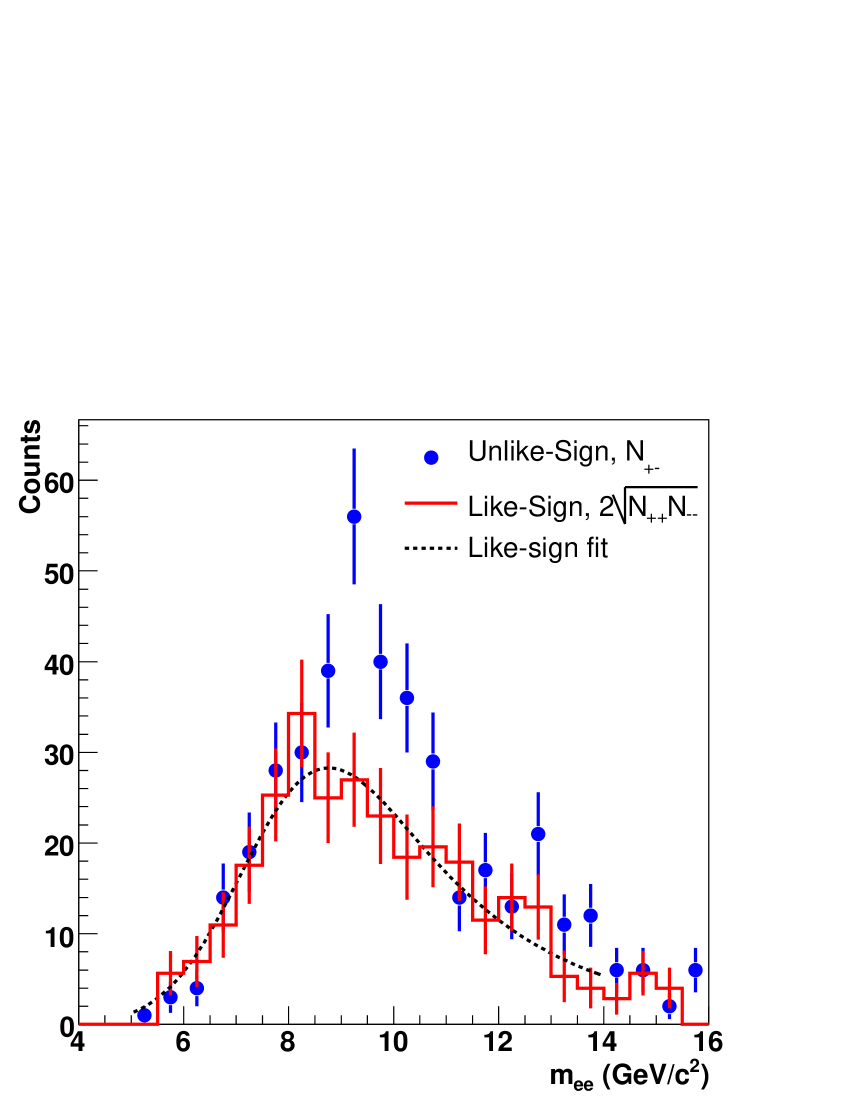
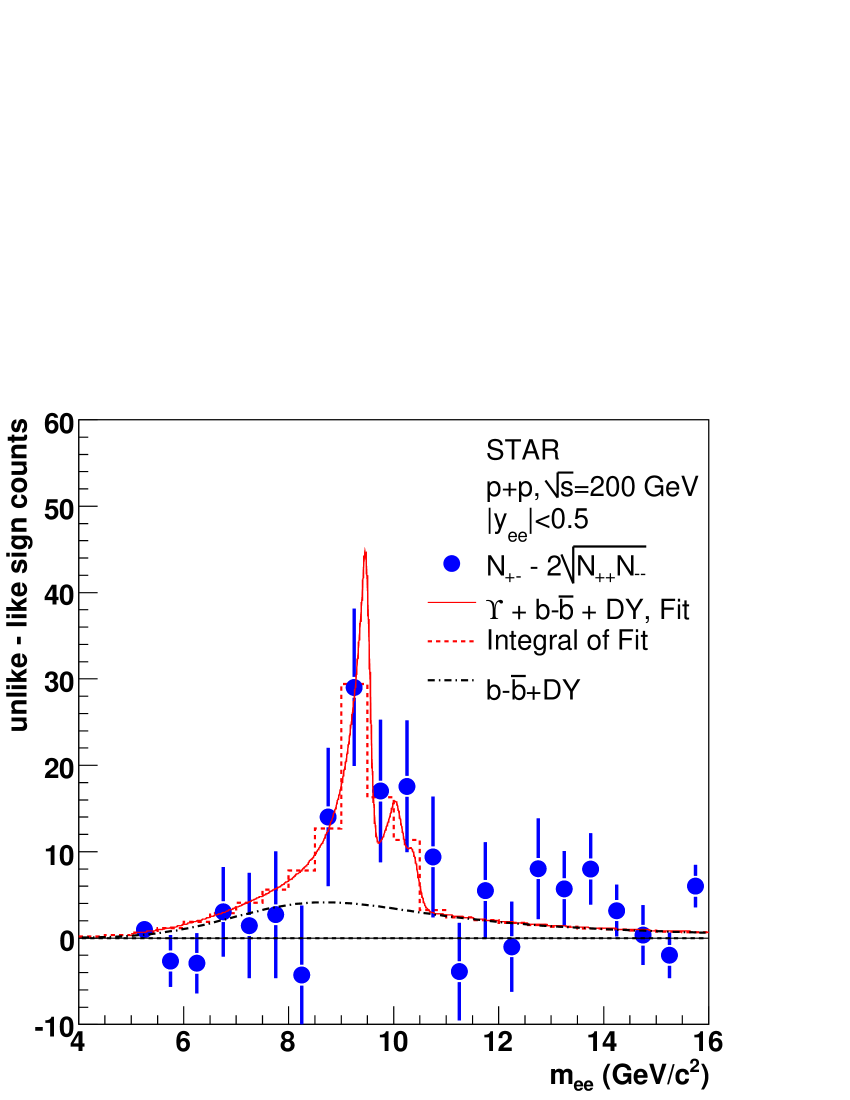
The electrons identified by the TPC are further required to match the trigger conditions at the BEMC, and to have the ratio of E/p 1, where E and p are the particle’s energy and momentum measured by BEMC and TPC respectively. The pairs are then combined to produce the invariant mass ( where and are the pair’s momenta, and is the opening angle) spectrum (, and the like-sign combinations of and are used to calculate the geometric mean (2 ) for the combinatorial background. The total yield ( = - 2 ) is extracted by integrating the invariant mass spectrum in the region after the background subtraction. A detailed study of the line shape is performed in order to separate the from the continuum contributions (Drell-Yan and ) in the integrated yield region [8]. In these analyses the separation between the individual states of is not possible due the limited statistics and Bremsstrahlung tails. The cross section is obtained from the total yield according to equation 1.
| (1) |
where is the branching fraction for , is the cross section for the state in the region 0.5, is the rapidity interval for our our kinematic region 0.5, is the total efficiency corrections, and is the integrated luminosity. The total efficiency corrections is defined as = , where is the BEMC geometrical acceptance, is the vertex-finding efficiency, is the trigger efficiency for L0, is the trigger efficiency for L2, is the TPC geometrical acceptance times tracking efficiency, is the TPC-BEMC matching efficiency, and are the electron identification efficiency. Each term and its uncertainty is estimated through simulations and the total efficiency is included in the reported values of the cross section.
3 Results and Discussions
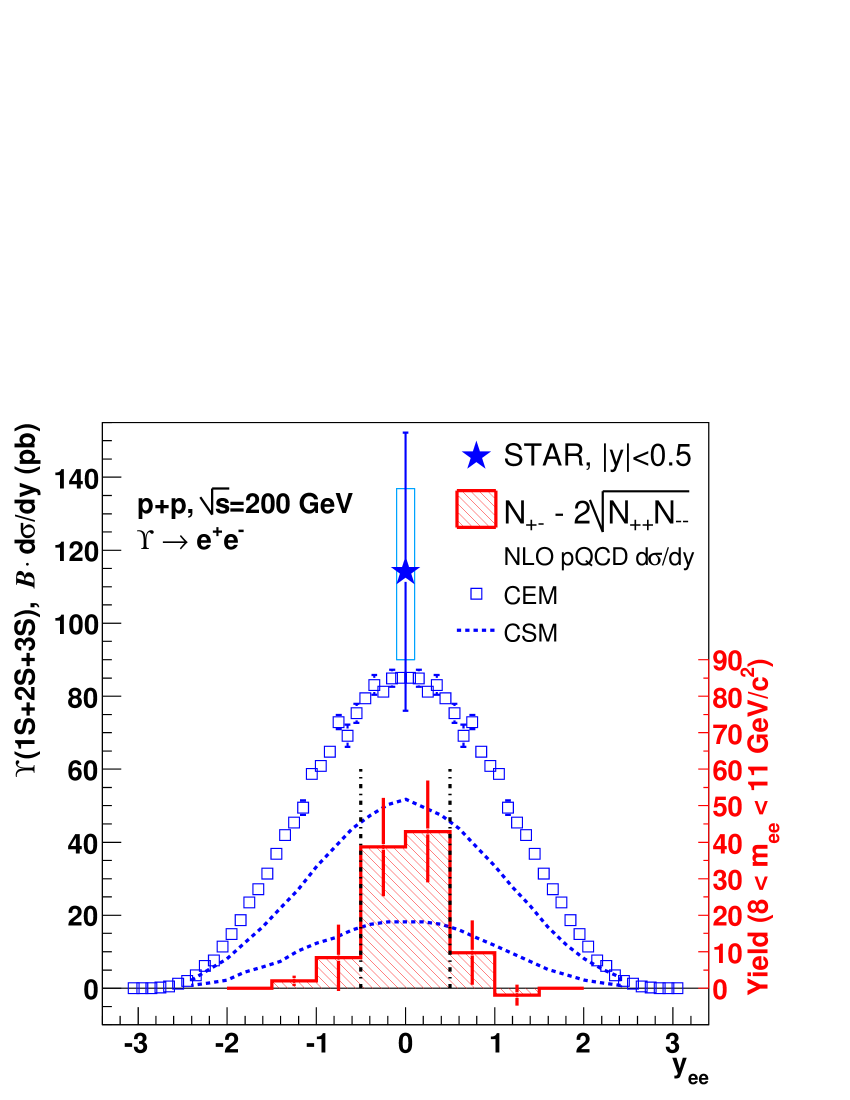
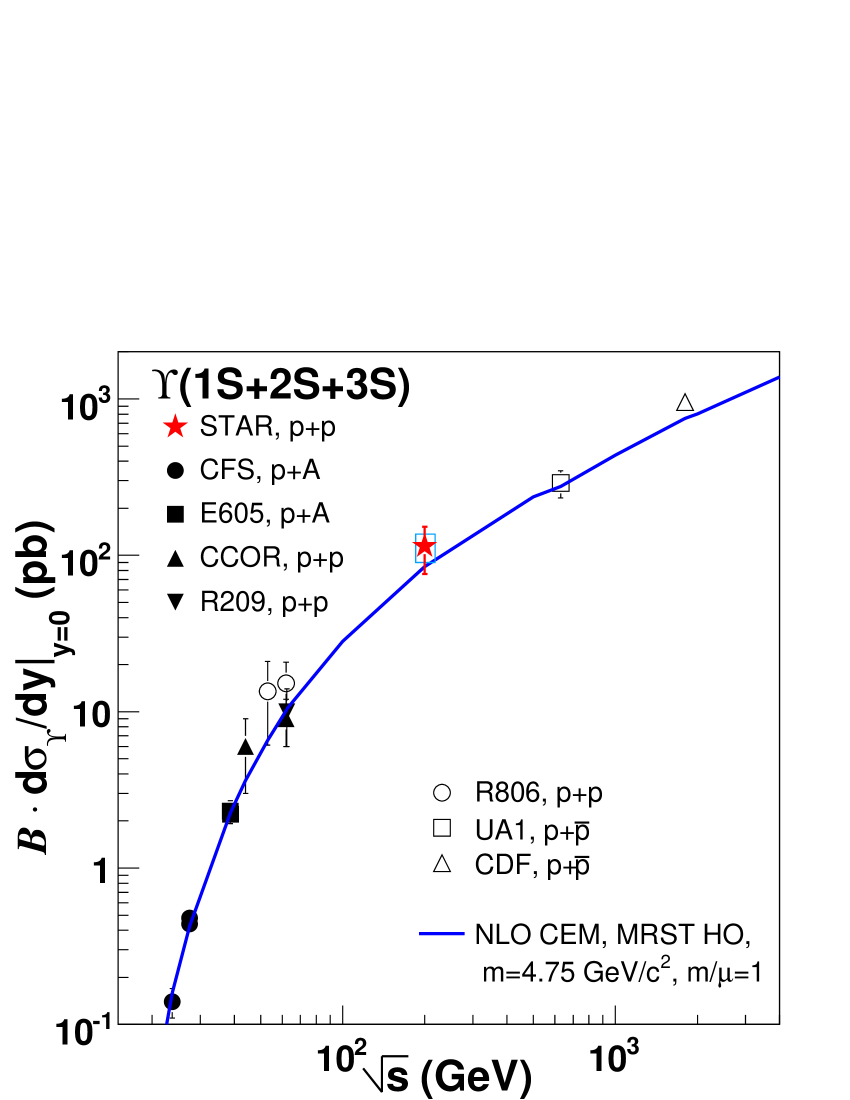
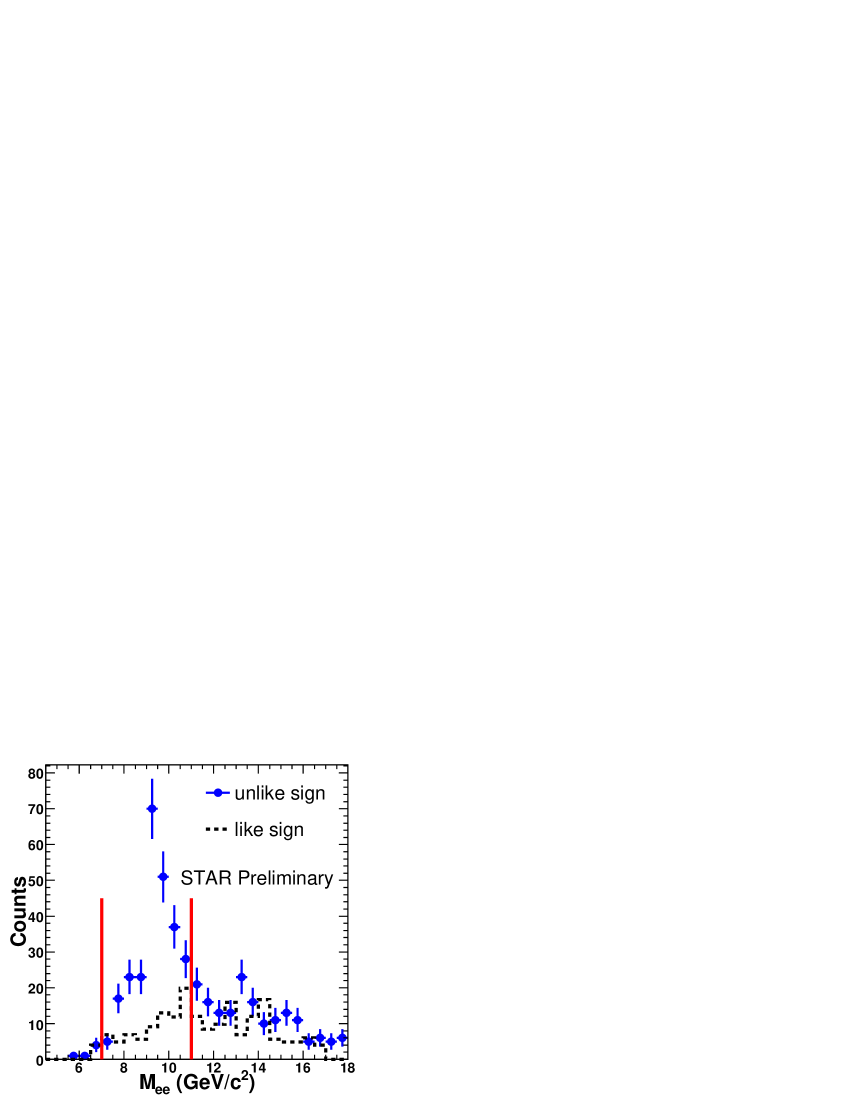
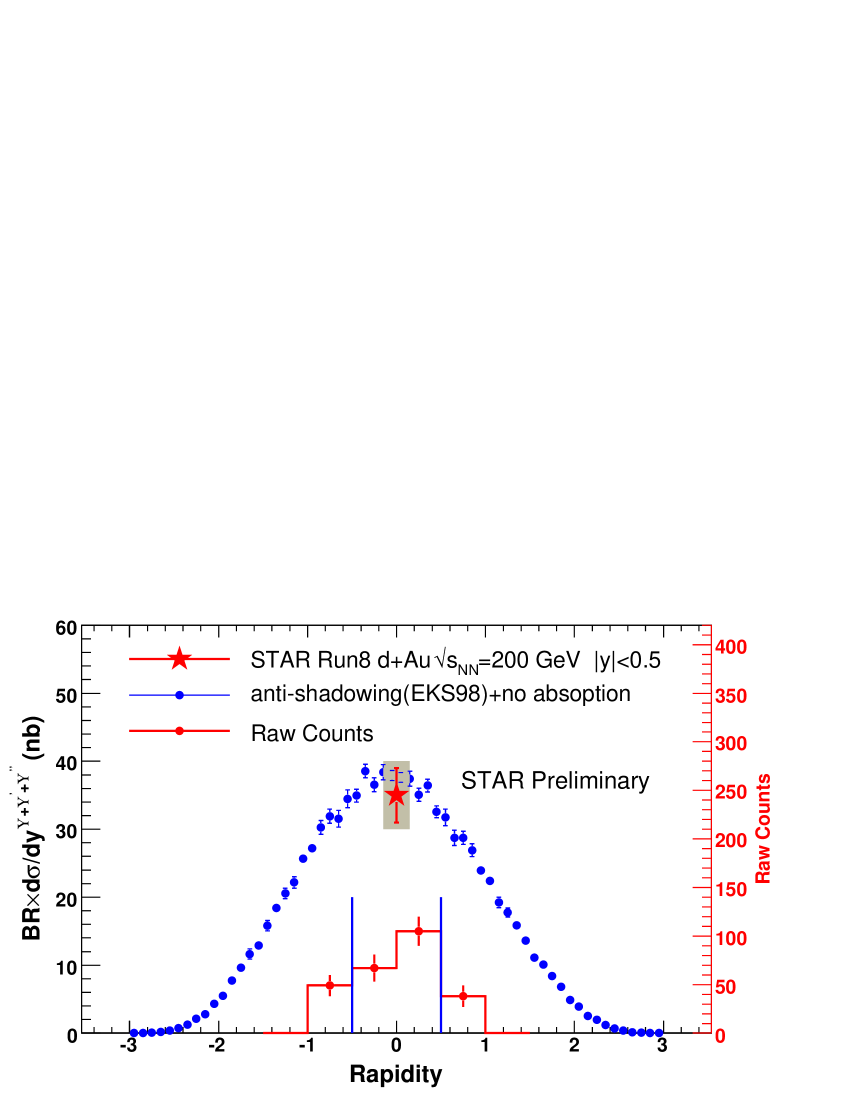
The left panels of Fig. 1 and 3 show the unlike-sign and like-sign background invariant mass spectrum in collisions and in d collisions respectively. The total yield is found to be = 67 22 (stat) in collisions and = 172 20 (stat) in d collisions. The signal significance in d+Au () is greater than that in p+p () mainly due to the removal of the Silicon detectors in the former collisions which strongly reduced the photon conversions. Figure 1 (right panel) shows the data used to obtain the and continuum yields. The data points are the unlike-sign signal after subtracting the like-sign combinatorial background. The fit includes the contributions from the states and the continuum contributions from Drell-Yan and shown as the solid-line function. The cross section is found to be = 114 38 (stat.) (syst.) pb, and the combined continuum contribution is estimated to be = 38 24 pb in the integrated yield region. Figure 2 (left panel) shows the acceptance in rapidity with the hashed histogram where the unlike-sign pairs are shown after the background subtraction. The scale on the right axis of the figure is used for the counts in the histogram. The measured cross section of the is compared to the theoretical predictions of NLO CEM [9] and upper and lower bounds of NLO CSM [10]. The NLO CEM calculation is for only and therefore the calculation is scaled with the branching ratios and the cross sections of the higher states in order to compare with the measured cross section. The CSM calculation considers the direct production only and therefore the calculation is divided by a factor of 0.42 [10] to account for the feed-down from the P-states. While the NLO CEM is in agreement with the measured cross section, the upper bound of CSM underestimates the data by 2 effect. Figure 2 (right panel) shows that the measured cross section of is consistent with the world data trend for similar measurements scanning a wide range of in different collision systems. Figure 3 (right panel) shows the measured cross section of the at midrapidity in d which is found to be =35 4 (stat.) 5 (sys.) nb. The contribution from Drell-Yan and to the di-electron yield in the mass region is estimated to be 10 based on [9] and PYTHIA. The detailed systematic uncertainty is under study. The measurement is consistent with NLO CEM calculation that includes the anti-shadowing effect, and doesn’t include absorption effect. In order to study the cold nuclear matter effect, the nuclear modification factor, which is defined as the ratio of the cross section in d collisions to that in collisions scaled with the number of binary collisions, is found to be = 0.98 0.32 (stat.) 0.28 (sys.).
4 Conclusion
The STAR experiment has measured the cross section at mid-rapidity in collisions and d collisions at = 200 GeV. The measured value in is found to be consistent with the world data trend as a function of . The NLO CEM calculations are in agreement with the measurements in and d and the NLO CSM underestimated the measured cross section in . The cold nuclear matter effect is not large, however, more statistics is needed in order to quantify such effects. The presented measurements will be used as a baseline for studying the hot nuclear matter effect in collisions. With increased luminosity, a separation between states will be possible at the STAR experiment, particularly after reducing the material budget by removing the inner tracker detectors.
5 Reference
References
- [1] T. Matsui and H. Satz, Phys. Lett. B178, 416 (1986).
- [2] A. Mocsy and P. Petreczky, Phys. Rev. D 77, 014501 (2008).
- [3] J-P Blaizot and J-Y Ollitrault, Phys. Rev. D39, 232 (1989) and references therein.
- [4] A. Andronic et al., Nucl. Phys. A 789 334 (2007) and references therein.
- [5] H. Haberzettl1 and J. P. Lansberg, Phys. Rev. Lett. 100, 032006 (2008) and references therein.
- [6] M. Anderson et al., Nucl. Instrum. Meth. A499, 659 (2003).
- [7] M. Beddo et al., Nucl. Instrum. Meth. A499, 725 (2003).
- [8] B. I. Abelev et al., arXiv:1001.2745 [nucl-ex].
- [9] A. D. Frawley, T. Ullrich and R. Vogt, Phys. Rept. 462, 125 (2008).
- [10] S. J. Brodsky and J. P. Lansberg, arXiv:0908.0754 [hep-ph].