On the Efficiency of Data Representation on the Modeling and Characterization of Complex Networks
Abstract
Specific choices about how to represent complex networks can have a substantial effect on the execution time required for the respective construction and analysis of those structures. In this work we report a comparison of the effects of representing complex networks statically as matrices or dynamically as spase structures. Three theoretical models of complex networks are considered: two types of Erdős-Rényi as well as the Barabási-Albert model. We investigated the effect of the different representations with respect to the construction and measurement of several topological properties (i.e. degree, clustering coefficient, shortest path length, and betweeness centrality). We found that different forms of representation generally have a substantial effect on the execution time, with the sparse representation frequently resulting in remarkably superior performance.
pacs:
05.10.-a, 89.75.-kI Introduction
As a consequence of the intrinsic difficulties in achieving analytical approaches for the characterization and modelling of natural systems, a great deal of such investigations has to rely on computational methods. The typical case involves the application of numerical methods in order to solve differential equations (e.g. press92:_numer_recip_in_c ; naka:2005 ), which is the most frequent situation found in practice in Physics. Frequently, such problems involve large amounts of data, as well as data which are very large. Given the importance of effectively tackling these problems, a lot of attention and efforts have been invested in developing, implementing and applying numerical methods which are fast and accurate (e.g. press92:_numer_recip_in_c ). Indeed, such efforts give rise to the important area of Computational Physics.
A peculiar situation in computational physics is found in complex networks research Barabasi:survey ; Dorogovtsev02 ; Newman:2003:survey , a new multidisciplinary area of physics which has undergone an impressive development along the last decade. Here, the investigations rely not mainly on numerical solution of differential equations, but on intensive handling of matrices as well as combinatorial or spectral methods as required for calculation of measurements Costa_surv:2007 such as shortest paths, betweeness centrality, and spectra of graphs. Though presenting such a distinctive nature, computational approaches to complex networks also aim at achieving precision and speed. The latter demand often becomes particularly critical as a consequence of the large size of several complex networks of current interest, such as the Internet Faloutsos1999 , protein-protein interaction Jeong01:Nature , and social interactions Wasserman94 , to name but a few cases.
Indeed, the effective approach to most of the remaining challenges in complex networks research is immediately related to the ability to effectively represent and process large structures. This can be done in the two following ways: (i) development of more effective algorithms; and (ii) careful and efficient respective implementation of those algorithms. While much attention has been placed recently on (i), the final performance will ultimately depend critically on the implementation, making step (ii) particularly critical for achieving good results. The current work focuses on important practical implementational aspects related to the use of sparse or full representation of graphs. As such the present article constitutes one of the few works investigating the effect of such important practical choices on the resulting efficiency of the implementation of a set of crucially important operations typically performed in complex networks research, including network generation as well as the estimation of important topological properties such as the degree, clustering coefficient, shortest path length, and betweeness centrality.
This article starts by describing the computational tasks to be performed, namely the estimation of several topological features of the networks, and follows by presenting the adopted network models and the two types of representations of networks to be compared. The work concludes by presenting and disucussing the computational efficiency of these two representations as obtained through computational simulations.
II The methods chosen for the evaluation
It is henceforth assumed that all networks are undirected and unweighted. Full representations of the networks are performed in terms of the respective adjacency matrices , such that the presence of an edge between nodes and imply , with being otherwise imposed. The total number of nodes and edges in the networks are respectively abbreviated as and . A set of four representative methods/measurements of complex networks have been selected in order to investigate the effect of implementational parameters and choices on the respective performance: degree, clustering coefficient, shortest path and betweeness centrality. Each of these methods are briefly revised in the following.
Degree: The degree of a node corresponds to the number of links attached to it. It can be calculated by adding all entries in column of the adjacency matrix. The degree is an intrinsically local measurement, in the sense of taking into account only the links directly attached to the node. Usually, the degree is calculated for all the nodes of a given network.
Clustering Coefficient: The clustering coefficient is also a local measurement, specific to each node . However, it also consider the interconnectivity between the neighbors of that node. In the case of full representation in terms of the adjacency matrix, the calculation of this measurements requires access to all the columns corresponding to each of the neighbors of node .
Shortest Path Identification: Given two nodes and , the shortest topological path between them corresponds to the path which has the smallest number of edges. Note that it is possible to have two or more distinct shortest paths of the same size.
Betweeness Centrality: The betweeness centrality is a property associated to a given node or edge. In both cases, it refers to the number of shortest paths, considering all pairs of nodes in the networks, which pass through the given node or edge. The calculation of the betweeness centrality requires the determination of the shortest paths for every pair of distinct nodes.
III Network models
In the following we use three network models. Two models due to Erdős and Rényi (ER) and the scale free model of Barabási and Albert Barabasi97 (BA). The first model, denoted ER (probability), connects each pair of vertices with a fixed probability . The average degree in this model is , where is the number of vertices in the network. The second model, denoted ER (edges), uses a fixed number of edges, and connects each edge to a randomly chosen pair of nodes. The average degree of the network is . These two models have similar statistical properties, but are included here due to their different behavior during network construction: as the first model must consider all pairs of nodes, it is computationally intensive for large networks; the second model has construction time proportional to the number of edges, and is therefore faster for sparse networks.
The Barabási-Albert networks are constructed starting with a small number of vertices, and adding vertices one by one, each new vertex being connected to existing vertices, chosen using a linear preferential attachment rule, vertices with higher degrees having higher probabilities of being chosen. The resulting average degree is given by .
IV Full or sparse representation of the networks
Two main representations were used: adjacency matrix and adjacency lists cormen09:_introd_to_algor . Adjacency matrix is a dense representation, in the sense that all possible edges in the network are explicitly included, with a value used to indicate the presence of each edge, and another value used otherwise. Adjacency lists are sparse, as only the edges present in the network are incorporated. The adjacency matrix is usually implemented as a static structures, like basic arrays used in most computer languages. On other hand, adjacency lists are implemented as dynamic structures and require pointers (a memory position pointing to another one).
For the elements of the adjacency matrix, we consider five possibilities, depending on the C language data type used for each element: double precision (double, 64 bits) and single precision (float, 32 bits) floating point number, integer numbers (int, 32 bits), boolean values (which can assume only true and false values, 8 bits) and bits. This last element representations does not have a corresponding type in C, and was implemented using an int value to store 32 elements of the matrix, with bit manipulation operations used to access the individual bit values.
In the adjacency lists representation, a list is maintained for each vertex, with the numbers of the vertices that are neighbors to it. This representation uses an integer value for each neighbor and an overhead for list administration. Nevertheless, it spares memory space for sparse networks.
V Results and discussion
We study the execution time needed for the generation of the network and for the computation of the following network measurements: average degree, clustering coefficient, all-pairs distances and betweenness centrality. The effect of the various network representations is evaluated as a function of the network size and average degree.
V.1 Network generation times for different network sizes
We first consider the effect of network size on the execution time needed for the generation of the networks, using different network representations.
V.1.1 ER (probability) model
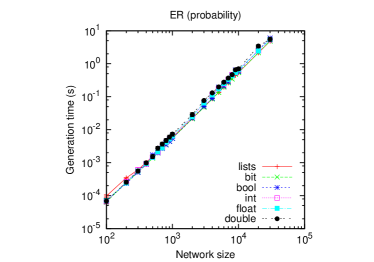
We start by investigating how the generation of ER networks is affected by the choice of different graph representations. The execution times required to produce ER networks of several sizes, and average degree 10, are shown in Figure 1(a).
(a)
 (b)
(b)
 (c)
(c)
Generally speaking, the different types of graph representation clearly had little effect on the execution time.
The reason why the execution times resulted similar is that most of the computational effort is invested in considering all pairs of nodes to be connected with constant probability.
V.1.2 ER (edges) model
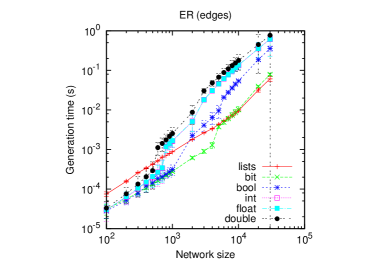
Figure 1(b) depicts the execution times obtained for generation of ER networks with edges for different networks sizes and average degree equal to 10.
Unlike the results obtained previously, now the adoption of different types of graph representations has a marked effect on the respective execution times. In particular, the improvements allowed by the more memory-effective representations (bit and list) are now evident. Interestingly, a sharp change of execution times in the matrix cases is observed at about . This abrupt increases occurs when the capacity of the cache of the microcomputer is exceeded by larger sizes of graphs. Though the list representation is initially slower than the matrix cases, it becomes faster and faster with the increase of .
The substantial differences now observed between the execution times obtained for the diverse representations are a consequence of the fact that the smaller time required for the choice of the pairs to be connected implies that the intrinsic access time for each type of representation becomes more pronounced.
V.1.3 BA model
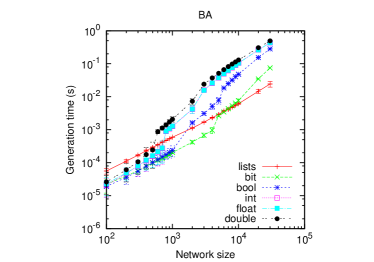
The generation times obtained for BA networks with average degree 10 are shown in Figure 1(c). As with ER, the list and bit representations provide the fastest execution times for large values of . Along the region where the cache is large enough to cope with the graph size, the bits representation is the fastest option, but with the increase of the list implementation becomes progressively more effective. This is a consequence of the fact that the computational cost with a list representation is linear with , while cost with the matrix representation increases with . As before, the matrix-based implementations tend to be slower.
V.2 Computation time of some measurements for different network sizes
We turn now our attention to the effect of network size on the computation time of some network measurements, for the various network representations.
V.2.1 Average degree
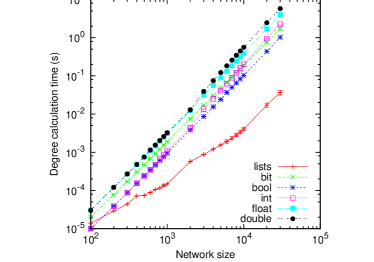
We now turn our attention to the effect of different graph representations on the execution time required for the calculation of some of the principal measurements of the topology of the graphs. We start by investigating the execution times required for determination of the average degree. Figure 2(a) depicts the obtained results for BA networks with varying sizes and average degree equal to 10.
(a)
 (b)
(b)
 (c)
(c)
 (d)
(d)
It is clear that the list implementation allows a dramatic reduction of the execution times for most network sizes. The other implementations required similar execution times and, as could be expected, the double representation implied the longest execution times.
V.2.2 Clustering coefficient
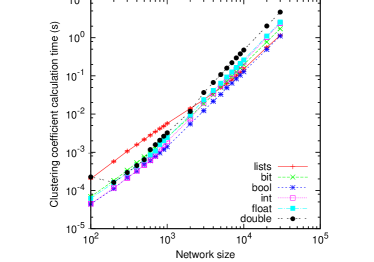
Figure 2(b) shows the execution times obtained for the calculation of the clustering coefficient of BA networks of several sizes and average degree 10. As a consequence of the fact that this measurement demands more computations than the average degree, the execution times resulted larger than those in Figure 2(a). Interestingly, the several tested representations led to similar execution times, with the list and bool implementations providing particularly good efficiency for large values of .
V.2.3 All-pairs distances
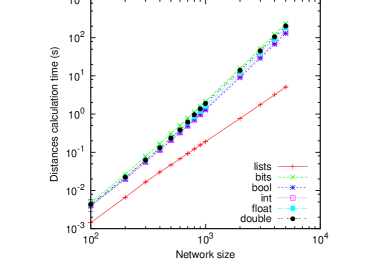
Figure 2(c) presents the execution times obtained while calculating the average shortest distance lengths for several BA networks with average degree equal to 10. Similarly to the betweeness centrality, this measurement also requires intensive computations.
The results are similar to those obtained for the betweeness, but the relative improvement allowed by the lists implementation is still larger now.
V.2.4 Betweenness centrality
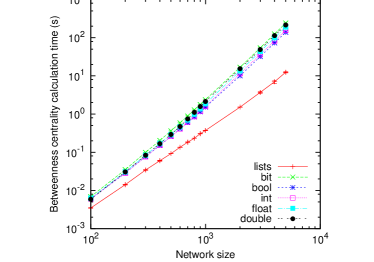
We also investigated how the time required for the calculation of the betweeness centrality varied with the several adopted implementations. Figure 2(d) shows the obtained results for BA networks of several sizes and average degree equal to 10.
The substantially more complex nature of this measurement has been clearly reflected in the larger execution times. While little differences can be noticed for most implementations, the list representation allowed, again, substantially faster execution times, representing the fast option for all values of . Indeed, the relative improvement obtained with lists clearly seems to increase with the network size. This implies that the use of lists becomes critical for allowing calculation of betweeness in particularly large networks.
V.3 Network generation times for different average degrees
So far we have probed how the execution time varies with the network size for a fixed average degree (equal to 10). Now, we proceed to investigate how the speed is influenced by different values of average degree. This will allow us to get insights about the generality of the previously observed trends. In principle, it could be expected that the larger the average degree of a network, the smaller would be the benefits provided by the lists, because the matrices would become less sparse. Therefore, special attention is henceforth focused on this potential effect.
V.3.1 Network generation time for the BA model
Figure 3 shows the execution times, in terms of the average degree, obtained for generating BA networks while using the several representations. The network size is henceforth fixed at .
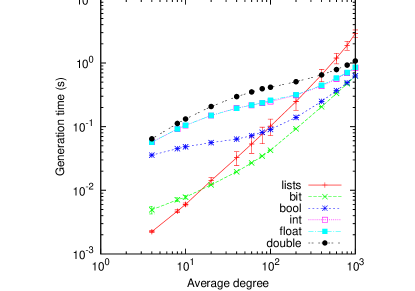
The results are evident and confirm that the use of lists guarantees higher speed up to about average degree 100, decreasing steeply thereafter. Particularly interesting is the behavior of the bits implementation, which overtakes the lists from average degree 20. This fact suggests that the execution time seems to be strongly affected by the memory which is demanded by each implementation. With the increase of the average degree, the matrix implementations become progressively more effective, while the bits, and particularly the list, implementations loose their effectiveness.
V.4 Computation time of some measurements for different average degrees
Now we consider the effect of the average degree in the computation of some network measurements for different graph representations.
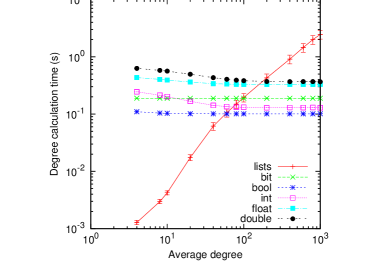
V.4.1 Average degree
Figure 4(a) depicts the execution time, in terms of the average degree, required to calculate the average degrees of BA networks with size .
(a)
 (b)
(b)
 (c)
(c)
 (d)
(d)
While the speed of the matrix implementations do not depend on the average degree of the original network, the relative efficiency of the list representation is dramatic for average degree values up to about 80, decreasing progressively for larger values, until becoming rather ineffective. With the matrix representation, the computation of the average degree involves adding along the rows, which has a constant cost, therefore becoming independent of the network average degree. On the contrary, in the case of list representation the average degree is calculated over a varying number of elements which grow linearly with the network degree.
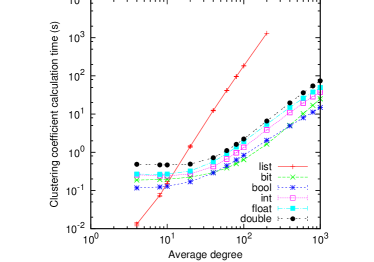
V.4.2 Clustering coefficient
The dependency of the execution times required for calculation of the clustering coefficient is shown in Figure 4(b), in terms of several average degrees of BA networks.
The general trends verified in this graph are similar to those obtained for the networks generation and average degree calculation. However, the relative advantage of the list implementation is less marked, becoming less effective for networks with average degrees larger than 10.
The calculation of the clustering coefficient requires the identification of the links between the immediate neighbors of the reference node. In other words, it is necessary to check the existence of a link between each pair of nodes and connected to the reference node. In the case of the matrix representation, this can be done easily by checking the position in the adjacency matrix. However, in the case of the list representation, this requires going through the whole list of nodes that are adjacent to node while searching for node .
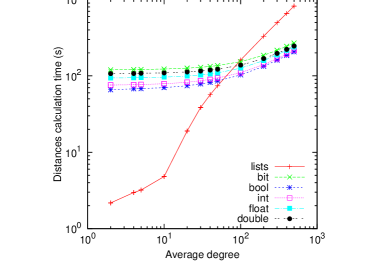
V.5 All-pairs distances
The estimation of the shortest distances in terms of the average degree is shown in Figure 4(c). The relationship between the times required for the calculation of these measurements is similar to the three previous cases, with the difference that the critical average degree for which the dynamic representation is no longer the gfastest option is nos between 50 and 60 for the BA model. This critical degree is certainly dependent of the size of the network.
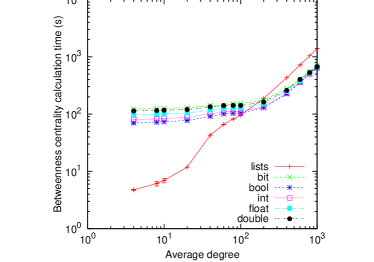
V.6 Betweenness centrality
Regarding the relationship between the average degree and the betweeness centrality, shown in Figure 4(d), a relationship similar to that obtained for the two previous cases has been observed. However, now we have a higher average degree for which the dynamic representation becomes worse than the others. This degree is dependent of the size of the network, in the case of , this critical average degree is 100.
VI Concluding Remarks
Though the development of more effective algorithms for complex network generation and characterization can lead to great computational savings, we have shown that the choice of adequate network representation can have major impact on the overall execution time. More specifically, we compared full and sparse schemes for representing the connectivity of the networks while generating networks and calculating several measurement of their topology. The sparse representation resulted generally more effective than the full scheme, with the exception of the cases when the networks have very large average degree. We also investigated the effect of having diverse data types such as byte, integer, float, double and bit. In general, the shorter data types led to superior performance as a consequence of the smaller amount of memory to be accessed.
The obtained results and trends suggest a number of further investigations. For instance, it would be interesting to consider other network models and measurements, as well as to assess the effect of different types of hardware, compilers and operating systems.
Acknowledgements.
Luciano da F. Costa thanks CNPq (301303/06-1 and 573583/2008-0) and FAPESP (05/00587-5) for sponsorship.References
- [1] W. H. Press, S. A. Teukolsky, W. T. Vetterling, and B. P. Flannery. Numerical Recipes in C. Cambridge University Press, 2nd edition, 1992.
- [2] N. J. Giordano and H. Nakanishi. Computational Physics. Benjamin Cummings, 2nd edition, 2005.
- [3] R. Albert and A.-L. Barabási. Statistical mechanics of complex networks. Reviews of Modern Physics, 74:48–98, 2002.
- [4] S. N. Dorogovtsev and J. F. F. Mendes. Evolution of networks. Advances in Physics, 51:1079–1187, 2002.
- [5] M. E. J. Newman. Structure and function of complex networks. SIAM Review, 45(2):167–256, 2003.
- [6] L. da F. Costa, F.A. Rodrigues, G. Travieso, and P.R. Villas Boas. Characterization of complex networks: A survey of measurements. Advances in Physics, 56:167–242, 2007.
- [7] M. Faloutsos, P. Faloutsos, and C. Faloutsos. On power-law relationships of the Internet topology. Computer Communication Review, 29(4):251–262, 1999.
- [8] H. Jeong, S. P. Mason, A.-L. Barabási, and Z. N. Oltvai. Lethality and centrality in protein networks. Nature, 411(6833):41–42, 2001.
- [9] S. Wasserman and K. Faust. Social Network Analysis. Cambridge University Press, Cambridge, 1994.
- [10] A.-L. Barabási and R. Albert. Emergence of scaling in random networks. Science, 286:509–512, 1997.
- [11] T. H. Cormen, C. E. Leierson, R. L. Rivest, and C. Stein. Introduction to algorithms. MIT Press, 3rd edition, 2009.