A dozen new galaxies caught in the act: Gas stripping and extended emission line regions in the Coma cluster 111Based on data collected at the Subaru Telescope, which is operated by the National Astronomical Observatory of Japan.
Abstract
We present images of extended H clouds associated with 14 member galaxies in the Coma cluster obtained from deep narrow band imaging observations with the Suprime-Cam at the Subaru Telescope. The parent galaxies of the extended H clouds are distributed farther than 0.2 Mpc from the peak of X-ray emission of the cluster. Most of the galaxies are bluer than and they account for 57% of the blue () bright ( mag) galaxies in the central region of the Coma cluster. They reside near the red- and blue-shifted edges of the radial velocity distribution of Coma cluster member galaxies. Our findings suggest that the most of the parent galaxies were recently captured by the Coma cluster potential and are now infalling toward the cluster center with their disk gas being stripped off and producing the observed H clouds.
1 Introduction
Clusters of galaxies are ideal laboratories for investigating environmental effects on galaxy evolution. It is well known that galaxies residing in the central region of clusters are generally deficient in gas(e.g., Giovanelli & Haynes, 1985; Gavazzi, 1987; Solanes et al., 2001; Boselli & Gavazzi, 2006; Bravo-Alfaro et al., 2009). This indicates that some gas removal mechanisms work quite efficiently in the cluster center. Recently, van der Wel et al. (2010) studied the shape and magnitude of quiescent galaxies in SDSS and found that galaxies in dense environments include gas-removed spiral galaxies, adding to the evidence for rapid gas removal. A number of possible physical processes have been proposed to explain efficient gas removal in clusters: ram pressure (Gunn & Gott, 1972) or viscous stripping (Nulsen, 1982), tidal stripping by galaxy-galaxy interactions (Toomre & Toomre, 1972), or the cluster potential (Byrd & Valtonen, 1990), evaporation (Cowie & Songaila, 1977), and to a lesser degree, galaxy harassment (Moore et al., 1996).
One critical clue for understanding the gas removal is detection of the stripped gas. Recent deep H imaging observations revealed that some of the galaxies in clusters are accompanied by H clouds. In the nearby cluster Abell 1367, Gavazzi et al. (2001) found extended ionized gas regions associated with starburst irregular galaxies. The sizes of the regions are 758 and 508 kpc. Yoshida et al. (2002) discovered another extended emission line region (35 kpc) in the Virgo cluster, which was found to be a part of 11025 kpc of HI gas (Oosterloo & van Gorkom, 2005). Yagi et al. (2007) reported a narrow and long (602 kpc) H emitting region associated with a galaxy of the Coma cluster. Sun, Donahue & Voit (2007) found a 40 kpc H tail of a galaxy in Abell 3627. The galaxy also had a 70 kpc X-ray tail. Sun et al. (2010) investigated the galaxy to show two of 80 kpc tails, and also reported one more galaxy with 20 kpc H tail in the cluster. Kenney et al. (2008) detected 120 kpc H filaments from NGC 4438, a spiral galaxy in the Virgo cluster. Yoshida et al. (2008) reported a galaxy with detached H clouds with young blue stars in the Coma cluster, which resembles two galaxies in z0.2 clusters reported by Cortese et al. (2007). These H cloud findings imply that gas removal mechanisms to form such extended emission line regions are common in clusters of galaxies. However, it is not yet clear how common this phenomenon is.
The Coma cluster is the nearest rich cluster of galaxies, and is the best target for investigating the H clouds in the cluster environment with a deep and spatially resolved observation. We have performed a deep H narrow band imaging survey of the Coma Cluster using the Suprime-Cam at the Subaru Telescope and have already reported some of the prominent clouds detected (Yagi et al., 2007; Yoshida et al., 2008). Here, we report significant, extended H clouds around further 12 galaxies, increasing the sample to a total of 14. This is the first paper in a series providing a statistical discussion of extended emission line regions in the central region of the Coma cluster. The nature of the clouds and physical interpretations will be presented in subsequent papers.
2 Observation and Data Reduction
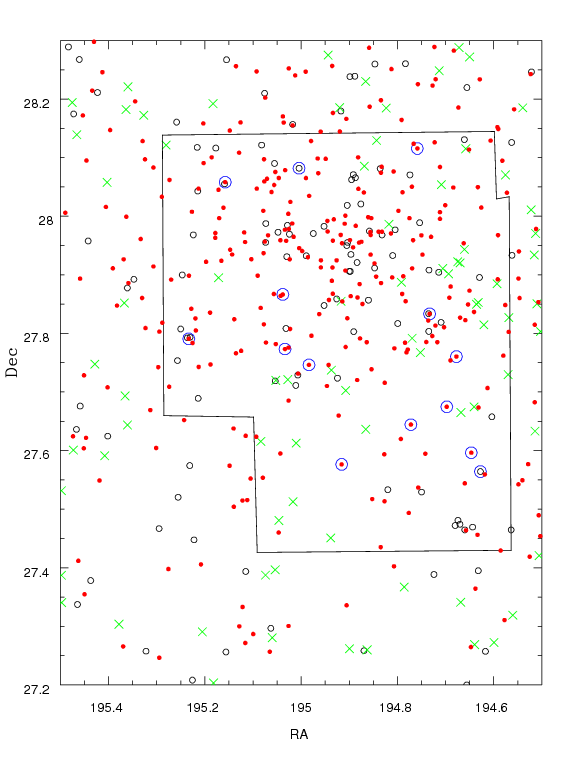
We observed a field around the Coma cluster center ()(J2000.)=(12:59:26,+27:44:16) with Suprime-Cam (Miyazaki et al., 2002) at the Subaru Telescope in 2006-2009. The field position and orientation are shown in Figure 1, and the observations are summarized in Table 1. The observed region was within 1 Mpc from the center, which is less than half of the virial radius of the Coma cluster (2.8 Mpc; Okabe, Okura & Futamase, 2010). We used three broadband filters (B, R, i), and a narrowband filter (N-A-L671, hereafter NB). The NB-filter was designed for observing H emitting objects in the Coma cluster at z=0.0225, and has bell-shaped transmission with a central wavelength of 6712 Å and FWHM of 120 Å (Yagi et al., 2007; Yoshida et al., 2008).
The imaging data were reduced in a standard manner. Overscan subtraction, flat-fielding, distortion correction, background subtraction and mosaicing were performed using another implementation (nekosoft; Yagi et al., 2002) of the standard Suprime-Cam reduction software. Satellite trails and contaminated pixels with saturated photons were masked manually before mosaicing. The flux calibration was performed using the seventh Data Release (Abazajian et al., 2009, hereafter DR7) of the Sloan Digital Sky Survey (SDSS) photometric catalog. The details are described in Appendix A.
The limiting surface brightness and PSF sizes of the final B, R, i, and NB images are listed in Table 1. The limiting surface brightness was estimated by photometry of randomly sampled apertures 2 arcsec in diameter. We used the median of an absolute deviation (MAD) multiplied by a factor as a robust estimator of the rms. The factor was calculated by solving erf(1/f)=3/4
and MAD equals to the rms, when the error followed a Gaussian distribution.
3 Detection of H Clouds
3.1 H image
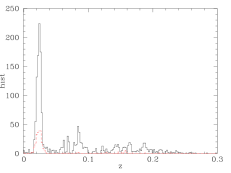
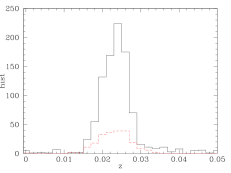
Figure 2 shows the redshift distribution of galaxies brighter than mag within a radius of 2 degrees from the cluster center, and those in our observed field. Redshifts were taken from SDSS DR7 spectroscopic catalog. Based on Fig. 2, we defined the galaxies with z as Coma member galaxies.
To detect H clouds, we subtracted the R-band image from the NB image. Here, we refer to the R-band subtracted NB-band image as the H image. First, the typical color of Coma members was estimated by multiplying the filter response to the SDSS spectra of galaxies with z. There are 395 galaxies in the redshift range with SDSS spectra in our observed field. The results are shown in Figure 3, where color is plotted as a function of SDSS color and Suprime-Cam color . As the is calculated from the SDSS spectrum, we use fiberMag for , which corresponds to the color of the central 3-arcsec aperture. The large dots represent the galaxies with equivalent width EW(H)10Å in SDSS. Figure 3 shows that the color of galaxies with EW(H)10Å correlates with the and color. The lines are the regression line for EW(H)1Å galaxies:
or
This relation is useful in the analysis of emission line galaxies. The main purpose of this study, however, was to detect nebulous features, where neither information nor our color are necessarily available with a reliable S/N ratio. Therefore, we used the median color of these member galaxies, =0.065 mag, as the color of a typical Coma passive galaxy, i.e., a galaxy with no H emission. We scaled the R-band image so that such galaxies had values of 0 in the H image. As slight (1 pix, 0.2 arcsec) positional shifts between the R-band and NB-band remained in some regions, sub-pixel alignment was performed by the method of Yagi (2010) before subtraction.
We also constructed a three-color image from B, R, and NB. The colors of the member galaxies in B, R, i, and NB in the Suprime-Cam filter system were calculated from SDSS spectra. We adopted a scale such that those galaxies with =1.0, =0.065, and =0.2 were gray in the three-color image.
In the H image, clouds were searched by visual inspection. Ghosts of bright stars and residuals of background subtractions were carefully checked and excluded. The correlation of and color (Figure 3) suggested that red galaxies would have residuals in the H image, while blue galaxies would have negative values. This point was verified using B and i-band data. If a region was bright in NB and also red in the and colors, it was regarded as a residual. If the color was blue, however, it was regarded as a star-forming region, and was included in our sample of H clouds.
3.2 List of clouds and parameter measurements
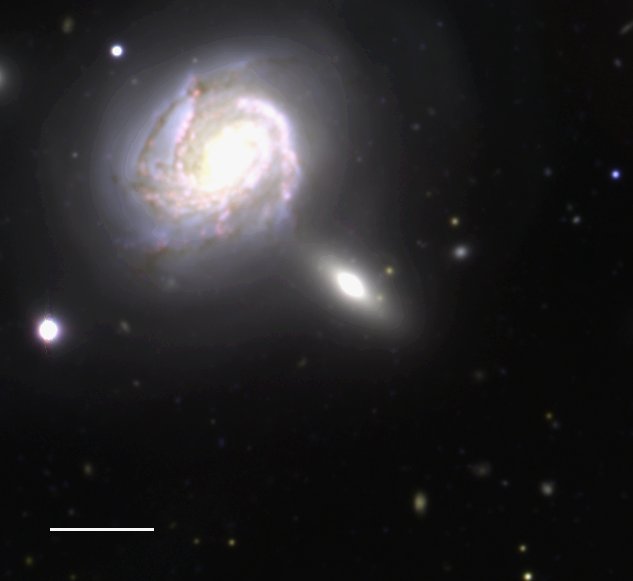
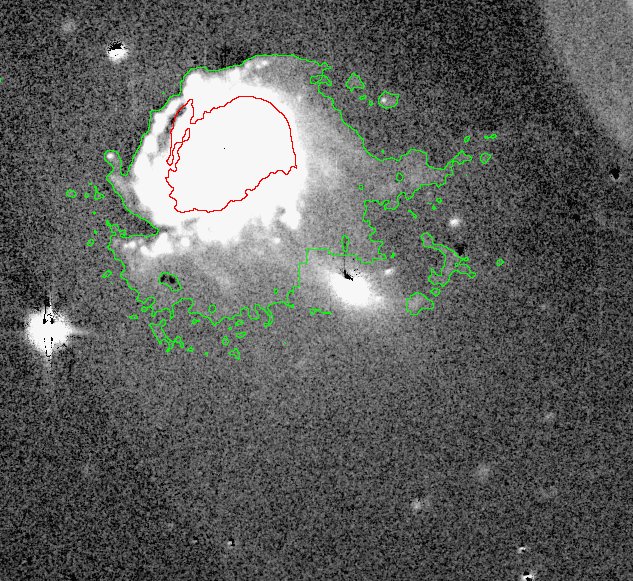
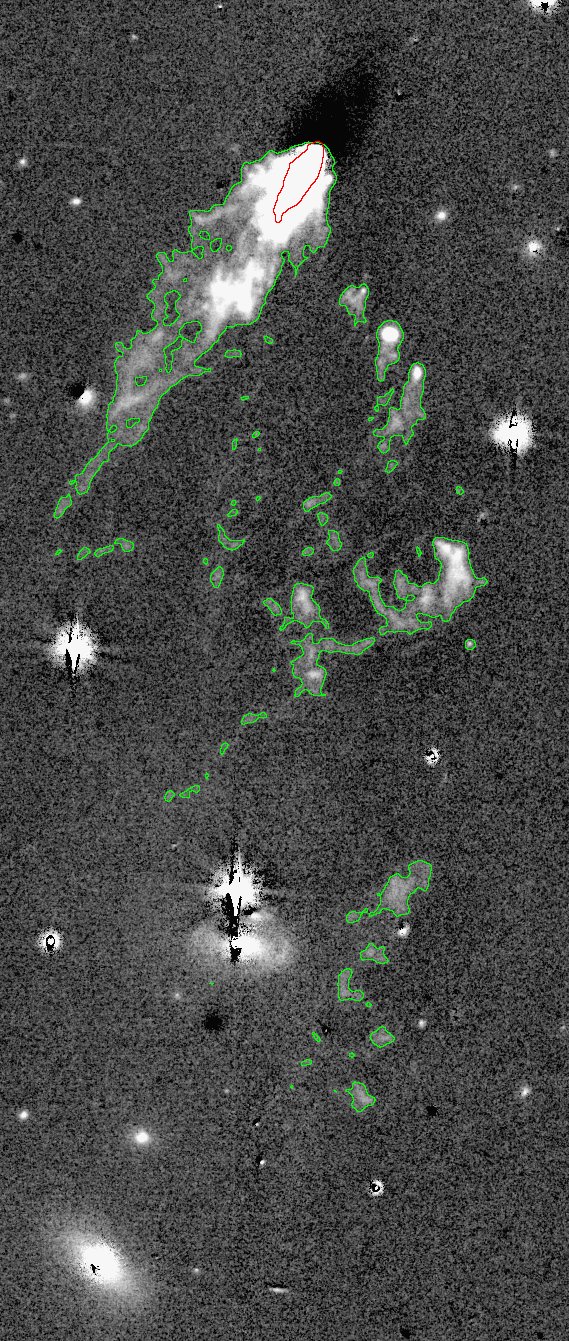
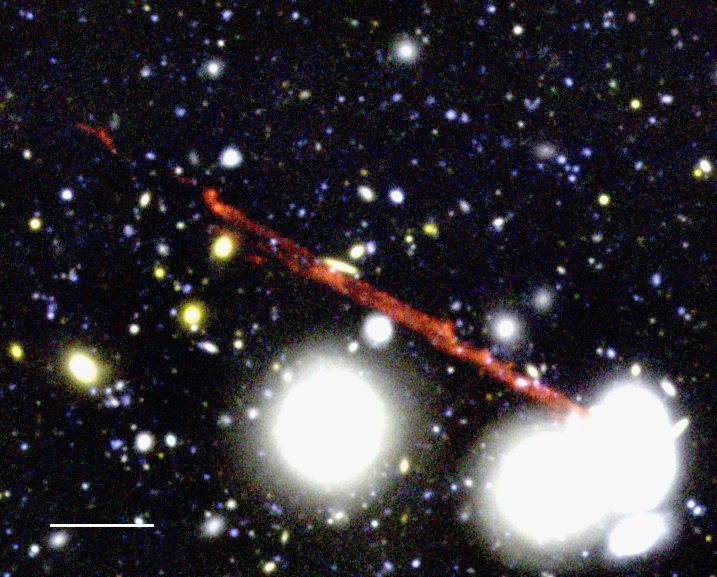
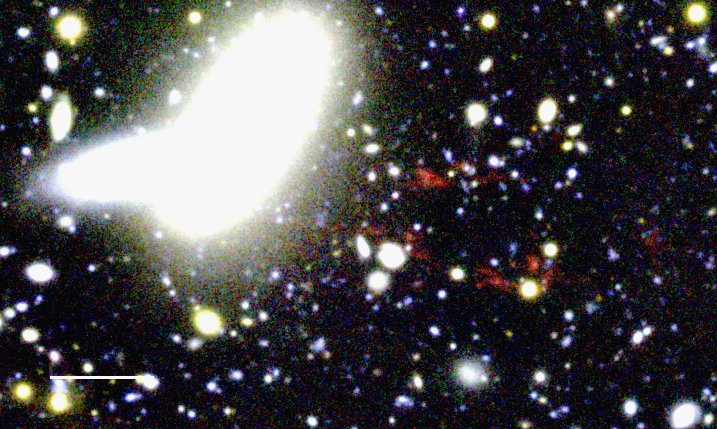
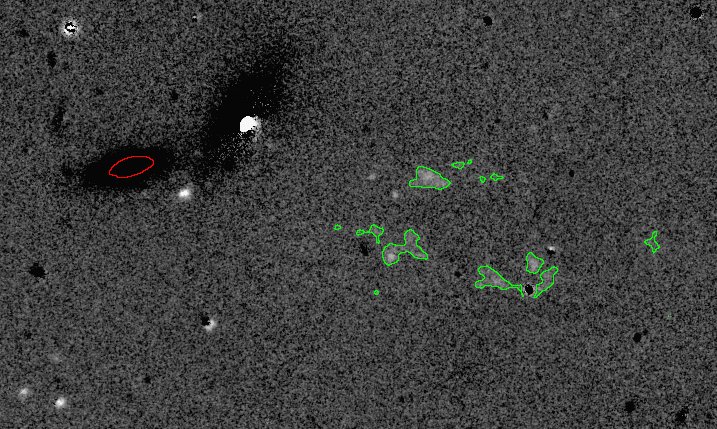
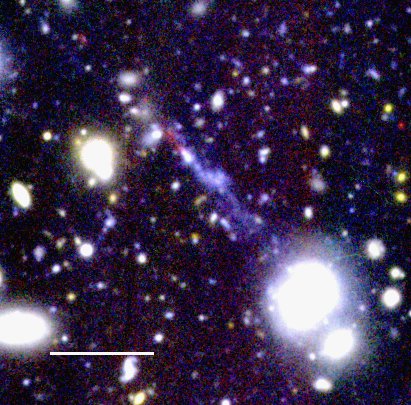
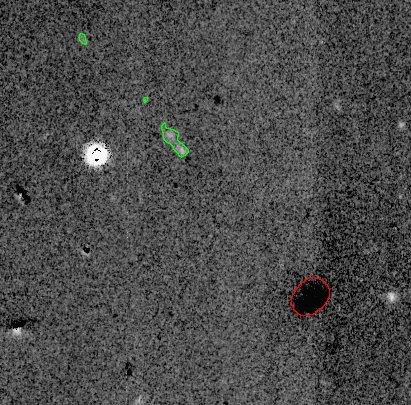
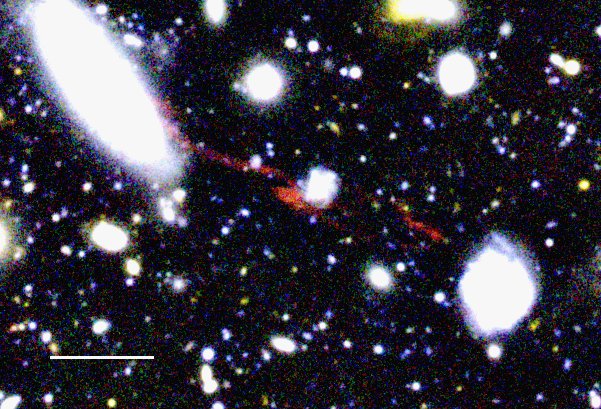
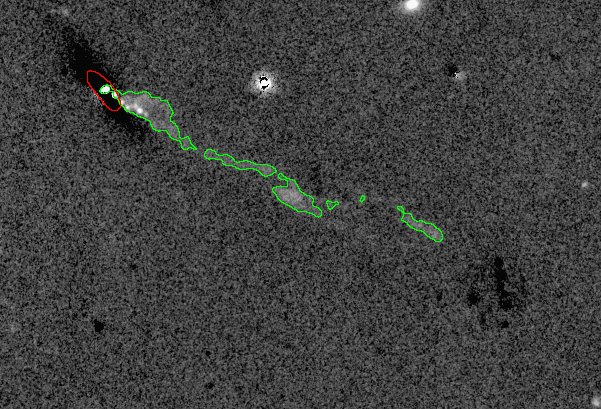
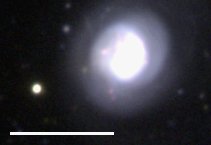
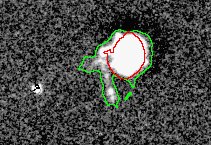
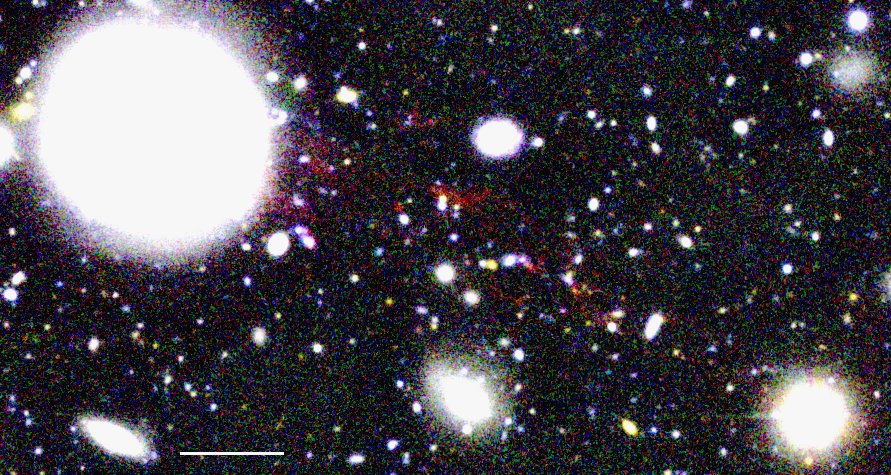
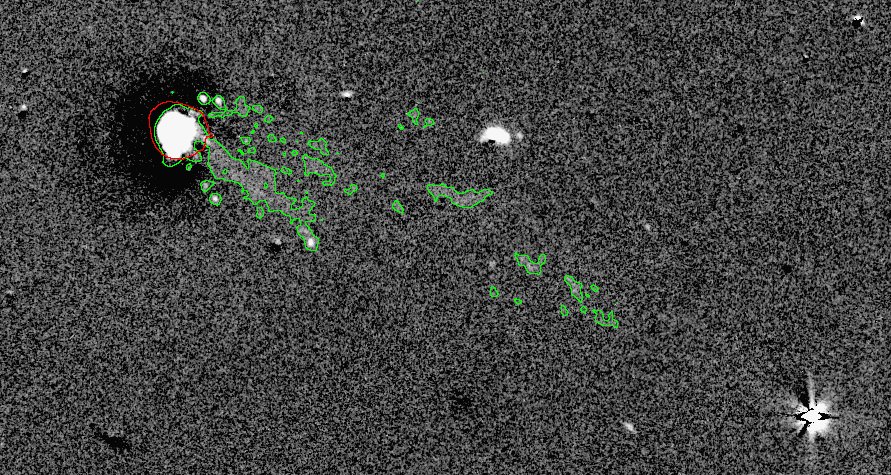
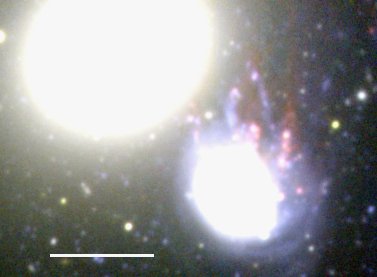
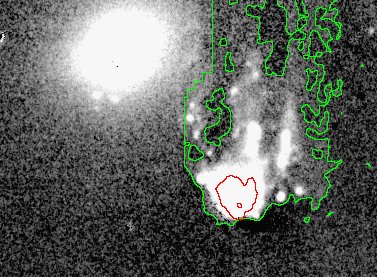
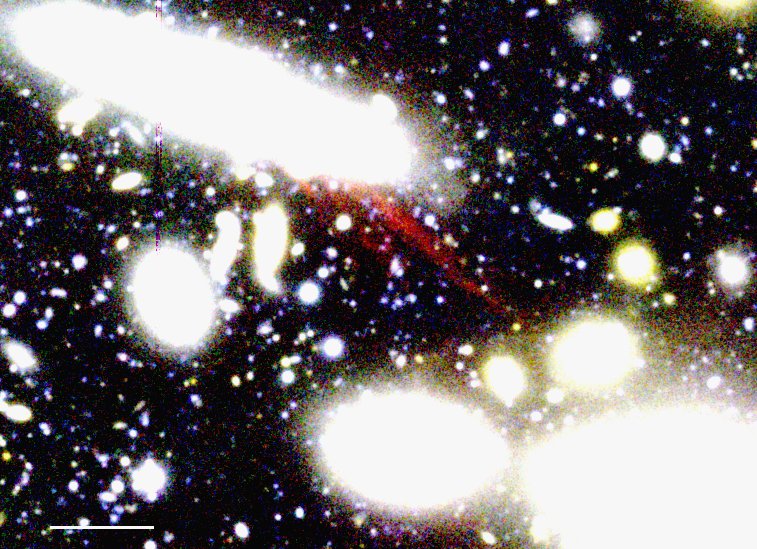
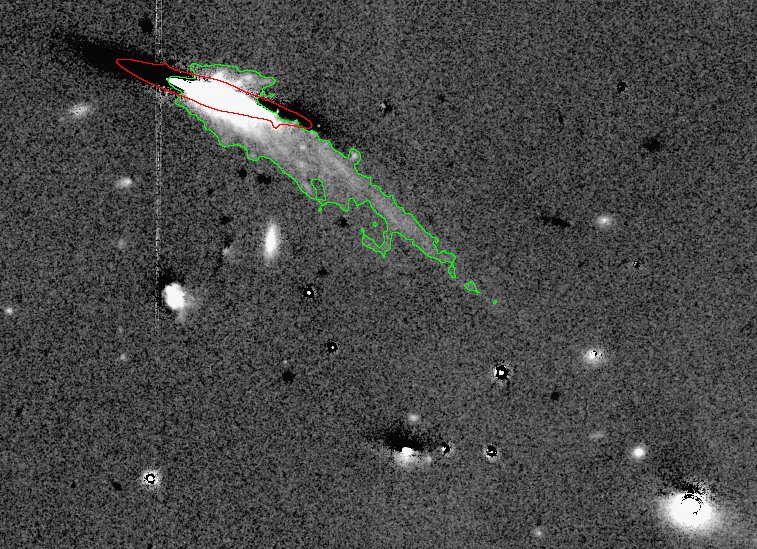
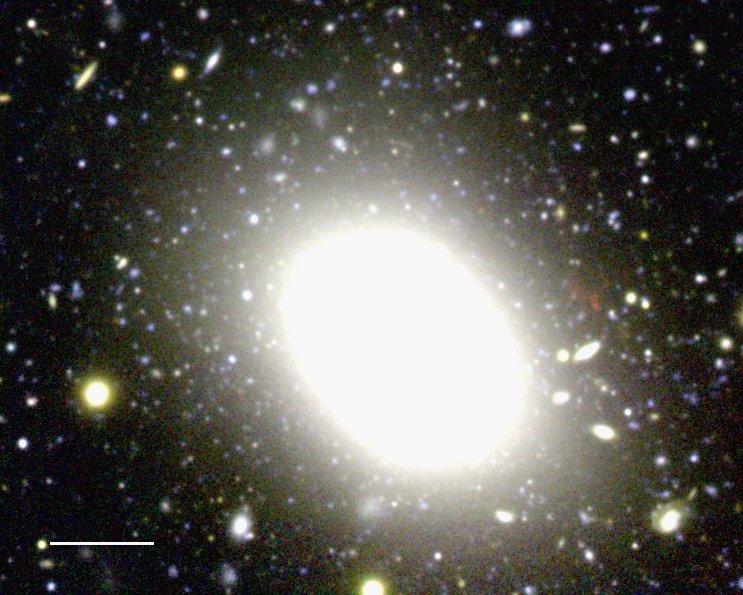
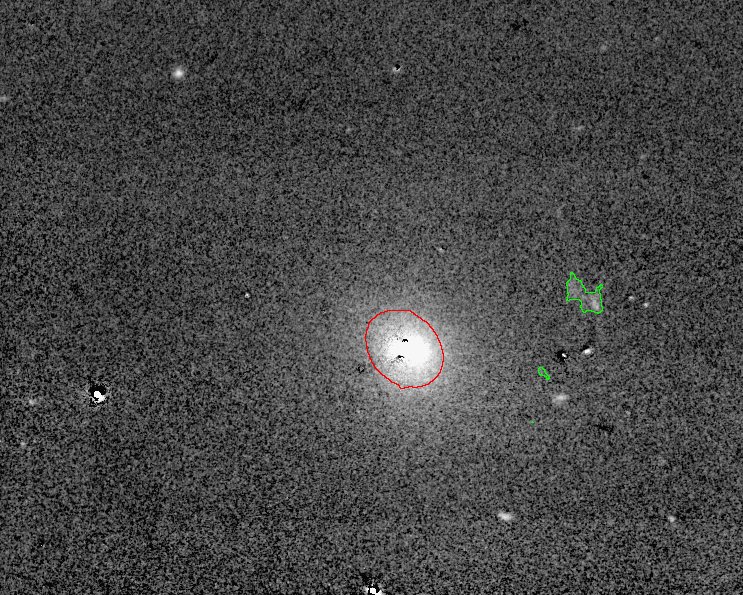
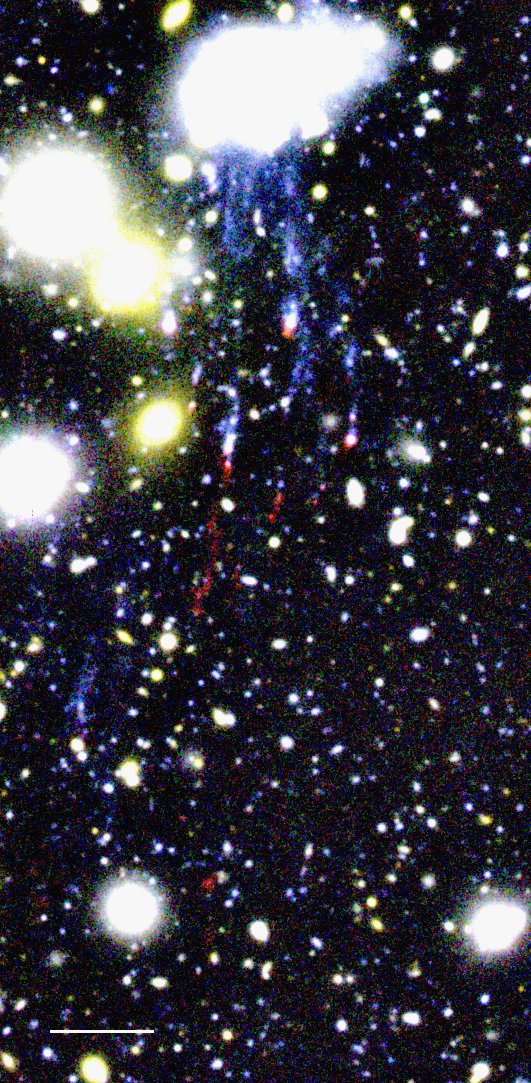
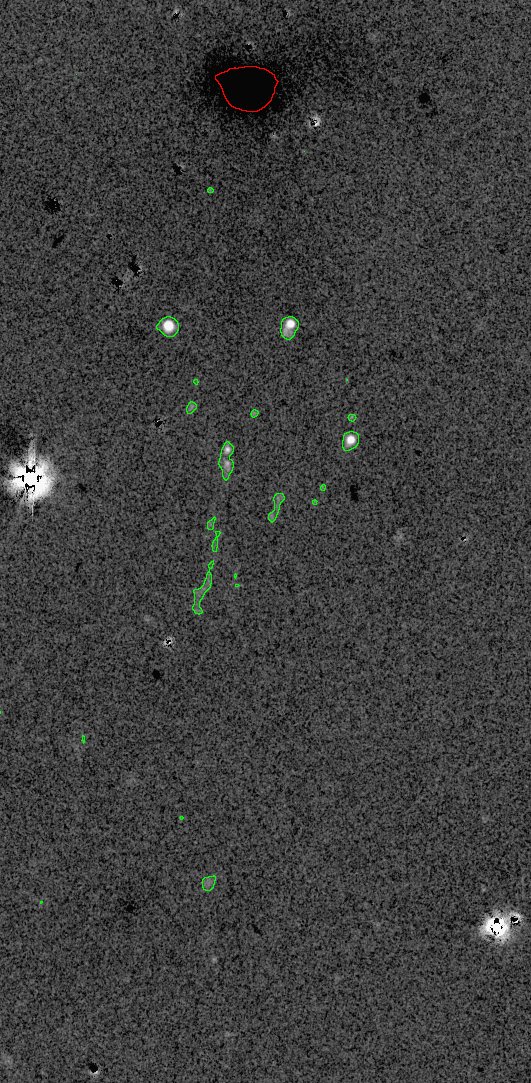
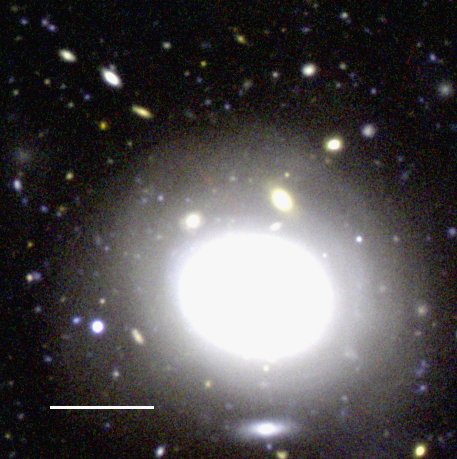
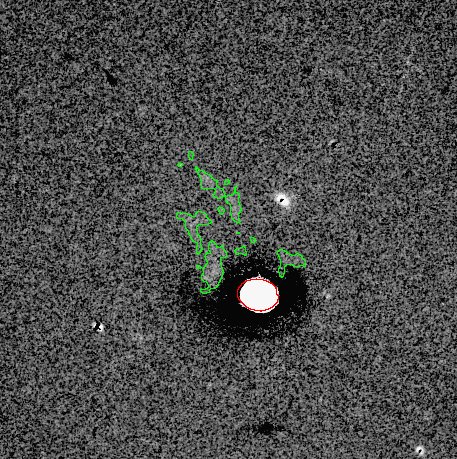
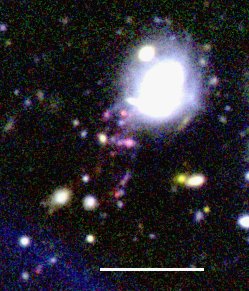
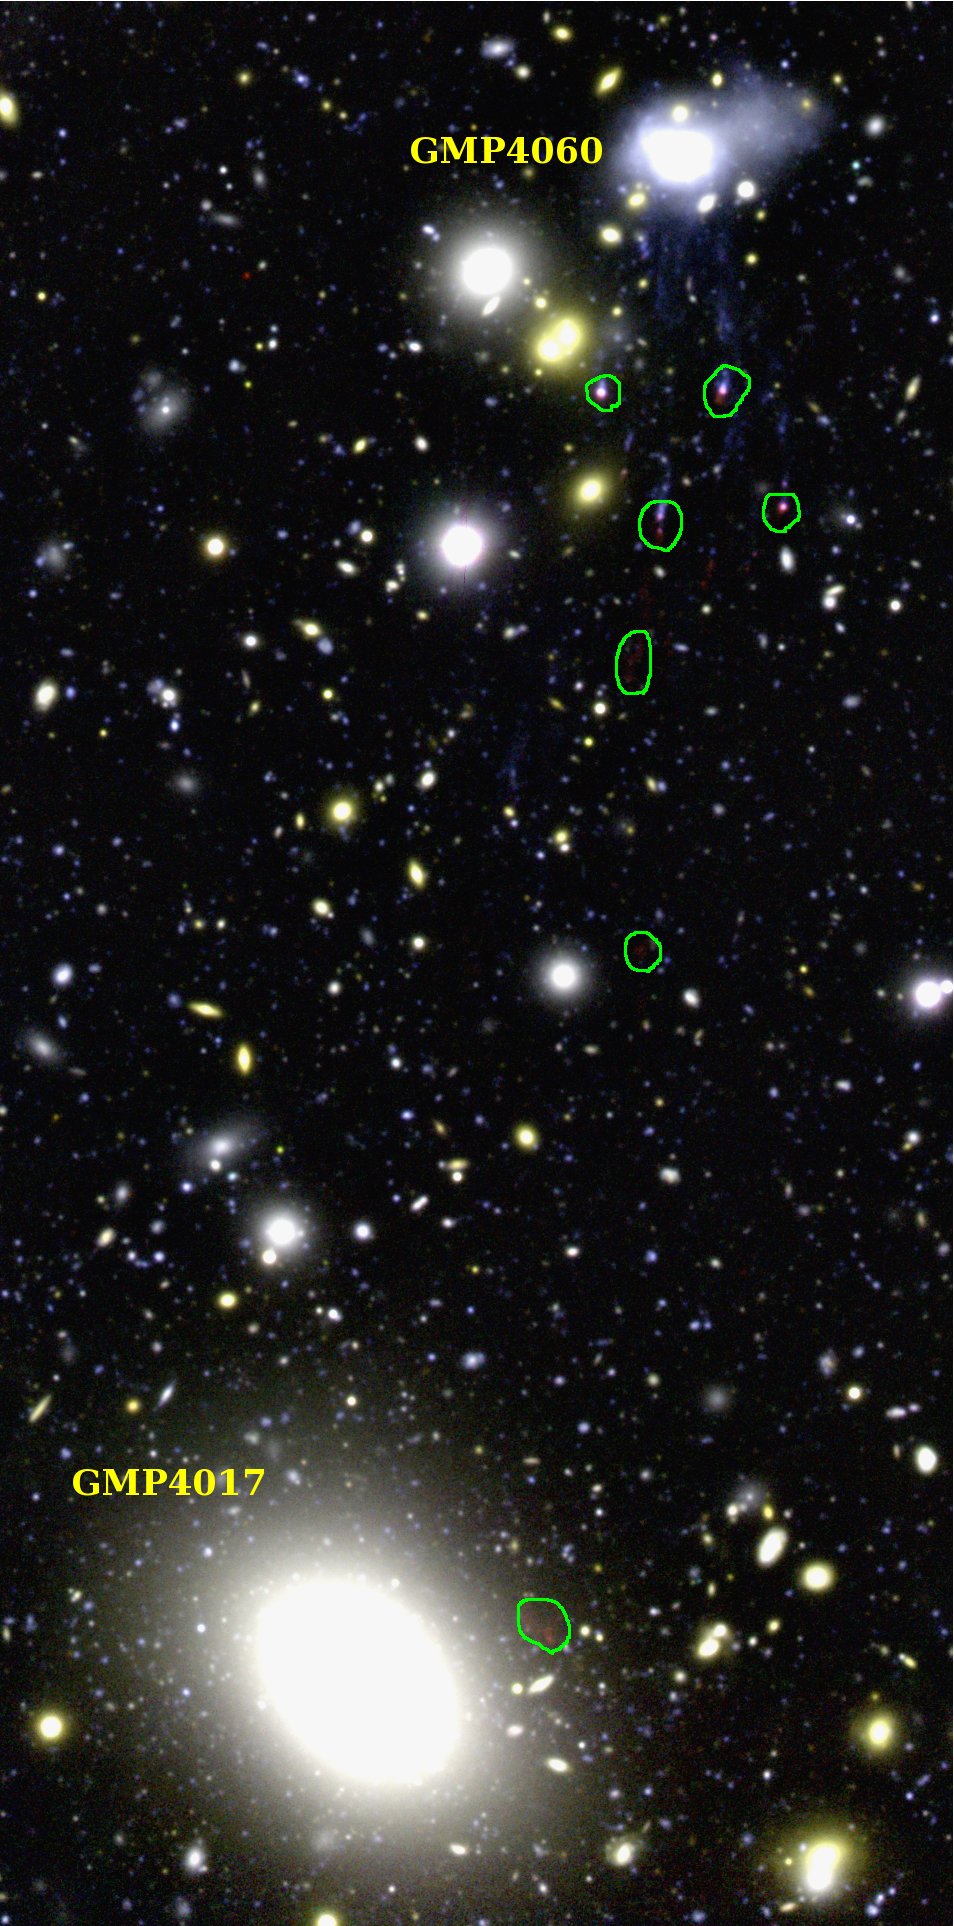
All of the extended H clouds detected here are shown in Figure 4A-4N and listed in Table 2. We named the clouds after possible associated galaxies (hereafter, parent galaxies), using the galaxy IDs of Godwin et al. (1983). The contrast of three-color composites (left images) was selected arbitrarily according to the brightness of the parent galaxy, while the color balance was fixed. A pure red color represented H emission without any stellar light, purple represented H emission with some stellar light, and blue color represented light from young blue stars without any H emission. In Figures 4E and 4L, we can see blue filaments from the parent galaxy in the left image, while no H emission is present in the right image. These are the “fireball” features reported by Yoshida et al. (2008).
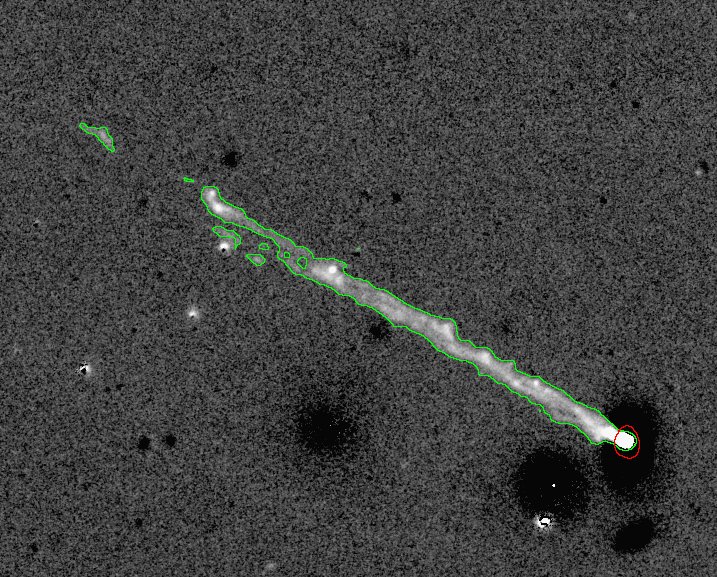
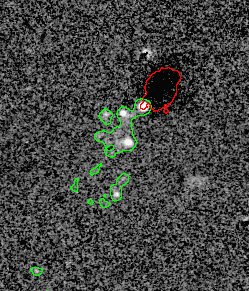
The contrast of the H image (right images) is the same for Figures 4A-4N. Therefore, the gray colors could be compared directly among the figures to measure the apparent H brightness. The green line in the H image represents the isophote of the H-image at 2.5 erg s-1 cm-2 arcsec-2, assuming that the clouds have the same redshift as the parent. The red contour represents the isophote of our R-band image, which was useful for comparing the extension of clouds with stellar light. The R-band isophote was chosen so that the region inside it contained the same area as the aperture of the r-band half light radius (PetroR50) of SDSS, because the bright galaxies in our R-band image had saturated pixels and we were not able to measure the radius in our data directly. In addition, the isophotal treatment was appropriate as the parents had distorted shapes.
We performed spectroscopic observations of some of the clouds using the Faint Object Camera and Spectrograph (FOCAS, Kashikawa et al., 2002) in multi-object spectroscopy (MOS) mode on 23 Jun 2006, and 19 May 2009 UT. The case of GMP2910(D100) was reported previously in Yagi et al. (2007). Other cloud results the clouds will be described in Yoshida et al. (in preparation). In this study, we used the spectroscopic result indicating that four clouds had similar redshifts to their respective parent galaxies (GMP2559, GMP2910, GMP2923, and GMP4060). In Figure 4D, GMP2945, which lies just to the west of GMP2923, apparent to be the parent of the clouds, but GMP2945 had a markedly different redshift (z=0.0207) from the clouds (z 0.028). We identified GMP2923(z=0.0291) as the parent and GMP2945 as a chance overlap. Twelve of fourteen parent galaxies had SDSS spectral information, and the other two had a Hectospec redshift (Marzke, R.O, et al. 2010, in preparation). There were six galaxies that had both SDSS and Hectospec redshifts. They were consistent within 30 km .
Table 3 shows the extension of the H clouds relative to the parent galaxy and the surface brightness of the clouds measured in the H image. The H total flux was calculated by assuming that the cloud had the same redshift as the parent galaxy, and its mix of [NII]6548,6583 was similar to that of the GMP2910 clouds (Yagi et al., 2007). We adopted a value of [NII]6583/H=0.5. Other emission lines, such as [OI]6300 and [SII]6716,6731, were out of the passband in the redshift of z and were therefore negligible. As the wavelength dispersion of the emission lines of the GMP2910 cloud in the FOCAS data was 3.8Å (Yagi et al., 2007), we adopted a value for the model to compute the H flux. As it includes broadening by an instrumental profile, the value would be overestimated for H imaging data. However the effect of the dispersion was found to be negligible. The dispersion of 3.8Å corresponded to velocity dispersion of km sec-1, but even if we assume a dispersion as 10 km sec-1, the change in H magnitude is less than 0.01 mag. We defined the H magnitude (mag(H)) as the continuum subtracted NB magnitude.
where and are the transmission of the filters, is the flux density, and is the correction factor so that
for objects with median color without H emission, . We calculated the mag(H) from the flux in the image with a zero-point NB-band magnitude. It should be noted that the H magnitude is not an color but the AB magnitude measured in the H image. That is, the color corresponds to EW(H), while H magnitude corresponds to L(H).
The measurement of flux was performed in the fixed isophote of a smoothed image. The H image was smoothed with a Gaussian kernel of =2.5 pixel, so that the noise of each pixel was suppressed. The isophotal threshold for the analysis was set to 2.5 erg s-1 cm-2 arcsec-2 at the redshift of the parent galaxy. As the transmission of the NB filter has a bell-shaped curve, the transmission at H changes according to the redshift. This effect was corrected when the threshold was calculated. The detected objects were examined with three-color images. Possible overlapping objects, such as foreground stars, distant galaxies, or a redder galaxy core were removed manually. Even after this screening, some of the clouds had errors due to the stellar color of the parent galaxy. In addition, some included light from HII regions in the parent galaxy. The examined detection map was used as a mask, and the total flux and peak surface brightness were measured in the masked H image. The same mask was applied to the R-band and the mean surface brightness in the R-band (SBR), which is an indicator of the extent of contamination of the H emission by continuum light, was measured. The measured values are summarized in Table 3.
3.3 Note on GMP4017 clouds
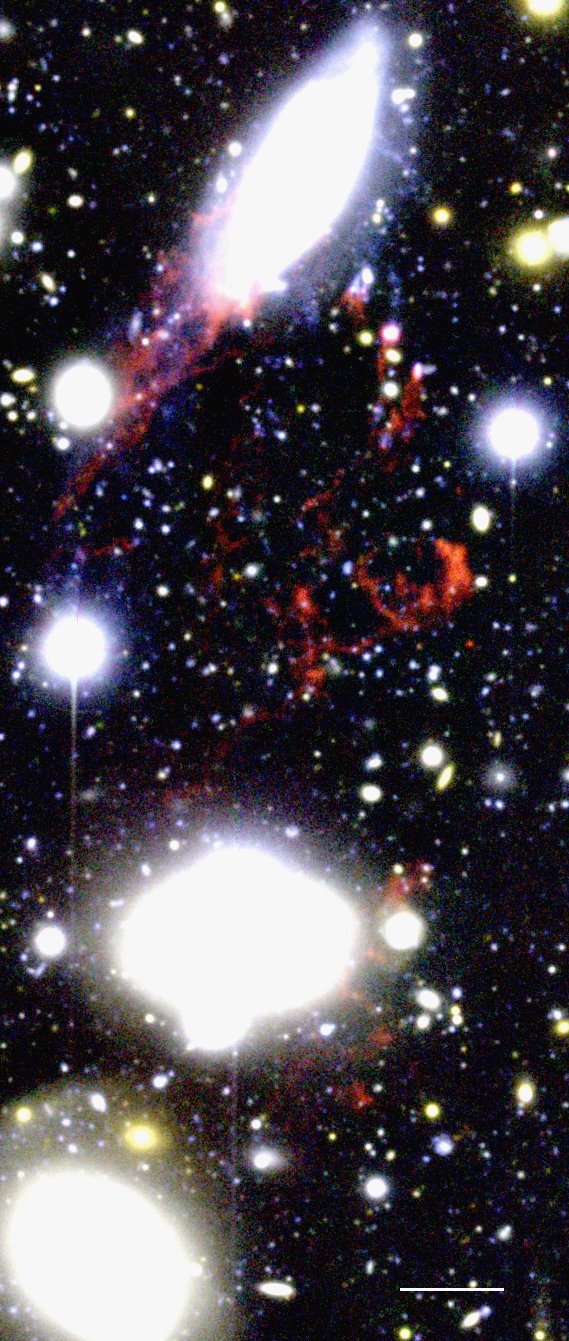
The H clouds of GMP4017 lie along the line of the clouds of GMP4060, and are slightly elongated in the north-south direction (Figure 5). This implies that they may not be associated with GMP4017, but with GMP4060. If the GMP4017 clouds were in fact an extension of the GMP4060 clouds, the length of the GMP4060 cloud would be 144 kpc. As the redshift of GMP4017(0.0280) is similar to that of GMP4060(0.0292), it is difficult to identify the physical association from spectroscopy.
HI observations may uncover the origin of the clouds of GMP4017. However, no HI emission has been detected around GMP4017 by previous deep HI surveys (Bravo-Alfaro et al., 2000, 2001), with rms per channel of 0.20-0.40 mJy beam-1. Although the survey covered the entire field of this study, there were only three parents in which HI gas was detected (GMP2374, GMP2559, and GMP3779). Much deeper HI observations may be required to determine whether GMP4017 or GMP4060 is the true parent of the H clouds near GMP4017.
4 Results
4.1 Distribution of the parents in the cluster
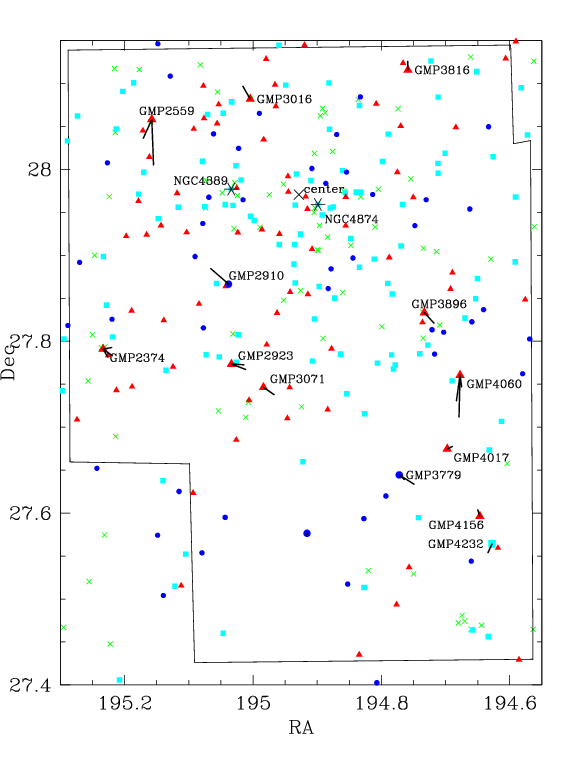
Figure 6 shows the positions of the parents, the length and the position angle of the clouds projected onto the sky. The redshift relative to the Coma cluster is also indicated as the color of the symbols. No clouds extend toward the center, although they do not always extend in the anti-center direction either. In addition, there is no apparent sub-clustering of the parents.
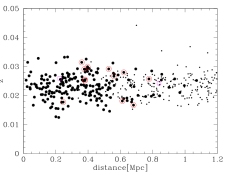
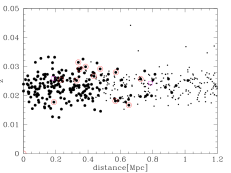
Figure 7 shows the redshift of galaxies as a function of the distance from the cluster center. The position of ()=(12:59:42.8,+27:58:14) was adopted as the center of the cluster (White et al., 1993). This coordinate was used in our previous studies (Komiyama et al., 2002; Carter et al., 2002). Figure 7 shows that most of these parent galaxies appear to reside in the blue and red edges of the redshift distribution, suggesting that the parents have large velocities relative to the Coma cluster. We used the Kolmogorov-Smirnov(KS) test to check whether the distribution of the peculiar velocity with respect to the cluster mean velocity was the same between the parents and the other member galaxies. The sample was restricted in the magnitude range and in our observed field to ensure unbiased samples. From the test, the p-value for the null hypothesis that the two distributions are the same was calculated as 0.038. Therefore the distribution of the parents’ redshift if significantly different from that of other member galaxies with over 95% confidence.
The parents are also located in the region farther than 0.2 Mpc from the cluster center avoiding the cluster core. The difference in the distribution of distance was also examined by the KS test. The distribution of parent galaxies was different from that of other member galaxies (p-value=0.045).
Figure 7 shows that only three parents lie on the blueshifted side while the rest lie on the redshifted side. The eleven redshifted parents could be part of a group falling into the cluster (Poggianti et al., 2004). However, we could not reject the possibility that the parents are falling into the cluster randomly from both sides, because the probability that either the redshifted or blueshifted group has less than 4 of 14 members is 5.7%, given the assumption of random infall.
4.2 Color of parents
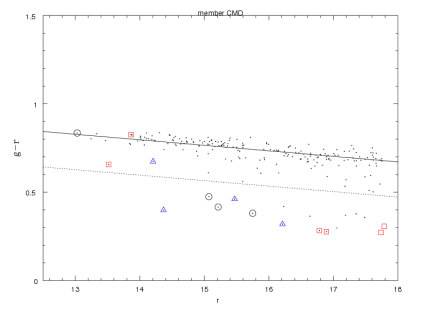
As the parent galaxies are bright, the centers of some of the galaxies were saturated in our Subaru images. As the photometric data for these galaxies were not reliable, we took the photometric data from SDSS DR7. Figure 8 shows the color magnitude diagrams of the galaxies in our observed field. The filled circles represent the SDSS galaxies with 0.015z0.035 and r-band magnitude 18.0.
It is striking that more than half of the blue galaxies are parents of some H clouds. The color magnitude relation (CMR) of passive member galaxies in the Coma cluster was fitted as
If we define “blue galaxies” as those bluer by 0.2 mag than the CMR the fraction of parents in the blue galaxies is 57% (8/14) in the 17.8 mag (M) SDSS confirmed members.
In the SDSS DR7 photometric catalog, there are nine objects in our observed field which are classified as galaxies, have a “blue” color, are brighter than 17.8 mag, and have no SDSS redshift. We checked the images of those objects and found that they consisted of three bright stars, one ghost of a bright object, two parts of other galaxies, and three galaxies. Two of the three galaxies, GMP3016 and GMP4232, are members, which is confirmed by Hectospec spectroscopy, and had H tails as shown in Fig 4. The remaining one was part of the GMP2863 complex. GMP2863 consists of at least three components, which we call GMP2863a, GMP2863b, and GMP2863c; of these, GMP2863b has a blue color in SDSS. If GMP2863b is a member, the fraction of parents in the blue galaxies is 59%(10/17); if it is not, the fraction is 63%(10/16).
It should be noted that we used an apparent color in this analysis. As we did not correct for internal dust extinction of the parent galaxy in this study, their intrinsic color may be bluer.
4.3 Morphology of the cloud-parent connection
The distributions of H clouds around the parent (Fig 4A-4N) were varied. We classified them into three types based on their appearance: 1) connected H clouds with disk star formations; 2) connected H clouds without disk star formation; and 3) detached H clouds. The results are listed in Table 3.
#1 connected H clouds with disk star formation: GMP2374, GMP3271, and GMP3816 show galaxy-wide star formation and some regions of H emission have flown out of the galaxies entirely. GMP3271 and GMP3816 are blue, while GMP2374 is as red as early-type galaxies and lies on the tip of the color-magnitude relation. Nevertheless, GMP2374 exhibits a very clear spiral pattern with ongoing star formation at the arms. We suppose that GMP2374 could be a progenitor of a passive spiral galaxy (e.g., Goto et al., 2003). GMP2559 has negative H on the northern side, but strong H emission on the southern side. We also classified it as belonging to this type.
#2 connected H clouds without disk star formation: GMP2910, GMP3071, and GMP3779 exhibit core star formation and extended H emission connected to the core. The extended clouds have a blobby structure. GMP3896 has a similar appearance to type #1, but with more extended emission in the disk. Their color and magnitude are similar to those of type #1.
#3 detached H clouds: GMP2923, GMP3016, GMP4060, and GMP4232 have no apparent H emission in the parent galaxy, only outside the galaxy. The color of the parent is very blue (), and the magnitude is very faint (16.8). The four galaxies are in fact the four least luminous galaxies among the parents. GMP3016 and GMP4060 show fireball features: H emission following knots of young blue stars (Yoshida et al., 2008).
The clouds of GMP4017 and GMP4156 are also detached. However, the emission is superimposed on the stellar component of the parent galaxy, and the parents are red. The clouds near the two giant galaxies could be different from those near the other four dwarfs. We classified GMP2923, GMP3016, GMP4060, and GMP4232 as #3 blue dwarfs, and GMP4017 and GMP4156 as #3 red giants. The central excess of GMP4156 was partly due to the saturation of our R-band image and red color of stellar components, although H emission existed in the SDSS spectrum of 3 arcsec aperture. The SDSS spectrum showed a high [NII]/H ratio of 0.85, which may indicate a weak active galactic nucleus (AGN).
We noticed that all the #3 blue dwarfs showed post-starburst signatures in their SDSS/Hectrospec spectra. As the fiber sizes were 3 arcsec (1.4 kpc) and 1.5 arcsec (0.7 kpc) for SDSS and Hectospec, respectively their central regions are in a post-starburst phase. Moreover, none of the #3 blue dwarfs were detected in deep radio 1.4GHz observations with the Very Large Array (VLA; Miller et al., 2009). This suggests that they now have little or no star formation even in their outer regions. Meanwhile, 7 of 8 #1 and #2 parents were detected in radio; these are star forming galaxies and not radio-loud AGNs.
5 Discussion
5.1 Possible evolution sequence of the parent galaxies
The findings presented in Sections 4.1 and 4.2 suggest that the parent galaxies were recently captured by the Coma cluster potential and are now infalling toward the cluster center, while their disk gas is stripped off and seen as H clouds.
The classification based on apparent morphology may imply an evolutionary sequence of gas stripping: a star-forming disk galaxy (#1) evolves into star-forming + dead disk phase (#2) and then the gas clouds are detached (#3). Recent numerical simulations of ram-pressure stripping (Kronberger et al., 2008; Kapferer et al., 2009; Tonnesen & Bryan, 2010) also showed the evolution of H appearance in 500 Myr. However, it is puzzling that #3 phase galaxies consist of less luminous blue galaxies and bright red giants. Moreover, GMP2374, the brightest #1 galaxy, shows a red color. Although part of the red color is due to possible extinction by internal dust, the spectrum of the whole galaxy in the GOLDMINE database (Gavazzi et al., 2003) indicates that it is dominated by intermediate and old stellar populations as inferred from its large D4000 and small CaHK ratio. Therefore it is difficult to assume that this galaxy will evolve into a post-starburst phase with a blue color. The parents may consist of several kinds of galaxies on different evolutionary paths.
As a second parameter of various evolutionary paths, we estimated the masses of the parents. Higher mass galaxies should have larger potential wells and retain some gas for star formation, while lower mass galaxies might simply evolve from type #1 to #3 without passing through #2.
The masses of the parents were estimated by three different methods and are given in Table 4. Bell et al. (2003) gives stellar mass-to-light ratios (M/L) as a function of color. They adopted a ”diet” Salpeter initial mass function (IMF), which has 30% lower mass than Salpeter IMF (Salpeter, 1955). We adopted
and calculated the stellar mass from the SDSS and magnitudes. We neglected K-correction for both the magnitude and colors, which were smaller than 0.1 mag. The possible effects of internal dust were also neglected. We also estimated the masses of the parents from the model SED fitting, using kcorrect v4.1.4 (Blanton&Roweis, 2007) with SDSS and public GALEX magnitudes and redshifts as in Miller et al. (2009). The recommended corrections on the kcorrect web page 111http://howdy.physics.nyu.edu/index.php/Kcorrect were applied, which included the correction between the AB and SDSS magnitudes, and the minimum uncertainty of the SDSS magnitude. The kcorrect used Chabrier (2003) IMF and Padova 1994 isochrones (Bruzual & Charlot, 2003, and references therein). Yet another mass estimation was available in the MPA-JHU SDSS catalog 222http://www.mpa-garching.mpg.de/SDSS/DR7/. The DR7_v5.2 version included 11 parents of this study. We adopted the “MEDIAN” column as the estimated mass. The IMF by Kroupa (2001) was adopted for the catalog(Kauffmann et al., 2003).
Although there were variations among the mass estimations of the three different methods, we can see that the type #3 dwarfs had less than M☉. On the other hand, the classification between #1 and #2 showed no clear correlation with mass. In addition, the lowest mass #3 parents ( M☉) stopped star formation quickly, while most of the #1 and #2 parents, the masses of which were M☉, continued star formation. The correlation of the detachment of the clouds, the activity of star formation, and the mass implied that the quick quench of the star formation in the #3 blue dwarfs was due to shallow potentials and/or small amounts of gas. This result regarding the dependency of the star formation quench on the mass was similar to those in previous studies (Kauffmann et al., 2004; Haines et al., 2007; Wolf et al., 2009; Mahajan, Haines, Raychaudhury, 2010), although this is the first time that galaxies of low mass ( M☉) have been investigated in this way.
5.2 Comparison with galaxies with UV asymmetries
Recently Smith et al. (2010) investigated UV and H images of the Coma cluster, and listed the galaxies with gaseous stripping events (GSE), which were detected as UV asymmetries and had colors with . Their observed field overlapped with our field, and there were six galaxies in common (GMP2559, GMP2910, GMP3016, GMP3816, GMP4060, and GMP4232). It is striking that the UV asymmetric galaxies in our fields are only the six. This suggests that GSE galaxies have extended H clouds with high probability.
The other eight parents were not listed as GSE galaxies, although all of the parents in this study satisfied the selection criteria of Smith et al. (2010) (, and z). As the NUV-optical color is a function of the star formation strength and the age since the last star formation (e.g. Kaviraj et al., 2007), one possibility is that the non-GSE parents are older. This can explain the red #3 galaxies, as age quickly makes the color redder. The other five star-forming galaxies and a post-starburst galaxy have young stars, and the age cannot explain the non-detection of UV asymmetry. It is possible that the UV asymmetric feature is faint because the star formation is/was weaker than other cases. It is also possible that the UV emitting stars have a symmetric distribution, while the H is asymmetric. The last case suggests that the distributions of the young stars and gas differ. The sign of the different distribution was shown in our previous studies (Yagi et al., 2007; Yoshida et al., 2008). This also suggests that the source of ionization is not always the UV photons from young stars. A detailed discussion of the source of ionization will be presented in our next paper (Yoshida et al. in preparation).
If we assume that all galaxies from which gas was removed experienced an H parent phase, we can speculate on the evolution of the parents. With regard to infalling galaxies, Graham, Jerjen & Guzmán (2003) investigated two disk dwarf galaxies in the Coma cluster, which still show spiral arm patterns. The galaxies, GMP3292 and GMP3629, are thought to be transforming from spiral to passive galaxies. Graham, Jerjen & Guzmán (2003) also noted that these galaxies have large peculiar velocities relative to the Coma center. However, these two galaxies are, much redder than parents in this study ( for GMP3292 and for GMP3629), but are of comparable mass (4.1 and 8 Msun), with values estimated in the same way as for the parents. They might be recently evolved shapes from the parents, as they still retain the arm pattern.
6 Summary
From the Suprime-Cam observation of the center of the Coma cluster, we found ionized H clouds near 14 galaxies (parents). All the parents were confirmed to be Coma member galaxies by SDSS and Hectospec spectroscopy. The parent galaxies were distributed in the region farther than 0.2 Mpc from the cluster center, and tended to reside on the blue and red edges of the redshift distribution, avoiding the mean cluster redshift. The majority of the parent galaxies were blue, and 57% of the blue galaxies brighter than contained H clouds.
We classified the connection between the parent and the clouds into three types: connected clouds with disk star formation, connected clouds without disk star formation, and detached clouds. The parents of detached clouds consisted of two groups; blue dwarfs and red giants. The blue dwarfs were the four least luminous galaxies among the 14 parents, and showed no sign of current star formation but appeared to be post-starburst. The parents with connected clouds showed no significant differences regardless of whether they had disk star formation or not.
A comparison with galaxies with UV asymmetries showed that all such galaxies are accompanied with H clouds. This suggests that a galaxy undergoing a gaseous stripping event has extended H emitting clouds with high probability.
References
- Abazajian et al. (2009) Abazajian, K. N. et al. 2009, ApJ, 182, 543
- Bell et al. (2003) Bell, E.F., McIntosh, D.H., Kats, N., Weinberg, M.D. 2003, ApJS, 149, 289
- Bertin & Arnouts (1996) Bertin, E., Arnouts, S. 1996, A&AS, 317, 393
- Blanton&Roweis (2007) Blanton, M.R., Roweis, S. 2007, AJ, 133, 734
- Boselli & Gavazzi (2006) Boselli, A., Gavazzi, G., 2006, PASP, 118, 517
- Bravo-Alfaro et al. (2000) Bravo-Alfaro, H., Cayatte, V., van Gorkom, J.H., Balkowski, C. 2000, AJ, 119, 580
- Bravo-Alfaro et al. (2001) Bravo-Alfaro, H., Cayatte, V., van Gorkom, J. H., Balkowski, C. 2001, A&A, 379, 347
- Bravo-Alfaro et al. (2009) Bravo-Alfaro, H., Caretta, C.A., Lobo, C., Durret, F., Scott, T. 2009, A&A, 495, 379
- Bruzual & Charlot (2003) Bruzual, G., Charlot, S. 2003, MNRAS, 344, 1000
- Byrd & Valtonen (1990) Byrd, G., Valtonen, M. 1990, ApJ, 350, 89
- Carter et al. (2002) Carter, D. et al. 2002, ApJ, 567, 772
- Chabrier (2003) Chabrier, G. 2003, PASP, 115, 763
- Cortese et al. (2007) Cortese, L., et al. 2007, MNRAS, 376, 157
- Cowie & Songaila (1977) Cowie, L.L., Songaila, A. Nature, 266, 501
- Gavazzi (1987) Gavazzi, G. ApJ, 320, 96
- Gavazzi et al. (2001) Gavazzi, G., Boselli, A., Mayer, L., Iglesias-Paramo, J., Vílchez, J.M., Carrasco, L. 2001, ApJ, 563, L23
- Gavazzi et al. (2003) Gavazzi, G., Boselli, A., Donati, A, Franzetti, P., Scodeggio, M. 2003, A&A, 400, 451
- Giovanelli & Haynes (1985) Giovanelli, R., Haynes, M.P. 1985, ApJ, 292, 404
- Godwin et al. (1983) Godwin, J.G., Metcalfe, N., & Peach, J.V. 1983, MNRAS, 202, 113
- Goto et al. (2003) Goto, T. et al. 2003, PASJ, 55, 757
- Gunn & Gott (1972) Gunn, J.E., Gott, J.R.I. 1972, ApJ, 176, 1
- Graham, Jerjen & Guzmán (2003) Graham, A.W., Jerjen, H., Guzmán, R. 2003, AJ, 126, 1787
- Joye & Mandel (2003) Joye, W.A, Mandel, E. 2003, in ASP Conf. Ser. 295. ADASS XII, ed. H.E. Payne, R.I. Jedrzejewski, & R.N. Hook, 489
- Haines et al. (2007) Haines, C.P., Gargiulo, A., La Barbera, F., Mercurio, A., Merluzzi, P., Busarello, G. 2007, MNRAS, 381, 7
- Kamata et al. (2008) Kamata, Y. et al. 2008, in Proc. SPIE 7021 “High Energy, Optical, and Infrared Detectors for Astronomy III.” Ed. by Dorn, D.A., Holland, A.D., 70211S-1
- Kapferer et al. (2009) Kapferer, W., Sluka, C., Schindler, S., Ferrari, C., Ziegler, B. 2009, A&A, 499, 87
- Kashikawa et al. (2002) Kashikawa, N. et al. 2002, PASJ, 54, 819
- Kauffmann et al. (2003) Kauffmann, G. et al. 2003, MNRAS, 341, 33
- Kauffmann et al. (2004) Kauffmann, G. et al. 2004, MNRAS, 353, 713
- Kaviraj et al. (2007) Kaviraj, S., Kirkby, L.A., Silk, J., Sarzi, M., 2007, MNRAS, 382, 960
- Kavelaars et al. (2000) Kavelaars, J. J., Harris, W. E., Hanes, D. A., Hesser, J. E., Pritchet, C. J. 2000, ApJ, 533, 125
- Kenney et al. (2008) Kenney, J.D.P., Tal, T., Crowl, H.H., Feldmeier, J., Jacoby, G.H. 2008, ApJ, 687, L69
- Komiyama et al. (2002) Komiyama, Y. et al. 2002, ApJS, 138, 265
- Kronberger et al. (2008) Kronberger, T., Kapferer, W., Ferrari, C., Unterguggenberger, S., Schindler, S. 2008, A&A, 481, 337
- Kroupa (2001) Kroupa, P. 2001, MNRAS, 322, 321
- Larson et al. (2010) Larson, D. et al. 2010, astro-ph/1001.4635
- Mahajan, Haines, Raychaudhury (2010) Mahajan, M., Haines, C.P., Raychaudhury, S. 2010, MNRAS, to appear
- Miller et al. (2009) Miller, N.A., Hornschemeier, A.E., Mobasher, B., Bridges, T.J., Hudson, M.J., Marzke, R.O., Smith, R.J. 2009, AJ, 137, 4450
- Mink (2002) Mink, D.J. 2002, in ASP Conf. Proc. 281. ADASS XI, ed. D.A. Bohlender, D. Durand, & T.H. Handley (San Francisco: ASP), 169
- Miyazaki et al. (2002) Miyazaki, S., et al. 2002, PASJ, 54, 833
- Monet et al. (2003) Monet, D.G. et al. 2003, AJ, 125, 984
- Moore et al. (1996) Moore, B., Katz, N., Lake, G., Dressler, A., Oemler, A. 1996, Nature, 379, 613
- Nulsen (1982) Nulsen P.E.J. 1982, MNRAS, 198, 1007
- Okabe, Okura & Futamase (2010) Okabe, N., Okura, Y., Futamase, T. 2010, ApJ, 713, 201
- Oosterloo & van Gorkom (2005) Oosterloo, T., van Gorkom, J. 2005, A&A, 437, L19
- Poggianti et al. (2004) Poggianti, B.M., Bridges, T.J., Komiyama, Y., Yagi, M., Carter, D., Mobasher, B., Okamura, S., Kashikawa, N. 2004, ApJ, 601, 197
- Salpeter (1955) Salpeter E. E., 1955, ApJ, 121, 161
- Schlegel et al. (1998) Schlegel, D. J., Finkbeiner, D. P. & Davis, M., 1998, ApJ, 500, 525
- Smith et al. (2010) Smith, R.J. et al., 2010, MNRASin press (arXiv:1006.4867v2)
- Solanes et al. (2001) Solanes, J.M., Manrique, A., García-Gómez, C., González-Casado, G., Giovanelli, R., Haynes, M.P. 2001, ApJ, 548, 97
- Strauss et al. (2002) Strauss, M.A. et al., 2002, AJ, 124, 1810
- Sun, Donahue & Voit (2007) Sun, M., Donahue, M., Voit, M. 2007, ApJ, 671, 170
- Sun et al. (2010) Sun, M., Donahue, M., Roediger, E., Nulsen, P.E.J., Voit, G.M., Sarazin, C., Forman, W., Jones, C. 2010, ApJ, 708, 964
- Tonnesen & Bryan (2010) Tonnesen, S, Bryan, G.L. 2010, ApJ, 709, 1203
- Toomre & Toomre (1972) Toomre, A., Toomre, J. 1972, ApJ, 178, 623
- White et al. (1993) White, S.D.M., Briel, U.G., & Henry, J.P. 1993, MNRAS, 261, L8
- Wolf et al. (2009) Wolf, C. et al. 2009, MNRAS, 393, 1302
- van der Wel et al. (2010) van der Wel, A., Bell, E.F., Holden, B.P., Skibba, R.A., Rix, H.-W. 2010, ApJ, 714, 1779
- Yagi et al. (2002) Yagi, M., Kashikawa, N., Sekiguchi, M., Doi, M., Yasuda, N., Shimasaku, K., and Okamura, S., 2002, AJ, 123, 66
- Yagi et al. (2007) Yagi, M., Komiyama, Y., Yoshida, M., Furusawa, H., Kashikawa, N., Koyama, Y., Okamura, S. 2007, ApJ, 660, 1209
- Yagi (2010) Yagi, M. 2010, to appear in ADASS 2009
- Yoshida et al. (2002) Yoshida, M., et al. 2002, ApJ, 567, 118
- Yoshida et al. (2008) Yoshida, M. et al. 2008, ApJ, 688, 918
| filter | PSF size | SBlim(ABmag arcsec-2) | Date(UT) | exposure |
| B | 1”.06 | 28.6 | 2006-04-28 | 2450sec |
| 2006-05-03 | 3450sec | |||
| 2007-05-13 | 4600sec | |||
| 2009-05-26 | 6600sec | |||
| R | 0”.75 | 28.1 | 2006-04-28 | 11300 sec |
| 2006-05-03 | 160 sec | |||
| 2007-05-11 | 160 sec | |||
| 2007-05-13 | 12300 sec | |||
| 2007-05-14 | 5360 sec | |||
| 2007-05-15 | 1300 sec | |||
| 2009-05-26 | 4300 sec | |||
| 2009-05-27 | 4300 sec | |||
| i | 1”.10 | 27.5 | 2006-04-28 | 4240 sec |
| 2006-05-03 | 1240 sec + 2120 sec | |||
| 2009-05-25 | 6300 sec | |||
| NB | 0”.76 | 27.5 | 2006-04-28 | 81800 sec |
| 2006-05-03 | 3120 sec | |||
| 2007-05-12 | 91800 sec | |||
| 2007-05-15 | 1300 sec | |||
| 2009-05-26 | 4900 sec |
| Name | RA | DEC | (AB) | (AB) | z | other name |
| (1) | (2) | (3) | (4) | (5) | (6) | (7) |
| GMP2374 | 195.233579 | 27.790860 | 13.0 | 0.83 | 0.0267 | D82,NGC4911 |
| GMP2559 | 195.157759 | 28.058088 | 15.1 | 0.47 | 0.0255 | D169,IC4040 |
| GMP2910 | 195.038083 | 27.866444 | 15.5 | 0.46 | 0.0177 | D100,Mrk60 |
| GMP2923 | 195.033500 | 27.773172 | 16.9 | 0.28 | 0.0291 | - |
| GMP3016 | 195.004583 | 28.082028 | 17.8 | 0.30 | 0.0259bbHectospec redshift | - |
| GMP3071 | 194.984000 | 27.746472 | 16.2 | 0.32 | 0.0299 | D66 |
| GMP3271 | 194.915873 | 27.576482 | 15.8 | 0.38 | 0.0167 | D41 |
| GMP3779 | 194.771958 | 27.644361 | 14.4 | 0.40 | 0.0181 | D54,Mrk58,RB219 |
| GMP3816 | 194.758750 | 28.115556 | 15.2 | 0.42 | 0.0314 | D195,NGC4858 |
| GMP3896 | 194.733181 | 27.833384 | 14.2 | 0.67 | 0.0252 | D89,IC3949 |
| GMP4017 | 194.697506 | 27.674734 | 13.9 | 0.83 | 0.0280 | D58,NGC4854 |
| GMP4060 | 194.677458 | 27.760514 | 16.8 | 0.28 | 0.0292 | RB199 |
| GMP4156 | 194.646614 | 27.596389 | 13.5 | 0.66 | 0.0257 | D43,NGC4853 |
| GMP4232 | 194.627917 | 27.564306 | 17.7 | 0.27 | 0.0243bbHectospec redshift | - |
.
| Name | area | extension | position angle | SB(R) | peak SB(H) | total mag(H) | H flux | type |
|---|---|---|---|---|---|---|---|---|
| (1) | (2) | (3) | (4) | (5) | (6) | (7) | (8) | (9) |
| GMP2374 | 2350 | 28 | 249 | 21.3 | 18.6 | 15.0 | 2.3 | 1 |
| GMP2559 | 1962 | 90 | 183 | 22.9 | 19.7 | 15.7 | 1.1 | 1 |
| GMP2910 | 498 | 60 | 60 | 23.0 | 19.2 | 17.7 | 1.9 | 2 |
| GMP2923 | 130 | 54 | 254 | 25.9 | 25.8 | 21.6 | 6.6 | 3 |
| GMP3016 | 21 | 34 | 40 | 26.5 | 25.7 | 22.9 | 1.4 | 3 |
| GMP3071 | 168 | 35 | 247 | 23.5 | 22.9 | 20.8 | 1.5 | 2 |
| GMP3271 | 124 | 4.7 | 157 | 21.2 | 20.8 | 18.1 | 1.4 | 1 |
| GMP3779 | 436 | 47 | 245 | 21.7 | 19.1 | 16.9 | 3.7 | 2 |
| GMP3816 | 584 | 21 | 333 | 22.4 | 19.5 | 16.4 | 1.0 | 1 |
| GMP3896 | 585 | 34 | 234 | 21.2 | 20.0 | 16.8 | 3.9 | 2 |
| GMP4017 | 38 | 20 | 288 | 25.3 | 25.6 | 22.5 | 2.4 | 3(red) |
| GMP4060 | 116 | 81 | 165 | 26.2 | 23.4 | 20.9 | 1.2 | 3 |
| GMP4156 | 118 | 15 | 26 | 22.4 | 25.8 | 21.3 | 6.5 | 3(red) |
| GMP4232 | 92 | 22 | 151 | 25.0 | 22.8 | 20.7 | 1.0 | 3 |
| Name | log(M/L)i | MBell | Mkcorrect | MMPA | type | ||
| (1) | (2) | (3) | (4) | (5) | (6) | (7) | (8) |
| GMP2374 | 0.43 | 12.6 | 0.34 | 1300 | 630bbGALEX pipeline divided the galaxy into multiple components. Their flux values were combined for the total UV magnitude. | 1500 | 1 |
| GMP2559 | 0.32 | 14.8 | 0.21 | 130 | 43 | 100 | 1 |
| GMP2910 | 0.23 | 15.2 | 0.11 | 73 | 12 | 21 | 2 |
| GMP2923 | 0.16 | 16.7 | 0.04 | 16 | 4 | 8 | 3 |
| GMP3016 | 0.18 | 17.6 | 0.06 | 7 | 1 | – | 3 |
| GMP3071 | 0.18 | 16.0 | 0.05 | 31 | 11 | 19 | 2 |
| GMP3271 | 0.17 | 15.6 | 0.05 | 44 | 7 | 9 | 1 |
| GMP3779 | 0.21 | 14.2 | 0.09 | 180 | 33 | 47 | 2 |
| GMP3816 | 0.27 | 14.9 | 0.16 | 110 | 56 | 100 | 1 |
| GMP3896 | 0.39 | 13.8 | 0.29 | 400 | 93ccNo FUV detection. We used FUV=25 with a large (9.99) error. | 350 | 2 |
| GMP4017 | 0.42 | 13.4 | 0.32 | 630 | 300 | 730 | 3(red) |
| GMP4060 | 0.17 | 16.6 | 0.04 | 17 | 4 | – | 3 |
| GMP4156 | 0.39 | 13.1 | 0.29 | 770 | 240 | 660 | 3(red) |
| GMP4232 | 0.13 | 17.6 | 0.01 | 6 | 1 | – | 3 |


Appendix A Suprime-Cam flux calibration using SDSS
We took a special care for the flux calibration. The B-band of Suprime-Cam has different transmission from the standard Johnson-B, because of the low throughput of CCDs at shorter wavelengths. In addition, the R-band of Suprime-Cam has different transmission from Kron-Cousins-R as it has a much shallower range 777 http://www.naoj.org/Observing/Instruments/SCam/sensitivity.html.
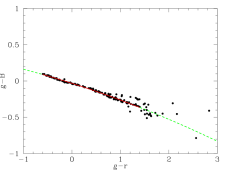
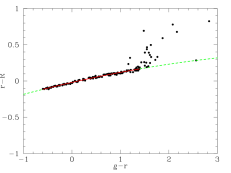
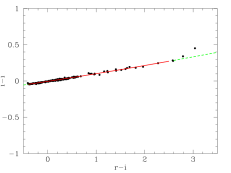
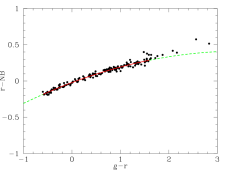
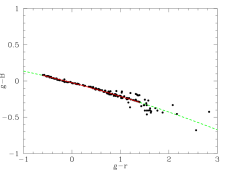
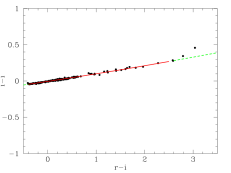
We adopted to use the SDSS DR7 catalogs(Abazajian et al., 2009), which cover the whole of our observation area. As many stars in the observed field had photometric data in SDSS DR7, we calibrated the zero-point of our data to archieve the best-match. We retrieved type=6(stellar objects) of objects for the calibration. The colors of typical stars were calculated using the Bruzual-Persson-Gunn-Stryker Atlas 888ftp://ftp.stsci.edu/cdbs/grid/bpgs/. Using the filter transmission of SDSS DR7 and that of the Suprime-Cam filters, we plotted (Suprime) vs. , (Suprime) vs. , and (Suprime) vs. . Then, we fitted the loci of stars with a second order polynomial as
The coefficients are shown in Table A1, and the fit is also shown as Figures A1 and A2.
Replacement of the Suprime-Cam CCDs in July 2008 (Kamata et al., 2008) affected the color terms. The systematic differences between the old and new CCDs are negligible ( mag) for R and i band, but mag for B-band (Table A2). This was because of the change in quantum efficiency at Å. Therefore we made two B-band images; one from old CCD data and the other from new CCD data. As the latter covers a part of the field, the three color images in this paper were created with the old CCD B-band data.
The cross-identification of stars in each FITS dataset was performed using celestial coordinates. We used wcstools(Mink, 2002) and the USNO-B1.0 catalog (Monet et al., 2003) to calibrate the world coordinate system (WCS). The flux measurement was performed with SExtractor (Bertin & Arnouts, 1996). Removing saturated or blended objects, we estimated the shift between the observed data and the model locus using the mode of the difference.
The AB magnitude of the NB-band was also calibrated with SDSS in the same manner. We assumed that most of the stars did not have strong features around 6710Å 100Å, and hence that the (Suprime) vs. plot would work. We also used spectroscopic data of stars in our observed field to calculate (Suprime) color. The values were consistent with the model locus of BPGS stars.
This method is applicable to any Suprime-Cam data where SDSS has a photometric catalog. However, this method has the drawback that Galactic extinction may add systematic error, because the model locus is free from the extinction. In the Coma region, however, the Galactic extinction for extragalactic objects is , from the model of Schlegel et al. (1998) in NED. The extinction for Galactic stars must be much less than this value, and therefore we neglected the effect in this study.
| SDSS-Suprime | SDSS color | range | |||
|---|---|---|---|---|---|
| (new) | -0.61.4 | -0.0232335 | -0.174584 | -0.0138875 | |
| (old) | -0.61.4 | -0.0317803 | -0.212379 | -0.0178932 | |
| (new) | -0.61.4 | -0.0188297 | 0.149276 | -0.0128141 | |
| (old) | -0.61.4 | -0.0191869 | 0.151382 | -0.012914 | |
| (new) | -0.42.5 | -0.00488511 | 0.101026 | 0.00341974 | |
| (old) | -0.42.5 | -0.00472411 | 0.102785 | 0.00326376 | |
| (new) | -0.61.6 | -0.0214062 | 0.250467 | -0.0361111 | |
| (old) | -0.61.6 | -0.021407 | 0.250514 | -0.0361369 |
| SDSS-Suprime | difference |
|---|---|
| 0.12 | |
| 0.01 | |
| 0.02 | |
| 0.00 |