Improving the identification of high-z Herschel sources with position priors and optical/NIR and FIR/mm photometric redshifts††thanks: Herschel is an ESA space observatory with science instruments provided by European-led Principal Investigator consortia and with important participation from NASA.
We present preliminary results about the detection of high redshift (U)LIRGs in the Bullet cluster field by the PACS and SPIRE instruments within the Herschel Lensing Survey (HLS) Program. We describe in detail a photometric procedure designed to recover robust fluxes and deblend faint Herschel sources near the confusion noise. The method is based on the use of the positions of Spitzer/MIPS 24 m sources as priors. Our catalogs are able to reliably (5) recover galaxies with fluxes above 6 and 10 mJy in the PACS 100 and 160 m channels, respectively, and 12 to 18 mJy in the SPIRE bands. We also obtain spectral energy distributions covering the optical through the far-infrared/millimeter spectral ranges of all the Herschel detected sources, and analyze them to obtain independent estimations of the photometric redshift based on either stellar population or dust emission models. We exemplify the potential of the combined use of Spitzer position priors plus independent optical and IR photometric redshifts to robustly assign optical/NIR counterparts to the sources detected by Herschel and other (sub-)mm instruments.
Key Words.:
Infrared: galaxies - Submillimeter: galaxies - Galaxies: evolution - Galaxies: high-redshift - Galaxies: photometry - Gravitational lensing: strong1 Introduction
Based on the IRAS, ISO, and Spitzer missions, we know that luminous infrared galaxies (LIRGs) experienced significant evolution in the past 8 Gyr, roughly decreasing their typical infrared luminosity [L(IR)] by an order of magnitude from z1 to z0 (Flores et al., 1999; Chary & Elbaz, 2001; Pérez-González et al., 2005; Le Floc’h et al., 2005; Rodighiero et al., 2010; Magnelli et al., 2009). By z1, they dominated the star formation activity of the Universe, being responsible for more than 50% of the cosmic SFR density up to at least z3, and playing an important role in the formation of massive galaxies at z1.5, which exhibit high star formation efficiencies (Pérez-González et al., 2008; Reddy et al., 2008; Damen et al., 2009), strong dust obscured nuclear activity (Daddi et al., 2007; Donley et al., 2008), or both. Beyond z1, sub-mm surveys have also detected a population of LIRGs and (mostly) ULIRGs, identified as very active stages in the formation of massive galaxies (Smail et al., 1997; Hughes et al., 1998; Chapman et al., 2003, 2005; Pope et al., 2006).
Although very useful for measuring the obscuration of optical light by interstellar dust (very abundant in the most extreme starbursts), the analysis of IR data to understand the formation and evolution of galaxies in the Universe has been classically hampered mainly by two issues. First, the sensitivity of IR telescopes has increased significantly from one mission to the next (and also their angular resolution, although at a lower rate), but there are still problems correctly identifying all sources detected in IR surveys, most noticeably at longer wavelengths where confusion remains severe (e.g., at 70/160 m in the Spitzer/MIPS surveys and in the SCUBA or LABOCA sub-mm data). Moreover, finding counterparts and getting reliable redshifts from spectroscopy for high redshift (U)LIRGs is challenging since a good fraction of them are extremely faint at optical/NIR wavelengths (Ivison et al., 2002; Wilson et al., 2008; Frayer et al., 2004). A second problem for the study of 0z4 (U)LIRGs is the availability of only one photometric data point (MIPS 24 m) for most of them. The fits to dust emission models to calculate L(IR), and from this derive a SFR (Kennicutt 1998), need a considerable extrapolation, and thus the SFR is subject to significant systematic uncertainties (Papovich et al., 2006; Daddi et al., 2007; Barro et al., 2010). In addition, the limited FIR data already available for galaxies at z2 indicate that they have different dust properties from those observed for nearby (U)LIRGs (Chapman et al., 2005; Papovich et al., 2007; Rigby et al., 2008; Rieke et al., 2009).
The ESA Herschel Space Observatory (Pilbratt et al., 2010) alleviates these two issues. Thanks to its sensitivity and angular resolution at 100500 m, it enables us to robustly characterize high-z galaxies. In addition to the populations of IR galaxies newly discovered by Herschel, it will supply up to six photometric data points in the IR range for 0z4 galaxies detected by MIPS at 24 m. These data can be used to constrain the fits to the dust emission templates. Even more novel and relevant is the combination of Herschel observations with the MIPS data (and also IRAC) to diminish the effects of source confusion in IR surveys. The new Herschel data indeed allow an easier and more reliable identification of counterparts from one band to the adjacent one as we move to shorter wavelengths. In addition, the Herschel bands effectively fill the gap between MIPS and (sub-)mm surveys (with SCUBA2, LABOCA, or AzTEC). By combining all these datasets, we can now use the several IR photometric data points to estimate a photometric redshift based on dust emission alone, and compare it with the estimations based on UV-to-NIR data. This can be regarded as an extension of the radio-to-IR photo-z method (Carilli & Yun, 1999; Dunne et al., 2000; Rengarajan & Takeuchi, 2001; Blain et al., 2003; Aretxaga et al., 2003; Daddi et al., 2009), benefiting from a finer sampling of the emission from dust at different temperatures. The procedure can be used to improve the cross-correlation with optical/NIR galaxy samples, or even to obtain the only redshift measurement possible for very faint (high-z) IR-bright optically-faint sources. These sources may be numerous in the Herschel surveys, because of its impressive sensitivity at wavelengths probing the peak of the dust emission, which can be brighter than the optical emission by orders of magnitude.
In this Letter, we perform a preliminary analysis of the Herschel Lensing Survey (HLS, PI Egami) data taken for the Bullet cluster to show the utility of position priors and photometric redshifts obtained from UV-to-NIR and IR-to-mm data to improve the identification of Herschel and sub-mm sources with those detected at shorter wavelengths. A correct identification of IR sources will be extremely relevant to all Herschel cosmological surveys, but is of critical importance for clusters, because of their crowded nature and the possible presence of high-z lensed and distorted sources with very faint optical counterparts that may even only be detectable in the FIR/mm range.
2 Data and catalogs
The reduction of the Herschel SPIRE (Griffin et al., 2010) and PACS (Poglitsch et al., 2010) data of the Bullet cluster (06:58, 55:57) is described in Egami et al. (2010) and Rex et al. (2010), jointly with optical-to-mm ancillary data used to estimate photometric redshifts, stellar masses, and SFRs. Here we describe our cataloging procedure for the five Herschel bands: PACS 100 and 160 m, and SPIRE 250, 350, and 500 m.
Given the remarkable depth of the Spitzer MIPS 24 m images, PACS catalogs have been compiled with a position prior technique, involving a list of MIPS sources and a PSF fitting analysis (see Pérez-González et al., 2008). To improve the reliability of the method, we first aligned all Herschel images to the WCS of the MIPS 24 m map using the wcstools software (Mink, 1999), obtaining matching uncertainties smaller than one pixel for each Herschel band. The MIPS 24 m catalog in the Bullet cluster field has a 5 detection level of 8530 Jy111Calculated from several artificial apertures formed with random sky pixels; see Appendix A in Pérez-González et al. (2008)., and a density of 5.3 sources/arcmin2 above that threshold (7.2 sources/arcmin2 with 50 Jy).
The similar PSF sizes of the MIPS 24 m and the PACS 100 m bands (6″ and 8″, respectively) make the identification and extraction of sources straightforward for this band. In addition, we also considered that some sources may be too faint for MIPS yet still be detectable by PACS. To account for this population, we detected sources directly in the PACS data using Sextractor (Bertin & Arnouts, 1996), obtaining a sample of 43 sources above the 5 level (5.50.7 mJy). The cross-correlation of this sample with the MIPS catalog (using a search radius of 3″) revealed that all but one of the robust PACS detections are detected at 24 m, and 5 of them had 2 MIPS counterparts within the search radius. The only non-detection at 24 m is, in fact, a group of three very faint 100 m sources within 10″, which are detected as one single source by Sextractor in the PACS image, but are individual sources at 24 m. The 5 multiple detections were sources for which the slightly higher resolution and greater depth of MIPS allowed the deblending of close IR emitters. This cross-correlation also found that the WCS alignment between both images has an rms smaller than 1″.
For the 160 m image, it is expected that more 24 m sources are merged to form single sources. For this reason, before measuring photometry, we removed sources from the main catalog that could not be separated at the resolution of the PACS 160 m band, i.e., sources closer than 6″, which is half of the PSF FWHM, keeping only the brightest source at 24 m for each group of merged sources. The master catalog combined the MIPS source list with the direct detections in the 160 m image above the 5 level (101 mJy), all the latter being actually detected in the MIPS data. Merged sources account for almost 20% of the master catalog, with 85% (15%) of this subsample having 2 (3) objects within 6″. Just considering sources directly detected at 160 m, the fraction of them presenting multiple identifications in the MIPS catalog is higher than 40%. The WCS accuracy between the MIPS and PACS160 images is inferior to 1.5″.
The final purged list of sources was used to fit PSFs at the given positions using the daophot package in IRAF, allowing for one pixel centering offsets. The results of this PSF fitting algorithm are flux densities in a given aperture (we found the optimum values to be 5″ and 7.5″ for the PACS green and red channels, respectively), to which an aperture correction must be applied. The values we applied are 1.840.08 and 1.930.08 for 100 and 160 m, respectively. We note that these aperture corrections are larger than those published by the PACS Team, but we found that their PSF matched ours (constructed with the same Bullet cluster data) for large radii, but was brighter for similar and smaller radii than that selected for the PSF fitting method.
| PACS100 | PACS160 | SPIRE250 | SPIRE350 | SPIRE500 | |
|---|---|---|---|---|---|
| Aa | 28.5 | 29.7 | 434 | 438 | 416 |
| S()b | 5.5 (3.0) | 10 (6) | 12 (7) | 17 (10) | 18 (11) |
| Dc | 2.0 (5.0) | 2.0 (4.2) | 1.1 (1.8) | 0.5 (1.2) | 0.2 (0.6) |
| Md | 12% (24) | 19% (24) | 48% (24) | 42% (250) | 48% (350) |
-
a
Surveyed area in arcmin2.
-
b
5 (3) flux density detection levels1 in mJy.
-
c
Source densities for each significance level in sources/arcmin2.
-
d
Fraction of merged sources and wavelength (in m) used to obtain position priors.
The SPIRE catalogs were also compiled with a method based on priors and PSF fitting. The photometry was carried out in circular apertures (of radii 12″, 18″, and 22″ for 250, 350, and 500 m, respectively), applying a calibration based on the beam sizes (assuming they are Gaussians). For the 250 m channel, we combined the list of sources detected by MIPS at 24 m and the direct detection in the SPIRE data using Sextractor and a 5 threshold (122 mJy). Other objects within 9″ (half of the PSF FWHM) of a given candidate source were purged, only the position of the brightest galaxy at 24 m being kept. For the region covered simultaneously by MIPS and the SPIRE 250 m channel, only 2 SPIRE sources out of 261 were not detected by MIPS, but both of them turned to be F(24)60 Jy detections at the 3 level. Around half of the SPIRE sources have 2 or more MIPS counterparts within 9″. The WCS alignment between the MIPS and SPIRE250 images has an rms of 4″.
The catalog for the SPIRE 350 m channel was constructed from the list of detections at 250 m. Sources within 14″ were merged into the same object (about 40% of the total catalog, virtually all of them being a doublet), only the position of the brightest one at 250 m being kept. A direct detection in the 350 m image (173 mJy) found that 5% of sources are not directly linked to a 250 m emitter, but virtually all of these are a combination of several 250 m sources that causes a displaced 350 m centroid. Only one isolated high-confidence 350 m source was not detected in the 250 m catalog, but a reliable flux could be recovered in the blue channel once the 350 m detection revealed its position. The WCS alignment between the MIPS and SPIRE350 images has an rms of 6″.
For the 500 m channel (184 mJy), we started from the 350 m catalog, and we did not find any object without an identification in the bluer bands using a 18″ search radius (approximately half of the PSF FWHM). Around 50% of the SPIRE 500 m sources were doublets in the 350 m band. The WCS alignment between the MIPS and SPIRE500 images has an rms of 9″.
The prior-based photometric technique was compared with the direct blind detection in the Herschel images. In PACS, a direct detection down to 5 included more than 40% of sources with no counterpart in the MIPS map, implying that these are probably spurious detections. The fluxes of sources extracted with both the blind and prior-based detections are virtually identical. In SPIRE, the prior-based procedure is able to recover fluxes for 30% more sources than the direct detection. For the sources in common, the average difference in the photometry is 2% (the blind method provides brighter fluxes), with a 6% scatter.
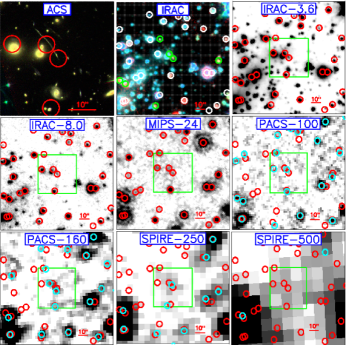
Table 1 indicates the surveyed areas, detection thresholds, the corresponding source densities, and fraction of merged sources for our catalogs of the PACS and SPIRE HLS data. An important (and potentially dangerous) step in our photometric procedure based on position priors is the blending of nearby non-resolved sources, which provides only the position of the brightest galaxy in the parent catalog to the PSF fitting algorithm. We note that the MIPS 24 m flux is dominated by the emission of warm dust and/or PAHs while the SPIRE bands are dominated by the emission of cold dust. Thus, it is probable that bright MIR emitters are not the dominant sources at FIR wavelengths (see Figure 1). In the following section, we illustrate a method to help in the robust identification and/or deblending of the Herschel sources.
3 Identification of high-z Herschel sources
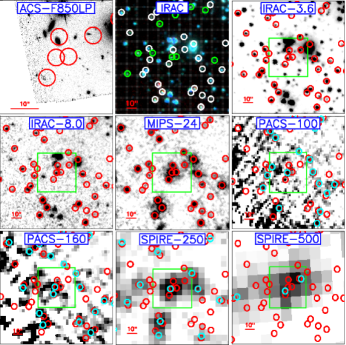
Figure 1 shows thumbnails in several bands of two interesting sources detected by Herschel in the Bullet cluster field: the southern tip of the arc at z3.24 described in Mehlert et al. (2001), and a sub-mm galaxy detected by LABOCA (source #10 in Johansson et al., 2010). With these two examples, we demonstrate that the use of IRAC and MIPS data helps to correctly identify the Herschel sources with optical/NIR counterparts. In the case of the arc, the photometric method based on the use of the MIPS 24 m catalog as a prior helped in the detection and measurement processes for the PACS 160 m and SPIRE bands, where the source is very faint and almost indistinguishable from the background. In the PACS red band, our method allows a deblending of the source in the two knots detected by MIPS and linked to the arc. In the case of the LABOCA source, although it is barely detected in the optical, the position of the source can be followed as we move to redder wavelengths and larger PSFs, allowing a more reliable identification in spite of the presence of a close neighbor to the west. The brightest source at 24 m is indeed already brighter than its companion at IRAC wavelengths (most noticeably, at 8.0 m), and this nearby source disappears in PACS. This illustrates the benefits of the use of Spitzer data as priors to obtain the most probable identifications of Herschel and (sub-)mm emitters at shorter wavelengths.
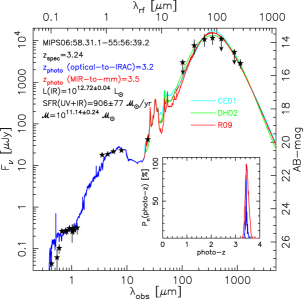
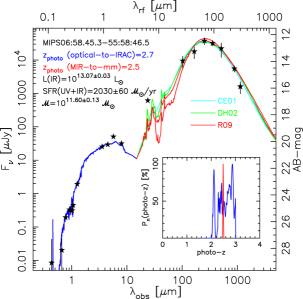
Figure 2 shows the optical-to-mm SEDs of the two examples of high-z galaxies. Photometric redshifts for all 24 m sources in the Bullet cluster field were estimated from the UV-to-MIR data (including IRAC fluxes) using the technique described in Pérez-González et al. (2005, 2008). Briefly, the SEDs compiled from aperture-matched photometry are fitted with stellar population models and AGN templates from Polletta et al. (2007). A minimization algorithm is used to search for the optimal redshifted template fitting the data, and the most probable photometric redshift is calculated by integrating the redshift probability function (see also Barro et al. 2010). Photometric redshifts were also estimated from the IR data alone by comparing the Spitzer, Herschel and (sub-)mm fluxes with dust emission templates from Chary & Elbaz (2001), Dale & Helou (2002), and Rieke et al. (2009). Using these two fits, we estimated relevant parameters such as the stellar mass and the SFR. The Rieke et al. (2009) template most closely fitting the data for the arc corresponds to a local L(IR)1011.5 L⊙ galaxy. This value is consistent with the average for the arc based on the three template libraries, L(IR)1011.40±0.04 L⊙, once a magnification factor of 21 is applied (Bradač et al., 2006). The LABOCA source qualifies as a hyper-LIRG based on the best fits to all template libraries (if it is not lensed), and the best-fit template from Rieke et al. is that of a local galaxy with 1012.75 L⊙, although our source seems to have more prominent PAH emission.
Figure 2 illustrates the power of using independent estimates of the photometric redshift based on UV-to-NIR data and IR data alone to validate the individual values (see the photo-z probability distributions). The procedure is also useful for achieving more reliable identifications of the IR emitters. For example, for the LABOCA source at z2.5, we calculated photometric redshifts based on UV-to-NIR data for the three close neighbors detected by MIPS within 10″ of the central source. The galaxy to the north lies at z0.3 (a cluster member), that to the south at z1.9, and the closest companion has a photo-z compatible with the central source (z2.30.3), thus implying that the two sources are a possible interacting pair.
The general validity of our method for the whole sample of Herschel sources will be tested thoroughly in forthcoming papers by evaluating the quality of our photo-z’s. From a preliminary comparison of the optical and FIR photo-z’s for sources detected by MIPS, PACS, SPIRE, and a (sub)-mm instrument, it is encouraging that we measure an average 0.09 with 10% of catastrophic outliers (0.2), comparable to the typical goodness of IR-based photo-z’s (Aretxaga et al., 2003).
Acknowledgements.
This work is based in part on observations made with Spitzer, operated by JPL/Caltech. We thank the AzTEC Team for letting us use their data. PGP-G acknowledges support from grants AYA 2006–02358, AYA 2006–15698–C02–02, and CSD2006-00070, and the Ramón y Cajal Program, all financed by the Spanish Government and/or the European Union.References
- Aretxaga et al. (2003) Aretxaga, I., Hughes, D. H., Chapin, E. L., et al. 2003, MNRAS, 342, 759
- Barro et al. (2010) Barro et al. 2010, ApJ (submitted)
- Bertin & Arnouts (1996) Bertin, E. & Arnouts, S. 1996, A&AS, 117, 393
- Blain et al. (2003) Blain, A. W., Barnard, V. E., & Chapman, S. C. 2003, MNRAS, 338, 733
- Bradač et al. (2006) Bradač, M., Clowe, D., Gonzalez, A. H., et al. 2006, ApJ, 652, 937
- Carilli & Yun (1999) Carilli, C. L. & Yun, M. S. 1999, ApJ, 513, L13
- Chapman et al. (2003) Chapman, S. C., et al., I. R. 2003, Nature, 422, 695
- Chapman et al. (2005) Chapman, S. C., Blain, A. W., Smail, I., & Ivison, R. J. 2005, ApJ, 622, 772
- Chary & Elbaz (2001) Chary, R. & Elbaz, D. 2001, ApJ, 556, 562
- Daddi et al. (2007) Daddi, E., Alexander, D. M., Dickinson, M., et al. 2007, ApJ, 670, 173
- Daddi et al. (2009) Daddi, E., Dannerbauer, H., Stern, D., et al. 2009, ApJ, 694, 1517
- Dale & Helou (2002) Dale, D. A. & Helou, G. 2002, ApJ, 576, 159
- Damen et al. (2009) Damen, M., Förster Schreiber, N. M., Franx, M., et al. 2009, ApJ, 705, 617
- Donley et al. (2008) Donley, J. L., et al., G. 2008, ApJ, 687, 111
- Dunne et al. (2000) Dunne, L., Clements, D. L., & Eales, S. A. 2000, MNRAS, 319, 813
- Egami et al. (2010) Egami et al. 2010, A&A(this volume)
- Flores et al. (1999) Flores, H., Hammer, F., Thuan, T. X., et al. 1999, ApJ, 517, 148
- Frayer et al. (2004) Frayer, D. T., Chapman, S. C., Yan, L., et al. 2004, ApJS, 154, 137
- Gonzalez et al. (2009) Gonzalez, A. H., Clowe, D., Bradač, M., et al. 2009, ApJ, 691, 525
- Griffin et al. (2010) Griffin et al. 2010, A&A(this volume)
- Hughes et al. (1998) Hughes, D. H., Serjeant, S., Dunlop, J., et al. 1998, Nature, 394, 241
- Ivison et al. (2002) Ivison, R. J., Greve, T. R., Smail, I., et al. 2002, MNRAS, 337, 1
- Johansson et al. (2010) Johansson, D., Horellou, C., Sommer, M. W., et al. 2010, A&A (accepted), astro-ph/1003.0827
- Kennicutt (1998) Kennicutt, R. C. 1998, ARA&A, 36, 189
- Le Floc’h et al. (2005) Le Floc’h, E., Papovich, C., Dole, H., et al. 2005, ApJ, 632, 169
- Magnelli et al. (2009) Magnelli, B., Elbaz, D., Chary, R. R., et al. 2009, A&A, 496, 57
- Mehlert et al. (2001) Mehlert, D., Seitz, S., Saglia, R. P., et al. 2001, A&A, 379, 96
- Mink (1999) Mink, D. J. 1999, in Astronomical Society of the Pacific Conference Series, Vol. 172, Astronomical Data Analysis Software and Systems VIII, ed. D. M. Mehringer, R. L. Plante, & D. A. Roberts, 498–+
- Pérez-González et al. (2005) Pérez-González, P. G., Rieke, G. H., Egami, E., et al. 2005, ApJ, 630, 82
- Pérez-González et al. (2008) Pérez-González, P. G., Rieke, G. H., Villar, V., et al. 2008, ApJ, 675, 234
- Papovich et al. (2006) Papovich, C., Moustakas, L. A., Dickinson, M., et al. 2006, ApJ, 640, 92
- Papovich et al. (2007) Papovich, C., Rudnick, G., Le Floc’h, E., et al. 2007, ApJ, 668, 45
- Pilbratt et al. (2010) Pilbratt et al. 2010, A&A(this volume)
- Poglitsch et al. (2010) Poglitsch et al. 2010, A&A(this volume)
- Polletta et al. (2007) Polletta, M., Tajer, M., Maraschi, L., et al. 2007, ApJ, 663, 81
- Pope et al. (2006) Pope, A., Scott, D., Dickinson, M., et al. 2006, MNRAS, 370, 1185
- Reddy et al. (2008) Reddy, N. A., Steidel, C. C., Pettini, M., et al. 2008, ApJS, 175, 48
- Rengarajan & Takeuchi (2001) Rengarajan, T. N. & Takeuchi, T. T. 2001, PASJ, 53, 433
- Rex et al. (2010) Rex et al. 2010, A&A(this volume)
- Rieke et al. (2009) Rieke, G. H., Alonso-Herrero, A., Weiner, B. J., et al. 2009, ApJ, 692, 556
- Rigby et al. (2008) Rigby, J. R., Marcillac, D., Egami, E., et al. 2008, ApJ, 675, 262
- Rodighiero et al. (2010) Rodighiero, G., Vaccari, M., Franceschini, A., et al. 2010, A&A (accepted), astro-ph/0910.5649
- Smail et al. (1997) Smail, I., Ivison, R. J., & Blain, A. W. 1997, ApJ, 490, L5
- Wilson et al. (2008) Wilson, G. W., Hughes, D. H., Aretxaga, I., et al. 2008, MNRAS, 390, 1061