Quantitative predictions on auxin-induced polar distribution of PIN proteins during vein formation in leaves
Abstract
The dynamic patterning of the plant hormone auxin and its efflux facilitator the PIN protein are the key regulator for the spatial and temporal organization of plant development. In particular auxin induces the polar localization of its own efflux facilitator. Due to this positive feedback auxin flow is directed and patterns of auxin and PIN arise. During the earliest stage of vein initiation in leaves auxin accumulates in a single cell in a rim of epidermal cells from which it flows into the ground meristem tissue of the leaf blade. There the localized auxin supply yields the successive polarization of PIN distribution along a strand of cells. We model the auxin and PIN dynamics within cells with a minimal canalization model. Solving the model analytically we uncover an excitable polarization front that triggers a polar distribution of PIN proteins in cells. As polarization fronts may extend to opposing directions from their initiation site we suggest a possible resolution to the puzzling occurrence of bipolar cells, such we offer an explanation for the development of closed, looped veins. Employing non-linear analysis we identify the role of the contributing microscopic processes during polarization. Furthermore, we deduce quantitative predictions on polarization fronts establishing a route to determine the up to now largely unknown kinetic rates of auxin and PIN dynamics.
pacs:
87.17.PqMorphogenesis and 87.10.CaAnalytical theories and 87.18.HfSpatiotemporal pattern formation in cellular populations and 82.40.BjOscillations, chaos, and bifurcations1 Introduction
The polar transport of the plant hormone auxin is the key regulator of many processes in the spatial and temporal organization of development and growth of plants. As the indole-3-acetic acid, in short auxin, induces the polar localization of its own efflux facilitator, a member of the family of PIN proteins, a variety of auxin and PIN patterns arise Petrasek:2009p4589 . Those distributions change dynamically as plants orient in response to environmental stimuli denoted tropism Friml:2002p1835 ; Marchant:1999p4592 . During the morphogenesis of plants PIN and auxin rearrangements lie at the heart of organ positioning via phyllotaxis Reinhardt:2003p348 and vein patterning in leaves Sieburth:1999p3331 .
The notion that auxin is transported in a polar, directed, manner inspired researchers since its discovery by Went in 1933 Went:1933p3768 . Early works already suggested the participation of a polar localized efflux carrier in the transport of auxin RUBERY:1973p3312 ; Goldsmith:1981p503 ; MITCHISON:1980p3359 , well before its discovery in the form of membrane bound PIN proteins a decade ago Galweiler:1998p1908 . Since then numerous experiments confirmed that PIN proteins facilitate the efflux of auxin from cells in plants Okada:1991p3335 ; Friml:2002p1835 ; Benkova:2003p3360 ; Friml:2003p3325 ; Reinhardt:2003p348 , yeast and mammalian cells, which had been supplied with auxin and PIN Petrasek:2006p531 . A feedback between auxin and its efflux facilitator localization was proposed by Sachs in his canalization hypothesis SACHS:1969p1017 , later formalized by Mitchison MITCHISON:1980p492 ; MITCHISON:1981p365 . Canalization predicts a feedback of auxin flow between neighboring cells on the amount of efflux facilitators favoring the direction of auxin flow. Experiments confirmed a definite feedback between auxin and PIN distribution Sauer:2006p1907 ; Scarpella:2006p352 , the cause of which is reported to lie in auxin affecting the clathrin dependent endocytotic cycling of PIN Paciorek:2005p1843 ; Dhonukshe:2008p367 . Late investigations also identified biochemical processes taking part in the PIN localization in response to auxin, see Ref. Benjamins:2008p381 for a review.
A variety of microscopic models for the dynamics of auxin and PIN proteins have been developed to describe their patterns during phyllotaxis Jonsson:2006p421 and leaf vein formation Feugier:2005p548 , see Berleth:2007p473 for a review. Extensive simulations of these microscopic models describe qualitative aspects of plant development. However, the role of the underlying biological processes and their kinetic rates still remain elusive to a large extent. Quantitative predictions based on analytical solutions of the microscopic equations in a simple scenario might on the one hand help to estimate kinetic parameters and on the other hand give insight into the impact of certain processes. A scenario amenable to such an investigation is the polarization of in this particular case PIN1 distribution due to auxin flow in the earliest stage of vein formation Smith:2009p5137 , see fig. 1.
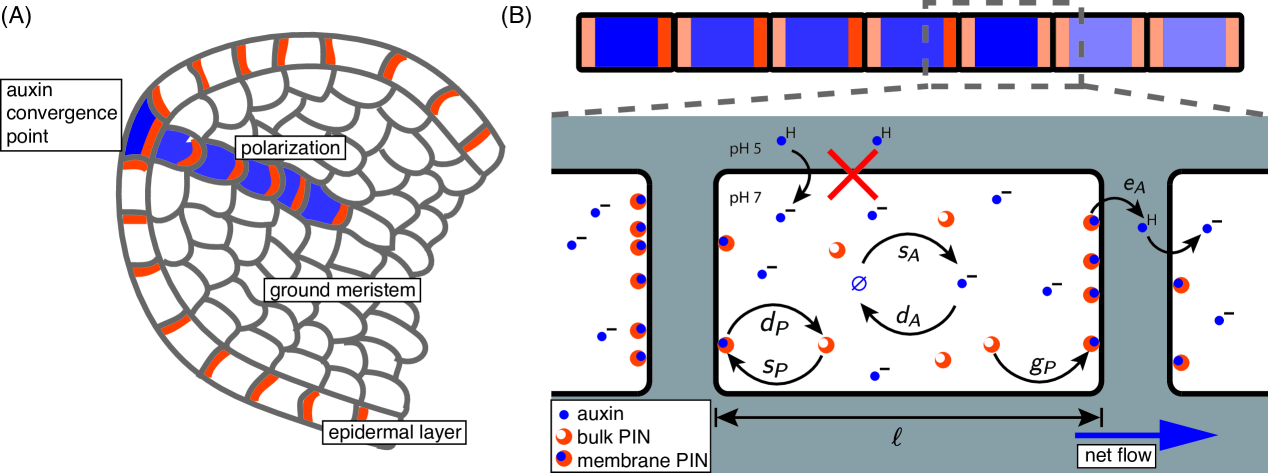
Vein initiation itself takes place in the ground meristem tissue of leaf primordia. The positions of vein initiation sites are determined by auxin accumulation in “convergence” points, which lie in a rim of epidermal cells around the ground meristem tissue Scarpella:2006p352 ; Wenzel:2007p1028 ; Bayer:2009p4590 ; Koenig:2009p4588 . These single cells with high auxin concentration polarize towards the ground meristem and locally transport their auxin into a cell in the ground meristem tissue. This localized inflow triggers the successive polarization of PIN distributions along a strand of cells starting from the cell with auxin inflow Scarpella:2006p352 . The strand of polarized cells finally extends up to a previously existing strand of polarized cells, building the pre-pattern for the vascular network. Starting from the petiole of the leaf primordium the polarized cells differentiate then into vascular cells Sawchuk:2007p4455 . In particular second order veins in Arabidopsis thaliana exhibit PIN polarization in opposite directions starting from a single bipolar cell, which lies in the ground meristem below the auxin convergence point in the epidermal layer Scarpella:2006p352 . This yet unresolved behavior gives rise to the formation of closed vein loops when both oppositely polarized strands connect to already formed veins.
A resolution on the origin of bipolar cells is postulated by examination of a minimal canalization model for the polarization of PIN distribution due to auxin supply in a one-dimensional strand of cells. Performing a non-linear analysis of the model reveals for each single cell two uniform stable states considering polarization. One resting state, where efflux facilitators are symmetrically distributed within the cell, and one polar state characterized by a constant net transport of auxin due to a polar localization of PIN proteins. The model predicts auxin triggered polarization pulses and fronts as a consequence of a dynamic rearrangement of PIN efflux facilitators towards the polar state. Cells with continuous auxin supply can be in a dynamic bipolar state, from which polarization fronts travel to both ends of a strand of cells. The role of the underlying kinetic processes becomes explicit in the course of the non-linear analysis of the polarization. An analytic solution result in quantitative predictions on the pulse’s and front’s auxin amplitude depending on the kinetic parameters, establishing a basis for detailed experimental determination.
2 Model
To describe how auxin polarizes the distribution of PIN during vein formation we focus on a one-dimensional strand of cells, see fig. 1 (B), assuming that there is no net auxin flow perpendicular to the direction of polarization. The strand is subdivided into cells of length numbered by . Every cell is characterized by a single auxin concentration and the concentration of membrane bound PIN proteins. We distinguish between PIN proteins in the bulk of the cell and adsorbed to the cell membrane either on the right hand side or on the left hand side of the cell, , and , respectively. The auxin concentration per cell changes due to synthesis and degradation with rates and . Furthermore, the amount of auxin changes due to a net flow to neighboring cells facilitated by PIN proteins embedded in the cell membranes of the corresponding cell-cell interface. The net flow from cell to cell is, hence, given by , where denotes the transport efficiency rate across the cell-cell interface. The full auxin dynamics is then described by,
| (1) |
Stating these dynamics for auxin we assume that auxin transport is dominantly from one inner cell to the other. Auxin is known to accumulate in cell interiors RUBERY:1973p3312 ; RAVEN:1975p3293 since auxin is a lipophilic weak acid which easily enters cells as undissociated acid, its prevailing form at the pH of 5 in extracellular space. In the interior of plant cells ion pumps keep the pH at 7 leading to the ionization of auxin and building a concentration gradient that accumulates auxin inside cells. As lipid membranes are impenetrable for the now charged molecule, auxin is trapped in the cell’s interior rendering efflux facilitator necessary. Being exported by PIN proteins auxin is free to diffuse in the extracellular space, the apoplast. However, the distance between neighboring cells is so small that almost all auxin molecules have entered any cell again within one millisecond 111The importance of extracellular diffusion of auxin can be assessed by estimating the residence time of auxin in extracellular space. Assuming an auxin molecule diffuses with diffusion constant Swarup:2005p429 in a typical cell-cell interface of . If it comes close to either of the cells the molecule may reenter. Taking into account that not all extracellular auxin molecules are protonated and hence able to penetrate the membrane we assume the probability to enter a cell to be of RAVEN:1975p3293 ; Goldsmith:1981p503 . Considering these assumptions already of all auxin molecules have reentered any cell including the one they were delivered from after a time duration of one millisecond USENKO:1987p3447 . . Furthermore, auxin can be assumed to be approximately uniformly distributed within typical cells because the diffusion of the small molecule auxin is very large. In aqueous solutions has been measured byKPaech:1955p3232 which has been confirmed by indirect measurements of the diffusion constant in auxin transport experiments WANGERMANN:1981p3137 . Distinct auxin gradient would therefore only arise for large plant cells of about or larger. It is not entirely clear that this reasoning holds under the condition of highly effective auxin transport Kramer:2007p401 , however, the time scale of auxin transport by mere diffusion through a cell of typical is , faster than other process contributing to the polarization of PIN, substantiating the neglect of auxin gradients within cells during PIN polarization. Hence, we can approximate auxin flow to be dominated by cell-to-cell transport. Synthesis and degradation of auxin are considered since they take place on fast time scales as the majority of auxin is stored in its conjugated form inside the cell which is readily hydrolyzed in less than seconds Pollmann:2002p3769 . This is in contrast to the production and degradation of PIN proteins, which takes place on much larger time scales of several minutes. We therefore model the total amount of PIN proteins to be constant per cell, yielding the following equality for the number of free PIN proteins in the bulk . Hence, we only consider the dynamics of PIN proteins embedded in a cell membrane. Their concentration changes first of all by a basal adsorption rate and a basal desorption rate . Additionally, the net auxin flow over a cell-cell interface is modeled to feed back onto the amount of PIN proteins favoring the flow direction. This is cast in an enhanced attachment or equally a decreased desorption rate: as proposed by canalization models SACHS:1969p1017 ; MITCHISON:1980p492 ; MITCHISON:1981p365 ; Feugier:2005p548 ; RollandLagan:2005p476 ; Stoma:2008p4203 ; Kramer:2009p4196 ; Smith:2009p5137 . By imposing the Heaviside step function , the feedback reacts to positive net flow only. For the following analysis the feedback is proportional to the square of the net auxin flow as stated above, in the discussion we explain that any exponent larger than one yields analogous results. Different feedback mechanisms proposed recently Jonsson:2006p421 ; Smith:2006p585 ; Merks:2007p3119 ; Ibanes:2009p4064 are also compared to our approach in the discussion. Incorporating the positive feedback on auxin flow, the PIN dynamics are given by,
| (2) | |||||
| (3) | |||||
Except for the non-linear feedback term, we assumed throughout the model setup linear relationships as a first order expansion to the yet elusive detailed underlying dynamics. We refer to the discussion for an analysis of model modifications confirming the robustness of our assumptions. In contrast to many existing canalization models MITCHISON:1980p492 ; MITCHISON:1981p365 ; RollandLagan:2005p476 ; Stoma:2008p4203 ; Kramer:2009p4196 ; Smith:2009p5137 we account for the detailed PIN cycling by endosomes similar to Ref. Feugier:2005p548 , however, we discard the explicit dynamics of a putative auxin synthesizer used in that work.
Up to now our model involves six kinetic rates, however, rescaling the concentration of auxin , where , and PIN proteins, , as well as time reveals that only four independent, dimensionless parameters govern the behavior of auxin and PIN dynamics, namely , , , and . Quantitative knowledge of the kinetic rates is very sparse. Half-life measurements of auxin yield estimates for its degradation rate, Rapparini:2002p523 , which is however strongly affected by environmental conditions such as light, wind, and temperature. Permeability measurements Delbarre:1996p1372 ; Swarup:2005p429 of PIN assisted auxin anion transport are found to be . For the other kinetic rates no experimental estimates are available to best of our knowledge although various rates have been assumed in simulations. This limited knowledge of the kinetic rates underlying auxin and PIN dynamics demonstrates how desired an intuition of their relation and role is, which can be obtained from mathematical analysis, opening up new approaches for experimental measurements.
3 Results
3.1 Observations from numerics
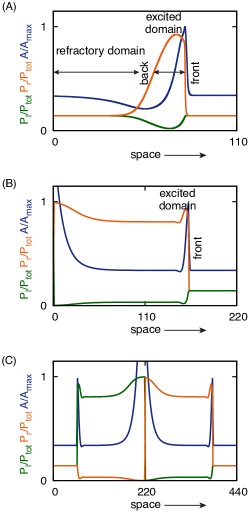
During vein formation auxin supplied from the outer epidermis enters a single cell initiating the polarization of a cell strand Scarpella:2006p352 . We simulated this scenario by integrating the microscopic equations (1-3) numerically for different kinds of auxin supply, see fig. 2. Starting from a strand of cell with evenly distributed PIN proteins and an equilibrated amount of auxin, we shortly applied auxin by increasing the initial auxin concentration in a single cell. This triggers a polarization pulse which shortly polarizes the PIN proteins in each cell before all cells relax back to their initial non-polar state, fig. 2 (A). Subsequent pulses can only be excited when the cells are almost relaxed back to their non-polar state therefore a certain lag time is required (data not shown). If the auxin is supplied continuously by keeping the amount of auxin in a single cell at high level a polarization front forms. The front causes all cells which it passed to become permanently polarized, fig. 2 (B). If a cell in the center of a strand of cells is continuously supplied with auxin two fronts arise traveling to opposite directions along the strand, fig. 2 (C). The latter two observations resemble those from vein formation Scarpella:2006p352 .
As the polarization pulse and front bear a lot of characteristics in common, deriving analytic solutions for the first gives also quantitative insight into the second. In the following our non-linear analysis explains the formation of a polarization pulse and front. Identifying the role of the underlying kinetic processes by exemplarily solving the polarization pulse we derive quantitative results for pulse and front properties. Observations in fig. 2 (A) and (B) indicate that changes in concentration of PIN proteins on the left, , facing adverse to the direction of transport, are very small. We therefore assumed in our following analysis , i.e., considering the stationary state value for a polarization traveling to the right.
3.2 Static state of a single cell
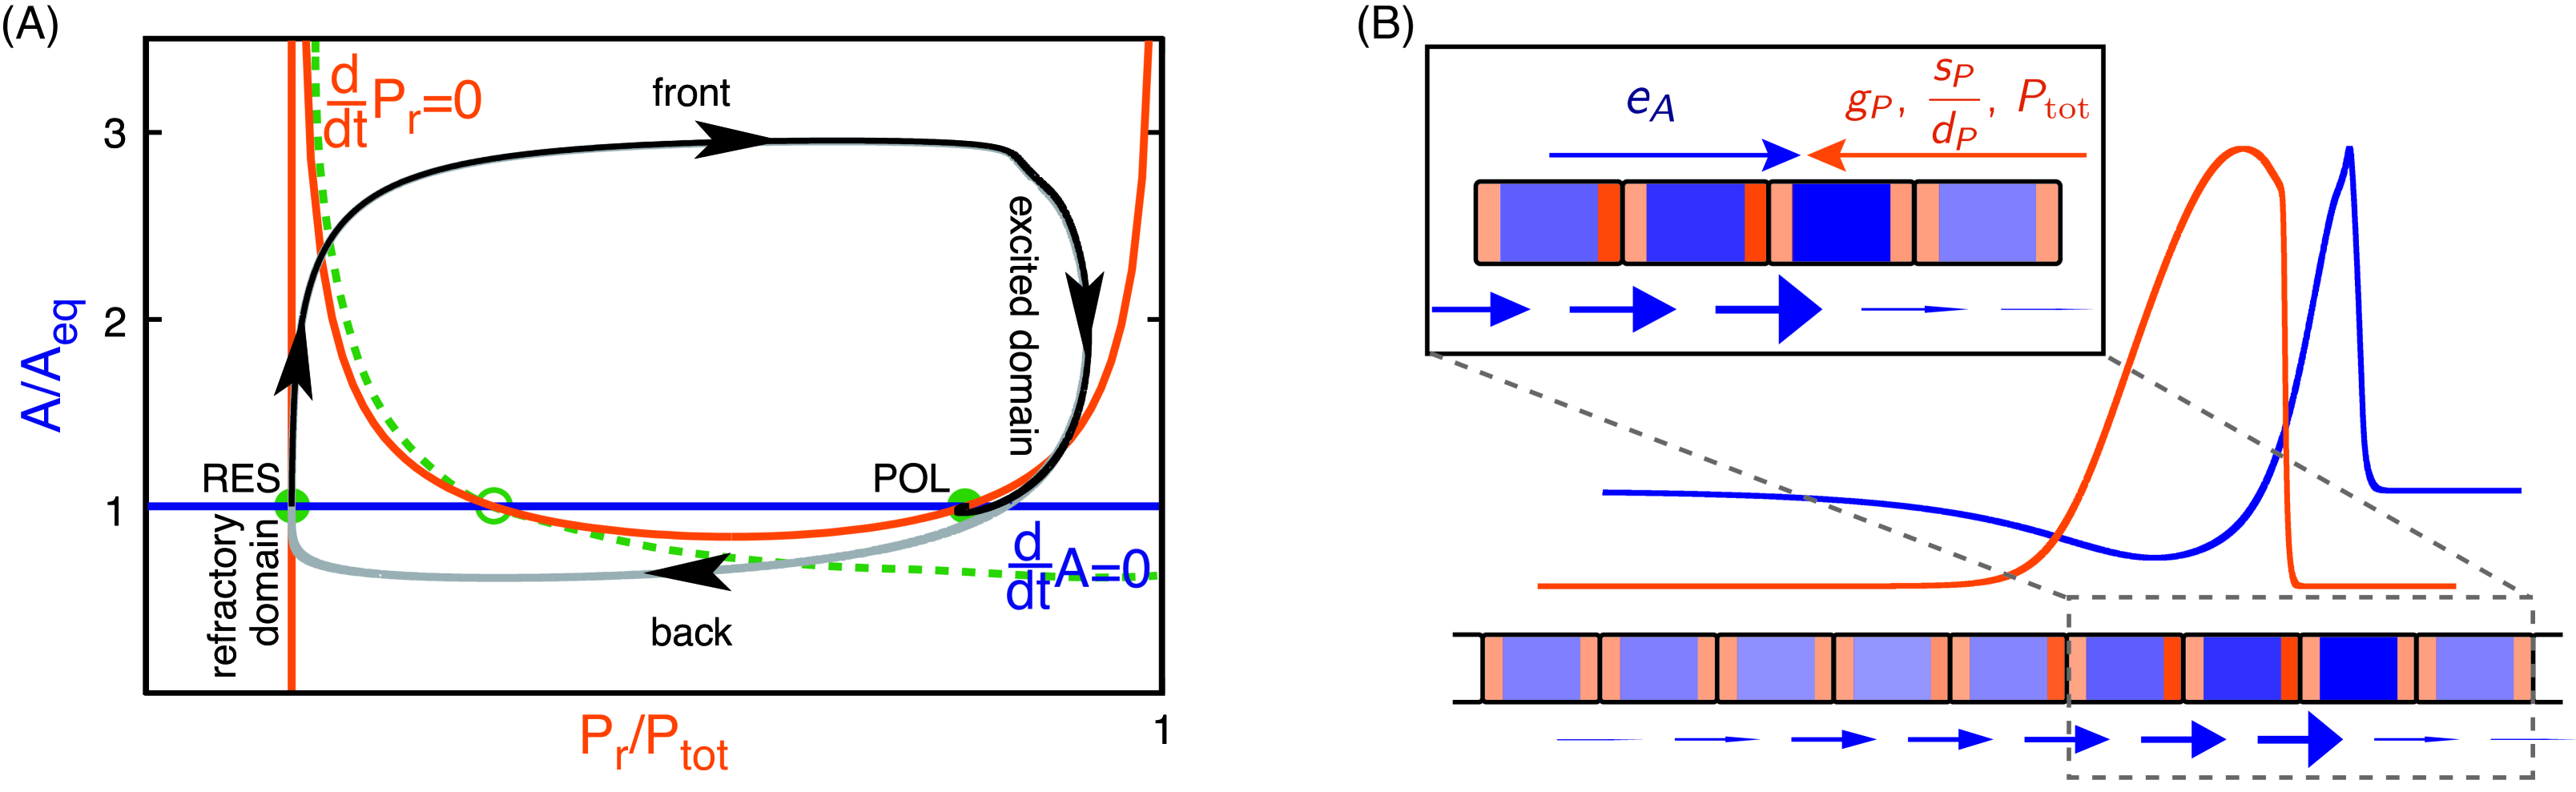
Assuming a uniform state for a whole strand of cells each single cell itself has two stable and one unstable equilibrium state, as shown in fig. 3 (A). The first stable fixed point at
| (4) | |||||
is a resting state, where PIN proteins are evenly distributed and no net auxin flow occurs. For parameters beyond two further crossings of the nullclines and occur in a saddle-node bifurcation, a pair of one unstable and one stable fixed point at
| (5) | |||||
respectively. At the second stable fixed point the PIN distribution is polar as outnumbers by at least , yielding a constant net flow of auxin to the right. The resting state originates from synthesis and degradation terms in eqs. (1-3), while the second pair of fixed points arises due to the feedback. As both the resting and the polar state are linearly stable a uniform set of cells decays into one of them depending on the cells initial state. Left of the unstable manifold embedding the unstable fixed point, depicted as dashed line in fig. 3 (A), all cells relax to the resting state while right to this separatrix all states decay to the polar fixed point. This is true for a homogeneous set of cells, however, in a spatially inhomogeneous system complex scenarios such as waves and fronts arise SergeevichZykov:1987p1055 ; SMikhailov:1991p1044 .
3.3 Dynamic transition
Due to spatial inhomogeneities passed on along a strand of cells from a cell with auxin supply, the state of a cell changes over time as a polarization pulse or front travels through. The trajectory of states of a single cell in time, fig. 3 (A), maps onto the trajectory of a polarization pulse over a strand of cells in space, see fig. 3 (B), allowing for a heuristic interpretation of the polarization dynamics. To investigate these dynamics we performed the continuum limit of the microscopic equations (1), (2), see Supplemental I for details. This gives rise to a set of partial differential equations, which describe the change of and at one point in space over time, as shown in eqs. (6,7) above.
| (6) | |||||
| (7) | |||||
This time evolution depends on reaction terms, including only auxin and PIN concentration at the same specific point in space, and gradient terms which account for the influence of neighboring sites. The reaction terms cause the system to relax to its stable fixed points as described in the previous section. The gradient terms, however, drive the system along its pulse trajectory.
The following explains the dynamic transition and the role of reaction and gradient terms in it starting from a cell in the non-polar resting state (RES). If the gradient in auxin and PIN to the neighboring cell is large enough the cell is forced out of its stable resting state to larger values of auxin entering the domain of attraction of the polar state (POL). If a neighboring cell has accumulated more auxin and has a higher amount of PIN facing the direction of the polarization pulse, , it is very effective in transporting auxin onwards into a cell, raising the auxin content well above the equilibrium value. As the now auxin supplied cell has itself more auxin to transport onwards, the net flux increases starting off the positive feedback which results in PIN polarization. The then fully polarized cell is very efficient in moving its excess auxin onwards, finally decreasing its auxin content towards the polar stable state. The neighboring cell that has been polar and transporting on auxin for a bit longer has less auxin, reversing the direction of the auxin gradient. If this auxin gradient is large enough it drives the cell past its polar state into the domain of attraction of the resting state. Hence, if the amount of auxin in the neighboring cell is very low, the auxin supply breaks down and with it the onward flux of auxin. The positive feedback is decreasing and with it polarization towards the non-polar resting state. Subsequent polarization pulses can only be triggered if the polarization already saturated down to almost resting state values, otherwise the remaining polarization would just transport the applied auxin onwards before the positive feedback can build up an enhanced polarization of PIN proteins. The phenomenon that a system has to relax back to its resting state before a new pulse can be excited is denoted refractory phase in excitable media.
We find that the gradient terms in the auxin and PIN dynamics have unequal analytic structures that lead to their different functions. In the PIN dynamics the squared gradient increases spatial inhomogeneities in PIN distribution by augmenting up to saturation. In the auxin dynamics the signs of auxin and PIN gradients decide the direction of change in auxin concentration. In front of an excitation pulse the gradient induces a growth of auxin content, while it decreases the amount of auxin at the rear of the pulse. The magnitude of the auxin gradient also decides between the formation of a polarization pulse or front. If the auxin content in the neighboring cell is only slightly smaller due to continuous or only slowly varying auxin supply a constant flux of auxin through polar cells is established, a polarization front forms. If, however, the auxin gradient is large and the auxin inflow decreases drastically the feedback breaks down and the cells in the polarization pulse relax back to their resting state. In summary the polarization of PIN distribution by auxin flow is initially a bistable system that behaves like an excitable medium depending on the amount and continuity of auxin supply.
3.4 Analytical results
Identifying polarization dynamics as an excitable medium enables us to go beyond numerical integration of the microscopic equations and analytically compute the auxin amplitude of a polarization pulse or front. To this end we employed singular perturbation theory ORTOLEVA:1975p543 ; CASTEN:1975p3477 on a polarization pulse. Here we explain the outline of the calculation, a detailed derivation is provided in Supplemental I. The whole polarization pulse can be subdivided into four regions as shown in fig. 2 (A) and fig. 3 (A), first the front and back where the auxin concentration is nearly constant and only the number of PIN proteins changes significantly. Second the excited and the refractory domain during which the efflux facilitator concentration follows approximately the nullcline and hence only changes according to the nullclines’ variation with the auxin concentration while the auxin concentration itself varies profoundly. Therefore, all four regions are governed to good approximation by just a single non-linear equation, the one of the PIN protein dynamics or the one of auxin dynamics, respectively. Unfortunately, even each single continuum equation is not analytically solvable. The model equations (6, 7) are therefore linearized around the stable nullclines yielding two sets of equations, one left to the unstable manifold and one right to it. By this linearization we overestimated the PIN dynamics close to the unstable manifold which leads to smaller auxin amplitudes than those resulting from the integration of the microscopic equations (1-3). An algebraic solution is obtained by imposing a traveling wave Ansatz , and solving all four equations under the condition of differential continuity at their intersections. The calculation yields a closed expression for the auxin amplitude which captures the role of the underlying kinetic parameters:
| (8) |
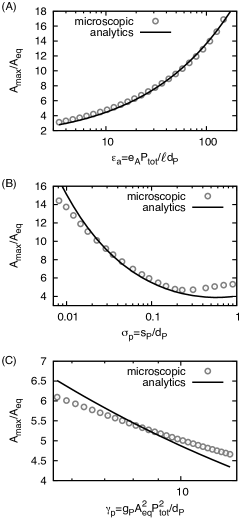
where we abbreviated , , and . The analytic result is compared to the numeric integration of the microscopic equations (1-3) over a broad range of the kinetic parameters in fig. 4. Due to the linearization of the equations the algebraic amplitudes are too low. Fitting the analytic to the numeric results yields an overall factor . This constant factor does not depend on the specific parameter range. Considering the amount of approximations that entered the calculation, the analytic result captures very well the dependence on the kinetic parameters over orders of magnitudes. To obtain insight in how the magnitude of the kinetic parameters determines the amplitude, we simplified eq. (8) further. Following our considerations on the size of the kinetic parameters in fig. 4, is smaller than one. Hence, expanding for small gives,
| (9) |
As the amplitude arises due to auxin inflow from neighboring cells increases with the rescaled transport efficiency . Auxin is accumulated in a cell until the cell reaches its almost fully polarized state and can efficiently transport auxin onwards, see fig. 3 (B). Hence, accumulation time and auxin amplitude inversely depend on the basal PIN cycling rate and the enhanced attachment rate . Synthesis and degradation of auxin do not contribute to the amplitude in this first order approximation as their impact on the transport is very small. Note, that the amplitude like all other pulse and front characteristics is independent of the amount of supplied auxin, a general property of excitable media. Applying the above simplification to the resulting analytic expressions for the velocity of the auxin pulse, see Supplemental eq. (S7), (S8), yields,
| (10) |
This result reveals that the pulse of front velocity is dominated by membrane permeability of auxin facilitated by PIN proteins which is just the product of transport efficiency and number of PIN proteins per cell. The prefactor in eq. (10) can be estimated from comparison with numeric integration of the microscopic equations as shown in fig. 4 to be in the range of depending on the remaining kinetic parameters.
4 Discussion
We have shown that some prominent aspects of auxin and PIN dynamics can be inferred from a simple mathematical model. Our model predicts the transition of ground meristem cells from a non-polarized stable state to a polarized stable state of constant auxin flow. This development occurs by a traveling wave front triggered by a continuous inflow of auxin from the outer epidermal layer, in accordance with experimental observations Scarpella:2006p352 . Each cell is a bistable excitable medium. Excitations from one state to the other can be induced by supply of auxin and crucially depend on the spatial gradients in auxin and polar PIN concentrations between cells. The amplitude of auxin in the wave front and the polarization of the stable states is cast in analytical expressions concordant with numerical integration of our microscopic equations.
The microscopic equations underlying our model for auxin and PIN dynamics are defined such that all relevant biological processes are included while a minimum of assumptions on their actual kinetics entered. To this end only linear synthesis, degradation and transport etc. is considered as a first order approximation of any kind of kinetics. However, the model is robust against alteration of the linear relationships, as is illustrated in Supplemental II. For example, extending the cell to cell auxin transport to account for Michaelis-Menten kinetics preserves the form of the nullclines and the dynamics of the wave. In our model only the feedback of auxin flow on the attachment of PIN proteins enters non-linearly. A linear growth of the enhanced attachment rate with the auxin flow cannot lead to a propagating front, as such a model does not exhibit two stable fixed points. Only auxin flow exponents higher than one show these properties. However, the exact value of the exponent does not affect the form and dynamics of the traveling wave, again confirming the robustness of our assumptions.
Recently, models for auxin and PIN dynamics were developed proposing that the auxin concentration in the neighboring cell feeds back onto an enhanced attachment rate of PIN proteins Jonsson:2006p421 ; Smith:2006p585 ; Merks:2007p3119 ; Ibanes:2009p4064 in contrast to canalization models, where the net auxin flux governs the feedback. These concentration driven models exhibit a static state of spatially ordered auxin maxima with PIN proteins polarized towards these auxin maxima Jonsson:2006p421 . This behavior arises as concentration driven feedback changes the non-linear character of auxin and PIN dynamics. These models generally exhibit only a single stable, resting fixed point Newell:2008p356 ; Sahlin:2009p2675 . The polarization due to auxin supply observed in these models Merks:2007p3119 arises due to an evolved relaxation into the stable, resting state. Hence, the polarization is only temporary and, for instance, the amount of polarization and the velocity of the polarization front depend crucially on the amount of auxin supply. This is in contrast to our minimal canalization model, where all polarization characteristics are only governed by the kinetic parameters. The amount of auxin supply in an excitable medium only regulates if a pulse or front is excited or not. Hence, these qualitative differences may help to distinguish between the different models experimentally.
The role of all kinetic processes during the dynamic rearrangement of PIN and auxin in cells becomes explicit when examining the very front of the polarization in a microscopic scenario as illustrated in fig. 3 (B). The almost fully polarized cell at the peak of the front carries a lot of auxin molecules that are invading the next yet non-polar cell in the direction of polarization with a rate mainly governed by the cell-to-cell transport efficiency . To successfully transfer the accumulating auxin onwards the PIN proteins in the yet non-polar cell have to rearrange to facilitate directed transport. However, the endosome cycling , by which the membrane bound PIN proteins reach the cell membrane is very slow. Hence, the attachment rate of the efflux facilitators forms a bottleneck that piles up more and more auxin in a cell, that is slowly increasing the amount of PIN proteins facing the direction of transport. Heuristically, an auxin pulse forms due to a traffic jam caused by the slow cycling of the efflux facilitators, as given by eq. (9). As an equilibrium concentration of PIN proteins is always embedded in each membrane ready to transport auxin, the magnitude of the velocity of a polarization front or pulse is set by the cell-to-cell transport efficiency, see eq. (10). The other kinetic parameters only slightly modulate the velocity. The PIN attachment rates, , , and detachment rate, , on the other hand determine the number of PIN proteins accumulated at the membrane in the polar stable state, see eq. (5). The polarization grows with the enhanced attachment rate, the strength of the feedback, . On the contrary, basal PIN cycling intensifies the competition between opposing membranes decreasing the amount of PIN proteins in the direction of polarization.
The result of our analytic expressions for the PIN concentration in the polar state with constant auxin flux in eq. (5) and the auxin amplitude at the very head of the polarization front eq. (8) enable estimates of the underlying kinetic rates by identifying and measuring these observables in future experiments. Existing experimental results by Scarpella et al. Scarpella:2006p352 permit an estimate of the polarization front velocity in the range , in accordance with our estimate for the velocity , resulting from the fitted pre-factor in eq. (10) and the literature value of auxin permeability Delbarre:1996p1372 ; Swarup:2005p429 . An quantitative estimate of PIN polarity from the same existing data is to best of our knowledge yet unfeasible as a reference for the protein number is absent. This could be overcome by new experiments, which could also aim at the auxin kinetic rates. Unlike PIN which is readily GFP tagged, auxin is not directly detectable and quantification of its amount can only occur via indirect methods. Recently, measurements of deuterated auxin improved Ljung:2005p397 making experiments with exogenously applied auxin conceivable. In such setups one should, however, keep in mind that exogenous auxin mixes with endogenous, non-labelled auxin, decreasing the observed amplitude. The position of the auxin peak can easily be located as it should be accumulated in front of those cells with the largest amount of PIN proteins at the corresponding membrane. Measurements of the amount of PIN proteins in polarized cells via GFP tagging could not only disclose the basal endosome cycling rate but also the magnitude of the feedback between auxin flow and PIN dynamics.
The occurrence of bipolar cells has stimulated previous theoretical models introducing a hypothetical new molecule Feugier:2006p477 or moving auxin sources RollandLagan:2005p476 . Our model, however, readily predicts the occurrence of bipolar cells along a one-dimensional strand of cells at the site of continuous auxin inflow. These cells show a high concentration of PIN proteins on either membrane, a balanced outcome of the competition for PIN between both membranes. This state is not a statically stable but dynamically driven by the supply of auxin. Transferring this observation to the two-dimensional layer of ground meristem cells during vein initiation may explain the bipolar cells observed experimentally Scarpella:2006p352 ; Wenzel:2007p1028 ; Bayer:2009p4590 ; Koenig:2009p4588 . In two dimensions several membranes can compete, yielding also triple polar cells or theoretically higher orders of polarity. However, in biological cells not all cell membranes may have the same number of PIN proteins to enter the competition. Those with fewer initial PIN proteins will become the site of PIN drain, decreasing the number of successful polarization fronts. Experiments indicate that mechanical cues might favor certain membranes Hamant:2008p627 paving the way of a polarization front and hence the position of veins and vein loops.
In summary we analyzed a canalization model to explain how auxin and PIN dynamics polarize the distribution of PIN proteins during early vein initiation in the ground meristem. Each cell is found to be bistable considering their PIN distribution in the membrane. Polarization occurs in a traveling front as auxin is supplied to a single cell mimicking the auxin inflow from the outer epidermal cell layer. The driver in this transition is the spatial gradient of auxin and polar PIN concentration between cells. The key idea in this polarization is the positive feedback between hormone auxin and its own efflux facilitator PIN. An idea that might be inspiring in other developmental processes in animals where tissue is polarized as, for example, in planar cell polarity Lawrence:2007p4177 . As the polarization front can travel in opposite directions from its initiation site, a bipolar cell, the up to now puzzling occurrence of closed vein loops can be resolved. Furthermore, our nonlinear analysis enables the calculation of exact analytical expression for the polarization front. Therefore, our new quantitative predictions for the PIN polarization driven by auxin flow establishes a basis to determine the kinetic parameters underlying the transport of auxin and may therewith have far-reaching impacts on the understanding of the developmental processes and their differences in plant species, to perceive the fundamental patterns of leaf veins or phyllotaxis and learn how environmental conditions alter these.
Acknowledgements
The authors thank Eric M. Kramer for fruitful discussions. Financial support of the German Excellence Initiative via the program ”Nanosystems Initiative Munich (NIM)” and of the LMUinnovativ project ”Functional Nanosystems (FuNS)” is gratefully acknowledged. K.A. acknowledges funding by the Studienstiftung des deutschen Volkes.
References
- (1) J. Petrasek, J. Friml, Development 136(16), 2675 (2009)
- (2) J. Friml, J. Wiśniewska, E. Benková, K. Mendgen, K. Palme, Nature 415(6873), 806 (2002)
- (3) A. Marchant, J. Kargul, S.T. May, P. Muller, A. Delbarre, C. Perrot-Rechenmann, M.J. Bennett, EMBO J 18(8), 2066 (1999)
- (4) D. Reinhardt, E.R. Pesce, P. Stieger, T. Mandel, K. Baltensperger, M. Bennett, J. Traas, J. Friml, C. Kuhlemeier, Nature 426(6964), 255 (2003)
- (5) L.E. Sieburth, Plant Physiol. 121(4), 1179 (1999)
- (6) F.A.F.C. Went, Naturwissenschaften 21, 1 (1933)
- (7) P.H. Rubery, A.R. Sheldrake, Nature - New Biol. 244(139), 285 (1973)
- (8) M.H.M. Goldsmith, T.H. Goldsmith, M.H. Martin, Proc. Natl. Acad. Sci. USA 78(2), 976 (1981)
- (9) G.J. Mitchison, Proc. Roy. Soc. Lond. B Bio. 209(1177), 489 (1980)
- (10) L. Gälweiler, C.H. Guan, A. Müller, E. Wisman, K. Mendgen, A. Yephremov, K. Palme, Science 282(5397), 2226 (1998)
- (11) K. Okada, J. Ueda, M.K. Komaki, C.J. Bell, Y. Shimura, Plant Cell 3(7), 677 (1991)
- (12) E. Benková, M. Michniewicz, M. Sauer, T. Teichmann, D. Seifertová, G. Jürgens, J. Friml, Cell 115(5), 591 (2003)
- (13) J. Friml, A. Vieten, M. Sauer, D. Weijers, H. Schwarz, T. Hamann, R. Offringa, G. Jürgens, Nature 426(6963), 147 (2003)
- (14) J. Petrášek, J. Mravec, R. Bouchard, J.J. Blakeslee, M. Abas, D. Seifertová, J. Wiśniewska, Z. Tadele, M. Kubeš, M. Čovanová et al., Science 312(5775), 914 (2006)
- (15) T. Sachs, Ann. Bot. - London 33(130), 263 (1969)
- (16) G.J. Mitchison, Proc. Roy. Soc. Lond. B Bio. 207(1166), 79 (1980)
- (17) G.J. Mitchison, Philos. Trans. Roy. Soc. B 295(1078), 461 (1981)
- (18) M. Sauer, J. Balla, C. Luschnig, J. Wisniewska, V. Reinohl, J. Friml, E. Benkova, Genes Dev 20(20), 2902 (2006)
- (19) E. Scarpella, D. Marcos, J. Friml, T. Berleth, Genes Dev 20(8), 1015 (2006)
- (20) T. Paciorek, E. Zažimalová, N. Ruthardt, J. Petrášek, Y.D. Stierhof, J. Kleine-Vehn, D.A. Morris, N. Emans, G. Jürgens, N. Geldner et al., Nature 435(7046), 1251 (2005)
- (21) P. Dhonukshe, I. Grigoriev, R. Fischer, M. Tominaga, D.G. Robinson, J. Hasek, T. Paciorek, J. Petrásek, D. Seifertová, R. Tejos et al., P Natl Acad Sci USA 105(11), 4489 (2008)
- (22) R. Benjamins, B. Scheres, Annual Rev Plant Biol 59, 443 (2008)
- (23) H. Jönsson, M.G. Heisler, B.E. Shapiro, E.M. Meyerowitz, E. Mjolsness, Proc. Natl. Acad. Sci. USA 103(5), 1633 (2006)
- (24) F.G. Feugier, A. Mochizuki, Y. Iwasa, J. Theor. Biol. 236(4), 366 (2005)
- (25) T. Berleth, E. Scarpella, P. Prusinkiewicz, Trends Plant Sci 12(4), 151 (2007)
- (26) R.S. Smith, E.M. Bayer, Plant Cell Environ 32(9), 1258 (2009)
- (27) C.L. Wenzel, M. Schuetz, Q. Yu, J. Mattsson, Plant J 49(3), 387 (2007)
- (28) E.M. Bayer, R.S. Smith, T. Mandel, N. Nakayama, M. Sauer, P. Prusinkiewicz, C. Kuhlemeier, Genes Dev 23(3), 373 (2009)
- (29) D. Koenig, E. Bayer, J. Kang, C. Kuhlemeier, N. Sinha, Development 136(17), 2997 (2009)
- (30) M.G. Sawchuk, P. Head, T.J. Donner, E. Scarpella, New Phytol 176(3), 560 (2007)
- (31) J.A. Raven, New Phytol. 74(2), 163 (1975)
- (32) R. Swarup, E.M. Kramer, P. Perry, K. Knox, H.M.O. Leyser, J. Haseloff, G.T.S. Beemster, R. Bhalerao, M.J. Bennett, Nat. Cell. Biol. 7(11), 1057 (2005)
- (33) A.S. Usenko, A.G. Zagorodny, Mol. Phys. 61(5), 1213 (1987)
- (34) P. Larsen, Growth substances in higher plants, Vol. 3 of Modern methods of plant physiology (Springer, Berlin, 1955)
- (35) E. Wangermann, G.J. Mitchison, Plant Cell Environ. 4(2), 141 (1981)
- (36) E.M. Kramer, J Exp. Bot. 59(1), 45 (2007)
- (37) S. Pollmann, A. Müller, M. Piotrowski, E.W. Weiler, Planta 216(1), 155 (2002)
- (38) A.G. Rolland-Lagan, P. Prusinkiewicz, Plant J 44(5), 854 (2005)
- (39) S. Stoma, M. Lucas, J. Chopard, M. Schaedel, J. Traas, C. Godin, PLoS Comput Biol 4(10), e1000207 (2008)
- (40) E.M. Kramer, Trends Plant Sci 14(5), 242 (2009)
- (41) R.S. Smith, S. Guyomarc’h, T. Mandel, D. Reinhardt, C. Kuhlemeier, P. Prusinkiewicz, Proc. Natl. Acad. Sci. USA 103(5), 1301 (2006)
- (42) R.M.H. Merks, Y.V. de Peer, D. Inzé, G.T.S. Beemster, Trends Plant Sci 12(9), 384 (2007)
- (43) M. Ibañes, N. Fàbregas, J. Chory, A. Caño-Delgado, P. Natl. Acad. Sci. USA 106(32), 13630 (2009)
- (44) F. Rapparini, Y.Y. Tam, J.D. Cohen, J.P. Slovin, Plant Physiol. 128(4), 1410 (2002)
- (45) A. Delbarre, P. Muller, V. Imhoff, J. Guern, Planta 198(4), 532 (1996)
- (46) V.S. Zykov, A.T. Winfree, Simulation of Wave Processes in Excitable Media (Manchester Univ. Press, Manchester, 1987)
- (47) A.S. Mikhailov, A.Y. Loskutov, Foundations of Synergetics I: Distributed Active Systems (Springer Verlag, New York, 1991)
- (48) C.L. Howe, W.C. Mobley, J Neurobiol 58(2), 207 (2004)
- (49) P. Ortoleva, J. Ross, J. Chem. Phys. 63(8), 3398 (1975)
- (50) R.G. Casten, H. Cohen, P.A. Lagerstrom, Q. Appl. Math. 32(4), 365 (1975)
- (51) A. Newell, P. Shipman, Z. Sun, J Theor Biol 251(3), 421 (2008)
- (52) P. Sahlin, B. Söderberg, H. Jönsson, J Theor Biol 258(1), 60 (2009)
- (53) K. Ljung, A.K. Hull, J. Celenza, M. Yamada, M. Estelle, J. Normanly, G. Sandberg, Plant Cell 17(4), 1090 (2005)
- (54) F. Feugier, Y. Iwasa, J Theor Biol 243(2), 235 (2006)
- (55) O. Hamant, M.G. Heisler, H. Jonsson, P. Krupinski, M. Uyttewaal, P. Bokov, F. Corson, P. Sahlin, A. Boudaoud, E.M. Meyerowitz et al., Science 322(5908), 1650 (2008)
- (56) P.A. Lawrence, G. Struhl, J. Casal, Nat Rev Genet 8(7), 555 (2007)
See pages - of ./Supplemental.pdf