Witnessing the Formation of a Brightest Cluster Galaxy in a Nearby X-ray Cluster⋆
Abstract
The central dominant galaxies in galaxy clusters constitute the most massive and luminous galaxies in the Universe. Despite this, the formation of these brightest cluster galaxies (BCGs) and the impact of this on the surrounding cluster environment remain poorly understood. Here we present multi-wavelength observations of the nearby poor X-ray cluster MZ 10451, in which both processes can be studied in unprecedented detail. Chandra observations of the intracluster medium (ICM) in the cluster core, which harbors two optically bright early-type galaxies in the process of merging, show that the system has retained a cool core and a central metal excess. This suggests that any merger–induced ICM heating and mixing remain modest at this stage. Tidally stripped stars seen around either galaxy likely represent an emerging intracluster light component, and the central ICM abundance enhancement may have a prominent contribution from in situ enrichment provided by these stars. The smaller of the merging galaxies shows evidence for having retained a hot gas halo, along with tentative evidence for some obscured star formation, suggesting that not all BCG major mergers at low redshift are completely dissipationless. Both galaxies are slightly offset from the peak of the ICM emission, with all three lying on an axis that roughly coincides with the large-scale elongation of the ICM. Our data are consistent with a picture in which central BCGs are built up by mergers close to the cluster core, by galaxies infalling on radial orbits aligned with the cosmological filaments feeding the cluster.
Subject headings:
galaxies: clusters: individual (MZ 10451) — galaxies: elliptical and lenticular, cD — galaxies: evolution — galaxies: interactions — X-rays: galaxies: clusters1. INTRODUCTION
The most massive galaxies in the Universe occur in rich groups and clusters. These brightest cluster galaxies (hereafter BCGs) often reside close to the peak of the diffuse X-ray emission from the intracluster medium (ICM; Jones & Forman 1984; Zabludoff & Mulchaey 1998; Lin & Mohr 2004; Rafferty et al. 2008), and can have recessional velocities indistinguishable from the cluster mean (Quintana & Lawrie 1982; Zabludoff et al. 1990; but see also Coziol et al. 2009). Their major axis is preferentially aligned with that of the host cluster, as defined by the projected distribution of cluster galaxies (e.g., Binggeli 1982) or the ICM X-ray emission (Hashimoto et al., 2008), an effect which seems independent of cluster richness (Fuller et al., 1999). Furthermore, there is a clear relationship between the stellar luminosity of central BCGs and the total mass and X-ray luminosity of their host cluster (Edge & Stewart, 1991; Brough et al., 2008; Hansen et al., 2009; Mittal et al., 2009).
These observations suggest that many BCGs reside near the centers of the cluster gravitational potential, and that the formation of central BCGs is intimately linked to the formation and evolution of the cluster itself, as anticipated in a hierarchical structure formation scenario. This idea is supported by results of cosmological simulations which indicate that central BCGs are built up through a series of mergers near the cluster core (e.g, Dubinski 1998; Conroy et al. 2007; De Lucia & Blaizot 2007). Such simulations also suggest that these mergers must have been predominantly dissipationless, at least for BCG major mergers occurring at low redshift (e.g., Khochfar & Burkert 2003; De Lucia & Blaizot 2007). The notion that BCGs have a unique formation history is further reinforced by findings indicating that their properties are separate from those of other (cluster) galaxies. For example, the optical luminosity of BCGs is not drawn from the same distribution as that of other cluster members (Tremaine & Richstone, 1977; Vale & Ostriker, 2008), BCGs tend to have spatially extended stellar halos not seen around other galaxies (e.g., Gonzalez et al. 2003), and they are more likely to be radio-loud than other galaxies of similar stellar mass (Best et al., 2007).
Unfortunately, an observational understanding of the formation of BCGs is largely limited by the fact that few systems in the process of forming have actually been identified. Multiple nuclei are common in BCGs at low and moderate redshifts, suggesting that galaxy–galaxy mergers must be frequent (e.g., Lauer 1988; Mulchaey et al. 2006; Jeltema et al. 2007). In a few cases, multiple galaxies at the initial stages of merging have been identified at the centers of X-ray clusters (Yamada et al., 2002; Nipoti et al., 2003; Tran et al., 2008), including one case in which tidal features provide direct evidence for galaxy–galaxy interactions (Rines et al., 2007). However, as these examples all occur at moderate to high redshifts, detailed studies of the BCG formation process have not been possible. Potential examples at lower redshift include known dumbbell galaxies (Gregorini et al., 1992), some of which constitute the brightest galaxy in X-ray clusters. However, at least some of these are likely to represent various stages in the mergers of cluster cores, each already containing a fully formed central dominant galaxy (Tremaine, 1990; Pimbblet, 2008). As such, they may not offer a particularly clean view of the build-up of the BCG itself.
For these reasons, it also remains uncertain to what extent BCG formation may have affected the thermodynamic history of baryons in X-ray bright cluster cores. For example, major galaxy–galaxy mergers near the core of a cluster could provide a mechanism for distributing metals into the ICM (Zaritsky et al., 2004) and so provide a partial explanation for the pronounced central metal excesses observed in many systems (e.g., Finoguenov et al. 2000; De Grandi et al. 2004; Leccardi & Molendi 2008). Such mergers might also act to disrupt the formation of cool cores, and thereby help explain the puzzling dichotomy between “cool-core” and “non cool-core” groups and clusters (e.g., Sanderson et al. 2009).
Here we present a Chandra study of a recently discovered low-redshift () X-ray cluster, MZ 10451, with a BCG in the process of forming. To the best of our knowledge, and if excluding dumbbell galaxies but including major merger candidates in low-redshift SDSS groups and clusters (McIntosh et al., 2008), this represents the first known case of an ongoing central BCG major merger in an X-ray cluster in the nearby Universe. The goal of the present investigation is two-fold. We aim to establish how the ongoing galaxy–galaxy interaction is affecting the thermodynamics and chemical properties of the ICM in the cluster core. The relatively low ICM temperature of this system, keV, makes it attractive for a study of this kind, because any X-ray signatures of the interaction are likely to be more pronounced than in much more massive clusters. Secondly, we also hope to shed light on the BCG formation process itself, e.g. by exploring whether the merging galaxies contain any hot (or cold) gas (i.e. whether the merger is dissipationless), and whether they show evidence for strong nuclear activity induced by the interaction.
We assume km s-1 Mpc-1, , and . The target redshift of then corresponds to a luminosity distance of Mpc, and on the sky to 67 kpc. We further adopt Solar abundances from Anders & Grevesse (1989), and a local Galactic Hi absorbing column of cm-2 (Dickey & Lockman, 1990). Unless otherwise stated, uncertainties are given at the 68% confidence level.
2. MZ 10451: A BCG IN FORMATION
As part of the XI Groups Survey (Rasmussen et al., 2006), we have obtained comprehensive multi-wavelength data for a sample of 25 groups and poor clusters. We are using XMM-Newton to study the X-ray properties of each system, and the IMACS multi-object spectrograph (Dressler et al., 2006) on the 6.5-m Baade/Magellan telescope at Las Campanas to determine group membership down to very faint luminosities (). In addition, we have obtained Spitzer/MIPS and GALEX UV imaging of each group field to probe the star formation properties of the group members. Details of the X-ray, optical, and infrared data reduction can be found in Rasmussen et al. (2006) and Bai et al. (2010), while the GALEX analysis will be described in a forthcoming paper (J. Rasmussen et al., in preparation). A summary of the X-ray, UV, and m data considered in the present paper is provided in Table 1.
| Instrument | Obs. ID | Obs. Date | |
|---|---|---|---|
| (yyyy-mm-dd) | |||
| Chandra ACIS-S | 10467 | 2008-11-14 | 18.78 ks |
| Chandra ACIS-S | 10800 | 2008-11-04 | 28.16 ks |
| Chandra ACIS-S | 10802 | 2008-11-16 | 31.62 ks |
| XMM pn | 0305800901 | 2006-01-20 | 14.99 ks |
| XMM MOS1 | … | … | 21.17 ks |
| XMM MOS2 | … | … | 21.21 ks |
| GALEX | GI4_052009 | 2008-09-27 | 1607 s |
| Spitzer MIPS | 22243840 | 2007-08-23 | 84 s |
One of the most X-ray luminous systems in the XI Survey so far is MZ 10451. Our optical spectroscopy of this system has identified 34 group members within the IMACS field-of-view, with a velocity dispersion km s-1. A search of the 2dF galaxy redshift catalog and the NED database reveals the presence of an additional 26 galaxies with concordant redshifts (within of the group mean) and within Mpc from the X-ray peak, some of which may represent group members infalling for the first time. For these 60 system members, we derive a mean redshift of and a velocity dispersion km s-1 (Bai et al., 2010). Table 2 summarizes relevant X-ray and optical properties of the system derived here and in Bai et al. (2010). Remarkably, while our XMM data show symmetrically distributed hot gas out to several hundred kpc (see Section 4), consistent with a virialized system, the core of the system is dominated by two optically luminous early-type galaxies, as shown in Figure 1. This central galaxy pair was previously noted by Arp & Madore (1987) in their catalog of southern peculiar galaxies. In the following, the optically brighter northern galaxy in the pair will be referred to as Galaxy A and its southern counterpart as Galaxy B.
| Value | Source | |
|---|---|---|
| Magellan/2dFGRS | ||
| 60 | Magellan/2dFGRS | |
| km s-1 | Magellan/2dFGRS | |
| 430 kpc | XMM | |
| erg s-1 | XMM | |
| keV | XMM | |
| kpc | XMM/Chandra | |
| kpc | XMM/Chandra | |
| kpc | XMM/Chandra | |
| M⊙ | XMM/Chandra | |
| M⊙ | XMM/Chandra | |
| M⊙ | XMM/Chandra |
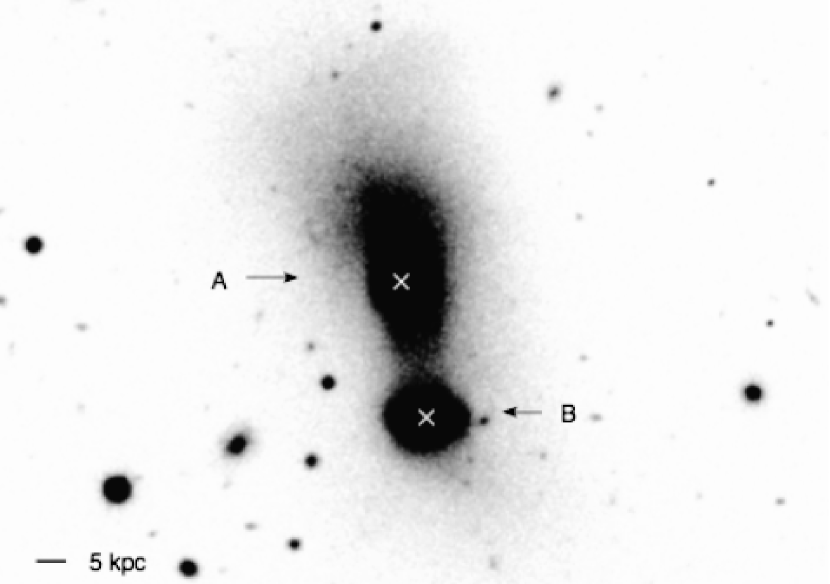
There is considerable evidence to suggest an ongoing merger between the two galaxies. Firstly, their optical centers are separated by only ( kpc) in projection, and their radial velocity offsets relative to the group mean are only 34 km s-1 (Galaxy A) and 2 km s-1 (B). This is well within the typical uncertainty in our IMACS redshift measurements of km s-1 (Rasmussen et al., 2006), demonstrating that, along the line of sight, both galaxies are consistent with being at rest relative to the group center. Secondly, both galaxies display morphological features consistent with an interaction. Most prominent is an extensive stellar plume that extends kpc northwards from the optical nucleus of Galaxy A. An extended stellar component is also visible around Galaxy B, as is a bright stellar bridge between the two objects.
3. OBSERVATIONS AND ANALYSIS
MZ 10451 was observed by Chandra in Very Faint telemetry mode for a total exposure of ks, with the ACIS-S3 CCD as aimpoint. Observations were split into three separate pointings, which were analyzed using ciao v4.1. To apply the newest calibration data and enable the suppression of background events afforded by the telemetry mode, new level 2 event files were generated. CTI corrections, time-dependent gain corrections, and standard grade filtering was applied. Lightcurves extracted for the S3 CCD in the 2.5–7 keV band revealed no evidence for background flares in any of the pointings, leaving a total effective exposure time of 78.56 ks. While the focus here is on the properties of the central group regions of MZ 10451 as seen by Chandra, we facilitate the analysis by including our XMM data where relevant. These data were prepared following the prescription outlined in Rasmussen et al. (2006).
The XMM data indicate detectable ICM emission out to at least from the X-ray peak (Section 4), implying that any methods involving local background estimation should be avoided for the analysis of diffuse emission in the Chandra S3 data. Employing the “blank-sky” background data in the Chandra calibration database for this purpose is also problematic, because the particle background component is now much more pronounced than at the time of these blank-sky observations (see, e.g., the discussion in Sun et al. 2009). We have verified this by extracting blanksky-subtracted source spectra in regions that are not source-dominated, revealing prominent excess emission even at keV, presumably from unsubtracted particles. Instead, we employed the 275-ks of ‘period E’ background data taken with the ACIS array in the stowed position, in which only non-X-ray events are recorded. These data can thus be used to estimate the particle contribution to the total background. The latest observation to be included in these data was performed just three months prior to our MZ 10451 observation and so should not display serious discrepancies with respect to the actual particle level in our data. Indeed, in the 9.5–12 keV band, the total flux ratio between source and stowed data exceeds unity by an acceptable 7–9% among our three pointings (compared to almost 60% for to blanksky data). The stowed data are scaled up by these small factors in our analysis.
In all spectral analysis, we subtracted the particle contribution using the stowed data, and modeled the remaining background components. The latter include the extragalactic X-ray background, whose spectrum can be well described by a power-law of photon index , and diffuse Galactic emission which is strongly spatially varying but can be described by a low-temperature thermal plasma model. Our XMM data were used to constrain the properties of these two components at the position of MZ 10451 as follows. Spectra were extracted for each EPIC camera in bins of net counts within a –10′ annulus of the X-ray peak. Energies keV were excluded, to suppress the particle-induced contribution including the instrumental fluorescence lines at –1.6 keV. The results were jointly fitted with a model consisting of a power-law subject to Galactic absorption plus an unabsorbed solar-abundance thermal plasma model. Free parameters were thus the power-law index , plasma temperature , and the normalization of the two components. The resulting fit, with for 72 degrees of freedom, yielded uncertainties on the best-fit values of and keV of only %. The pn spectrum and best-fit model are presented in Figure 2. We include this background model in all fits to the Chandra data. Leaving the relative normalization of the thermal and power-law components free to vary did not impact significantly on our results, so this ratio was fixed to that derived from the XMM fit, with only the overall background normalization remaining as a free parameter.

Source and stowed-background spectra and associated response products were extracted separately for each of the three Chandra pointings, with spectra accumulated in bins of net counts and jointly fitted in xspec v11.3. Whenever relevant, a similar approach was adopted for source and blanksky-background spectra extracted for each XMM camera.
In addition to the X-ray data, we also acquired optical long-slit spectroscopy of each of the merging galaxies, using the IMACS camera at the Baade/Magellan telescope in November 2009. The f/2 camera mode was used with the 300 lines mm-1 grism, giving a nominal wavelength range of 3900–10000 Å and a dispersion of 1.34 Å pixel-1. Each galaxy was observed for 30 min using a 0.9-arcsec wide slit (corresponding to a physical scale of 1 kpc at the group redshift). General details of the flat-fielding, bias- and sky-subtraction, and wavelength calibration can be found in Rasmussen et al. (2006).
4. RESULTS
4.1. Global and Radial ICM Properties
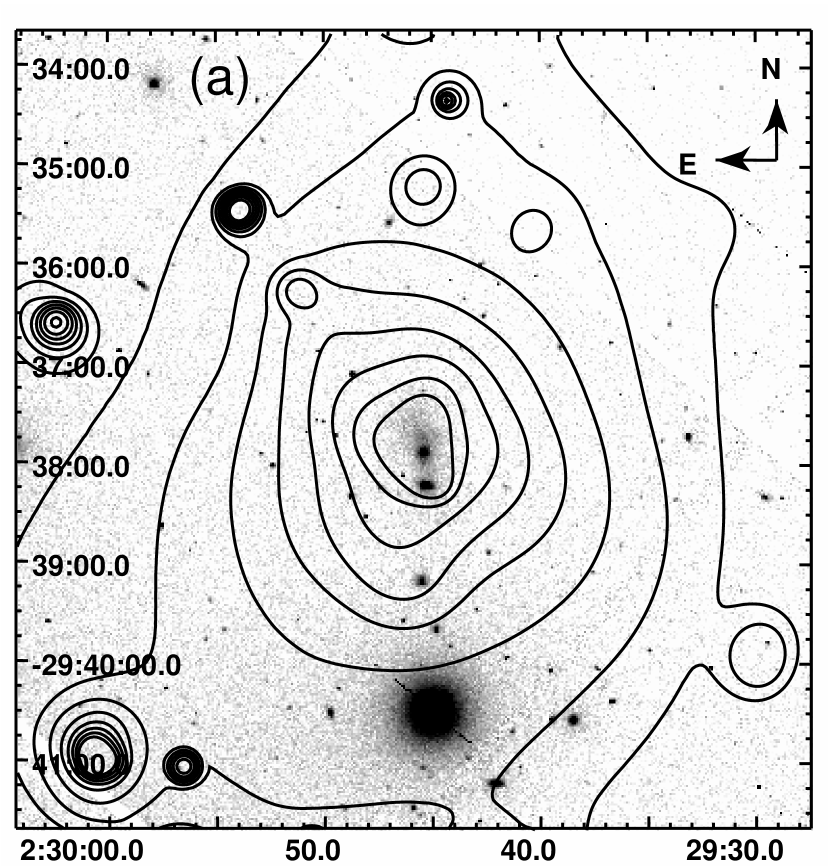
The large-scale morphology of the ICM in MZ 10451 is most easily discerned from our XMM data. Based on a particle-subtracted and exposure-corrected 0.3–2 keV EPIC mosaic image, Figure 3(a) shows adaptively smoothed XMM contours of the central arcmin ( Mpc2) region. The surface brightness distribution clearly exhibits a fairly symmetric morphology, consistent with the expectation for a virialized system. On the largest scales probed by XMM, there is an indication of the ICM distribution being slightly elongated in the north–south direction, roughly coinciding with the axis joining the two central galaxies.

Based on the same (unsmoothed) data, Figure 3(b) shows a radial surface brightness profile of the diffuse emission, extracted from the X-ray peak in bins containing a signal-to-noise ratio of S/N . Uncertainties in this plot contain a 10% systematic error associated with the subtraction of the XMM particle background, added in quadrature to all Poisson uncertainties. Emission is robustly detected out to at least arcsec ( kpc). A simple –model with provides a reasonable description of the profile across this radial range, with the exception of the very core which shows a slight excess of emission above the best-fit model. A thermal plasma model (APEC) fit to the global XMM spectrum within the full region covered in Figure 3(b) provides an acceptable fit, for 111 degrees of freedom, and would suggest keV and Z⊙. However, we note that this abundance measurement is plausibly biased low due to the likely presence of temperature variations across this large radial range (”Fe bias”; Buote 2000). The best-fit model would imply a 0.3–2 keV luminosity of erg s-1, with the bolometric value a factor of 1.8 higher.
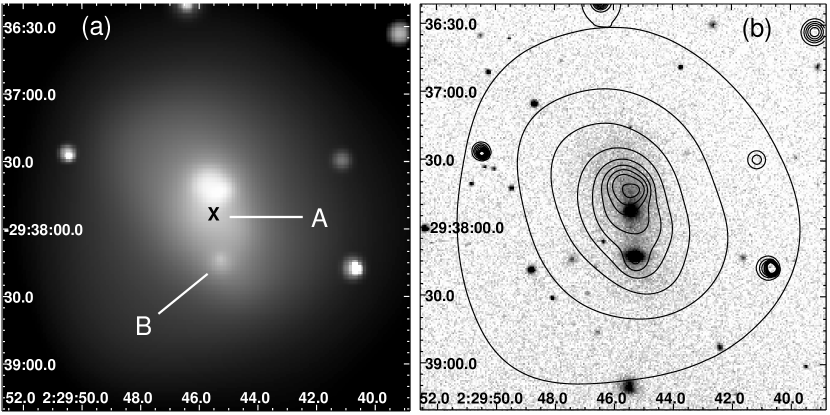
Subtracting the particle background as estimated from stowed data and excluding identified point sources, a total of 4,900 net counts (0.3–2 keV) from diffuse X-ray emission is detected on the Chandra S3 CCD, roughly a factor of four more than in the shallower XMM pn data of the same region. Figure 4 shows a particle-subtracted, exposure-corrected, and adaptively smoothed Chandra mosaic image of the central regions. Afforded by the superior spatial resolution of Chandra, these data clearly demonstrate that both central galaxies are offset from the peak of the diffuse X-ray emission at (, ) = (02, ), suggesting that neither galaxy is completely at rest at the center of the group gravitational potential. The X-ray morphology of the group core is quite regular, presenting little evidence that the ongoing galaxy interaction has yet had any profound impact on the central ICM density distribution. Also note that an emission component at the optical position of Galaxy B is clearly visible.
To test for radial variations in ICM temperature and abundance and search for ICM signatures of the ongoing merger, Chandra spectra were extracted in concentric annuli centered on the X-ray peak, each containing 1,000 counts from diffuse X-ray emission. These were fitted with an APEC model added to the X-ray background model described in Section 3. Deprojection was not attempted, as our XMM data show that the regions beyond the Chandra S3 CCD are not free of group emission. The resulting radial profiles of and are shown in Figure 5. Note that the X-ray peak is located east of the S3 CCD center, enabling coverage towards the western CCD corners to in Figure 5, although the angular coverage in the outermost radial bin is considerably less than 360 degrees.

The temperature profile reveals the presence of slightly cooler gas in the group core, showing a peak in the radial bin that extends from –1.3′ (–90 kpc) from the core. The central temperature drop may not be quite as pronounced as in typical cool-core groups, with the innermost sub-bin in Figure 5 nominally being only % cooler than the peak temperature (the drop is significant at the level). However, resolution effects could have an impact on this, given the higher redshift of this system compared to those of typical well-studied X-ray groups (see, e.g., Mulchaey et al. 2003). An orthogonal regression fit in –log space to the outermost four bins in Figure 5(a) yields for the slope outside the core, consistent with results for typical cool-core groups (Rasmussen & Ponman, 2007). We can therefore approximate the temperature profile as a piecewise log–linear function,
| (1) |
Similarly, the abundance profile can be approximated as constant at 0.3 solar outside the core, rising linearly in log –log space to its central value. These parametrizations are illustrated by the dashed lines in Figure 5.
While the temperature profile is thus typical of cool-core groups, the abundance profile is slightly unusual. Although showing the central peak of roughly solar abundance typical of such systems, the profile does not exhibit the steady radial decline seen in such groups but is instead consistent with being largely flat outside the core. Note also that the derived Chandra abundances are everywhere larger than suggested by the fit to the global XMM spectrum within this region, supporting the suspicion that the XMM estimate could be affected by the Fe bias arising from the presence of significant temperature variations. We also checked the Si/Fe ratio for the region encompassing the innermost two bins in Figure 5(b), using a VAPEC model fit. Although is poorly constrained, the ratio is found to be ZZFe,⊙ at significance, indicating an important contribution to central enrichment from type Ia supernovae and hence from an old stellar population.
Combining the XMM surface brightness profile, which is well constrained to large radii, with the parametrized Chandra temperature and abundance profiles (slightly smoothed to ensure a continuous behavior), profiles of deprojected gas density , entropy , cooling time, and total mass were determined. The latter was obtained via the assumption of hydrostatic equilibrium, as supported by the regular ICM morphology on large scales. The results are plotted in Figure 6. Uncertainties on each profile were obtained from 1,000 Monte Carlo realizations, for each of which all relevant parameters (, , , , and surface brightness normalization) were drawn from a Gaussian distribution centered at the measured or parametrized value and with 1- width equal to the typical 1- uncertainty on the relevant parameter. At each interpolated radius, we recorded the resultant outlier-resistant biweight mean and standard deviation. The latter represent the 1- error bounds shown in Figure 6. Errors on overdensity radii were evaluated from the mass profile using an analogous procedure.
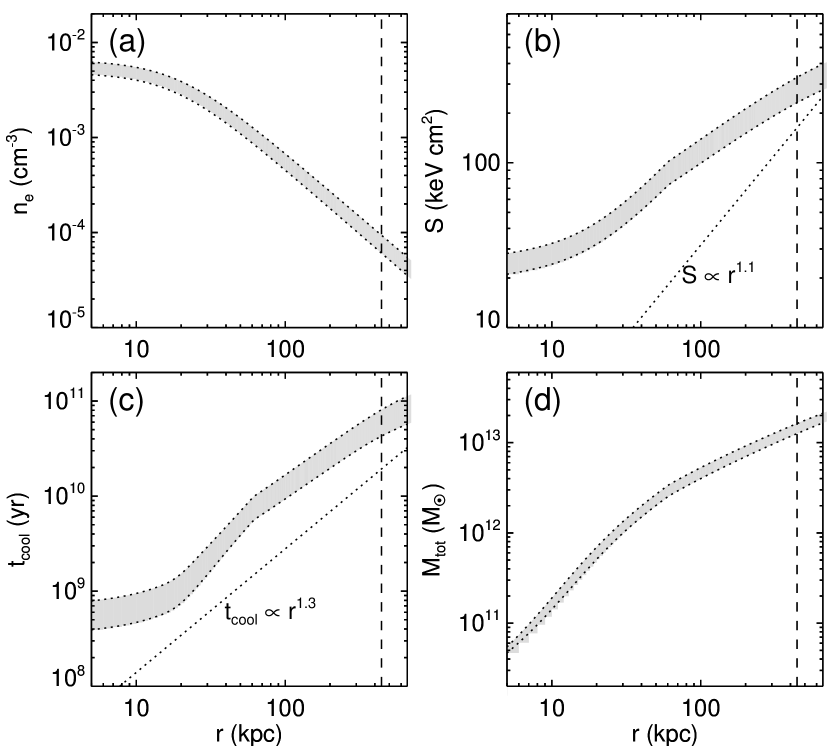
The entropy profile is fairly typical of cool-core groups, showing a continuous decline towards the center, and a logarithmic slope at large radii which is flatter than that expected from gravitational processes only (Johnson et al., 2009; Sun et al., 2009). The cooling time profile shows a central value of Gyr and a slope at large in good agreement with results for hotter systems (Sanderson et al., 2006). The derived mass profile implies a total mass of M⊙ within the radius of X-ray detection ( kpc), which is itself bracketed by the resulting values of kpc and kpc. The estimated virial radius in the adopted cosmology is kpc, enclosing an extrapolated mass of M⊙. Table 2 includes relevant quantities obtained from the mass profile.
4.2. 2-D ICM Maps and Spectroscopy
Although MZ 10451 is intrinsically fairly X-ray luminous, its considerable distance ( Mpc) still renders it too faint to allow spectral mapping at fine spatial detail with the present Chandra data. Hence, to further investigate the ICM properties in the group core and to identify regions of particular interest for spectral analysis, we first generated a hardness ratio map of the group core. For this, energy bands of 0.5–1 and 1–2 keV were chosen, in order to provide comparable number of counts in the ‘soft’ and ‘hard’ bands. We avoid the lowest energies, to reduce contamination from any patchy, soft Galactic emission. Mosaic images in each band were particle-subtracted and corrected for exposure variations, and results were smoothed using scales resulting from adaptively smoothing the corresponding full-band 0.5–2 keV image. The hard-band image was then divided by the soft-band one. For the temperatures and abundances seen in Figure 5, the hardness ratio map in these energy bands provides a useful proxy for spatial variations in ICM temperature along the line of sight (Finoguenov et al., 2006). Utilizing this, 2-D maps of projected pseudo-entropy and pressure were also constructed, based on and , where is the ICM emission measure. To generate these maps, a 0.5–2 keV image, smoothed on the same scales as , was taken as a proxy for (modulo metallicity variations), since at fixed metallicity Z⊙ (as seen outside the very core), the emissivity of a plasma varies by % for the range of temperatures in Figure 5 (Sutherland & Dopita, 1993). Nevertheless, caution should be exercised when interpreting these maps, due to the degeneracy with metallicity and the presence of statistical fluctuations.
The results are displayed in Figure 7, which shows the central region around the X-ray peak, corresponding to the region covered by the two innermost bins in Figure 5(b). The hardness ratio map in Figure 7(a) generally suggests fairly uniform hardness ratios on these spatial scales, but with some notable exceptions: The central regions display relatively soft emission, while a region of slightly harder emission is seen south of the group core. If interpreting these features as due to variations in ICM temperature, the results support the presence of slightly cooler gas in the group core on scales of 20–30 kpc, as already hinted at by Figure 5. Several of the detected point sources in this region also show emission which is considerably harder than that of the ICM, but, interestingly, this is less obviously so for the two central galaxies. The map also suggests the presence of a curved region of slightly hotter material immediately south of Galaxy B, referred to in Figure 7(a) and in the following as the southern “hotspot”.
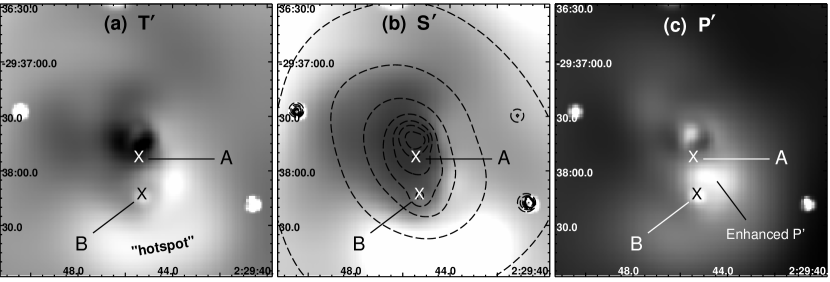
The entropy map in Figure 7(b) suggests the presence of a central region of relatively low-entropy gas, centered close to the X-ray peak. The entropy distribution generally appears fairly symmetric and reveals no prominent features around the two central galaxies. In particular, there is no clear indication of ongoing ISM stripping from either galaxy, e.g., in the form of irregularly distributed low-entropy material in their immediate vicinity. Note that the southern hotspot visible in the hardness ratio map also shows up in this diagram as a region of slightly enhanced ICM entropy.
The pressure map, Figure 7(c), indicates that ICM thermal pressure is generally declining outwards from the X-ray peak, as expected for hot gas in approximate hydrostatic equilibrium. However, the map also presents several potentially interesting features. One of these is a region of seemingly enhanced ICM pressure between the two galaxies, as marked in the Figure. No corresponding surface brightness enhancement is clearly seen (which could suggest a local enhancement in at fixed projected density), nor in entropy or hardness ratio. We also note that the X-ray peak seems to be surrounded by two small low-pressure regions, with no obvious counterparts in the surface brightness distribution (cf. Figure 4), but the available statistics do not allow a detailed investigation of their robustness or possible origin.
We can, however, test the robustness of the hotspot seen south of Galaxy B. For this, a spectrum was extracted in a rectangular region covering this feature and fitted with a thermal plasma model. Figure 8 outlines the spectral extraction regions discussed in the following. Within the region labelled “H” in the Figure, the derived temperature, keV, is indeed higher than that obtained for a comparable control region at similar distance north of the X-ray peak (region “C” in Figure 8), keV. Formally, these results differ at 1.5- significance, with the southern region being % hotter. We note that although the position of the temperature peak in Figure 5 is consistent with that of this region, results for the radial profile do not change significantly if excluding this region from the second radial bin in the profile; the presence of a peak in the temperature profile at this radius is therefore not simply due to the hotspot. We also note that the derived metallicity within this region, Z⊙, is fully consistent with the radial average at this distance from the X-ray peak, Z⊙. This implies that the presence of this feature is not simply due to strong local variations in ICM abundance.
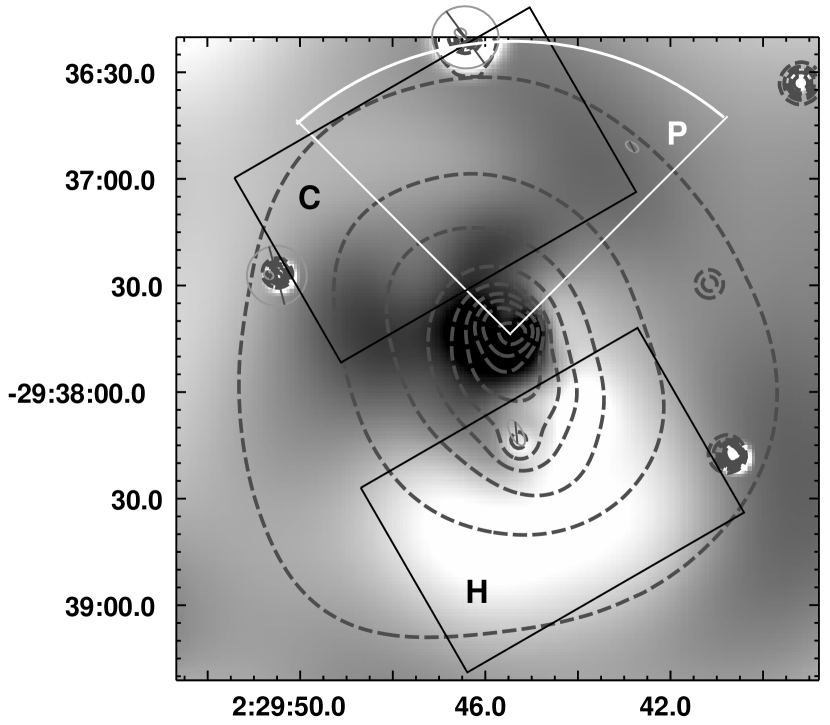
Another interesting question is how the ICM metallicity in the region covered by the stellar plume of Galaxy A compares to that of its immediate surroundings. This plume might represent tidally stripped material that could evolve into an intracluster light component. These stars would be able to chemically pollute the surrounding ICM very efficiently, as their ejecta would mix directly with the ICM without having to overcome the confining gravitational potential and gas pressure of their former host galaxy. To test this possibility, a spectrum was extracted in a wedge extending northwards from the X-ray peak (region “P” in Figure 8), with the minimum size of the region dictated by the need to get at least 500 counts as required for a rough measurement. Corresponding wedges extending to the east and west of the peak were employed as control regions. All regions had their apex centered on the X-ray peak rather than on Galaxy A itself, such that the metal-rich group core (cf. Figure 5) would be equally represented in all wedges and thus not bias the result for the northern wedge. For the N wedge, we find Z⊙, compared to Z⊙ for the combined E and W wedges. Hence, gas coinciding with the stellar plume does show significantly higher abundance than other regions at similar distance from the group core. This supports a scenario in which the central rise in the radial abundance profile has a significant contribution from highly enriched gas coinciding with this plume.
4.3. The Central Galaxy Pair
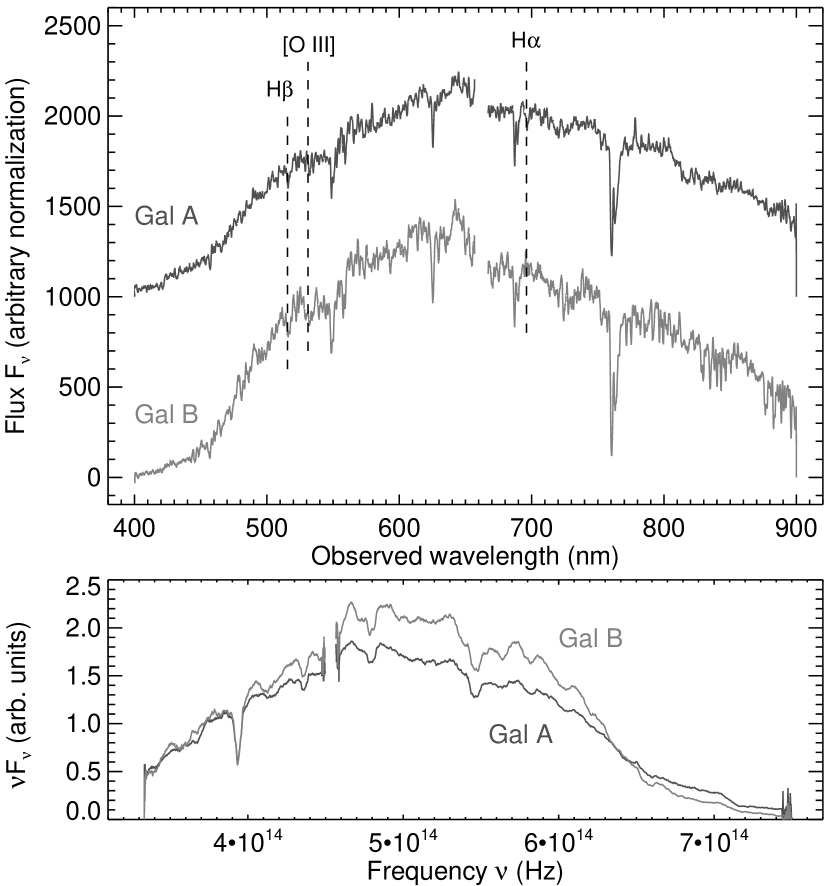
Turning now to the properties of the interacting galaxies, an important question is whether the galaxies have retained any hot gas, and whether the ongoing interaction has triggered significant starburst or active galactic nucleus (AGN) activity in either. Galaxy B is particularly interesting in this regard, because our Spitzer data reveal m emission from this galaxy (Bai et al., 2010). To explore these issues, we present Magellan optical spectra of both galaxies in Figure 9 (obtained with a slit width covering the central kpc of each galaxy), along with our near-UV and m data of the pair in Figure 10. The optical spectra appear remarkably similar, and neither shows clear evidence for bright emission lines typically associated with star formation or nuclear activity. This is in stark contrast to results showing that practically all (fully formed) BCGs close to the X-ray center in cool-core clusters display optical line emission (Edwards et al., 2007). Also note that the nucleus of Galaxy B is actually the brighter at most optical wavelengths, whereas that of Galaxy A dominates towards the near-UV as also confirmed by our GALEX data.
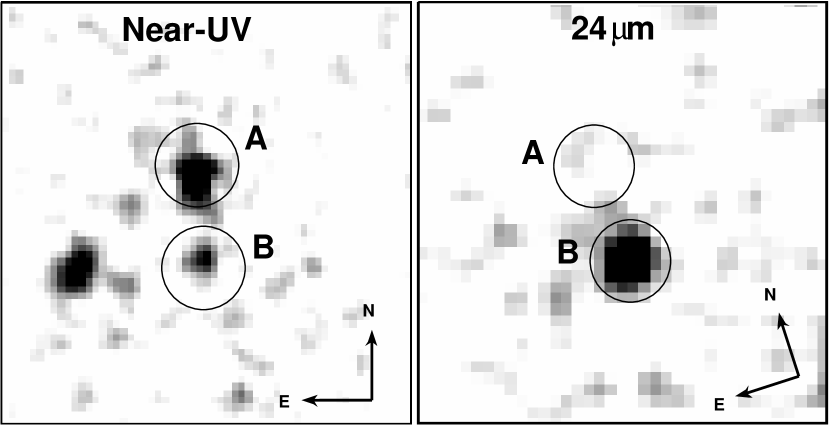
Given the lack of bright optical emission lines in Galaxy B, its m emission may be attributed to either obscured AGN activity or dusty star formation. In contrast, the optically brighter Galaxy A is not detected above significance at m. Nevertheless, extended emission from both galaxies is detected in the GALEX NUV band at significance. This may suggest the presence of some recent or ongoing low–level star formation, although the NUV– colors of 5.5 (Galaxy A) and 6.1 (B) would render both galaxies ”quiescent” by some definitions (e.g. Cortese et al. 2008). In addition, based on magnitudes from the 2dF survey, both galaxies have comparable optical colors of – (A) and (B), consistent with typical passive early-types. Neither galaxy is detected in the far-UV, implying FUV–NUV in either case, nor at m in our Spitzer data. They are also not detected at 1.4-GHz in NVSS radio data, which are 99% complete down to mJy (Condon et al., 1998), implying 1.4-GHz luminosities below W Hz-1. Finally, to estimate their stellar masses, we note that 2MASS isophotal photometry is available for Galaxy B only, implying L⊙ for this galaxy. If assuming a -band stellar mass-to-light ratio ML⊙, then ML⊙ for Galaxy B. Assuming a similar relationship for Galaxy A (see also Liu et al. 2009) yields the approximate stellar masses listed in Table 3 which summarizes some relevant properties of the two galaxies. Note that the stellar mass estimate for Galaxy A includes the diffuse stellar plume.
| Galaxy A | Galaxy B | |
| RA (J2000) | 02 | 02 |
| Dec (J2000) | ||
| (L⊙) | ||
| (L⊙) | ||
| 20.62 | 21.97 | |
| (erg s-1) | ||
| (W Hz-1) | ||
| (M⊙) |
Based on our wavelet-based 0.4–5 keV point source search, Galaxy A is not detected in the Chandra data, possibly due to its proximity to the central X-ray peak, whereas Galaxy B is clearly detected. This is true also if only considering a soft band (0.3–2 keV) source search, whereas none of the galaxies is detected at higher energies such as 2–8 keV. Galaxy B is not robustly detected in 2–8 keV XMM data either. All this immediately argues against significant moderately obscured AGN activity in either galaxy, and potentially also against the presence of a significant hot gas component in Galaxy A.
For Galaxy A, any X-ray surface brightness analysis is severely hampered by its proximity to the peak of the ICM emission to the north. If employing a 5– semi-annulus to the south as representative of the local background around the source, it is formally detected at above this background in 0.3–2 keV. This is below the significance threshold adopted for the adaptive smoothing in Figure 4, explaining its apparent absence in that figure. It is not detected in 1–3 keV however, implying a background-subtracted (1–3 keV)/ (0.5–1 keV) hardness ratio of at 90% confidence. This in turn implies for a power-law spectrum subject to Galactic absorption, or keV for a thermal plasma with Z⊙. This suggests that any emission from this source has properties inconsistent with those of a typical AGN spectrum, but leaves open the possibility of some contribution from hot gas. As further confirmation of the lack of substantial nuclear X-ray activity, we note that the 0.5–8 keV count rate within implies erg s-1 in this band for any intrinsically unobscured component. Furthermore, since still corresponds to a physical scale of kpc, this upper limit contains a contribution from non-nuclear emission. We also note that we do not detect any point sources in the stellar plume of this galaxy, down to a limiting 0.5–2 keV flux of erg cm-2 s-1 (for a spectrum). This implies that there are no clusters of X-ray binaries in the plume with a combined luminosity exceeding erg s-1, thus also ruling out the presence of any ultra-luminous X-ray sources in this region.
In contrast to the case of Galaxy A, there is a clear indication that the soft emission associated with the optically fainter Galaxy B is spatially extended in the Chandra data. Figure 11 shows a 0.3–2 keV surface brightness profile extracted from the optical galaxy center in bins of S/N . Emission is detected out to at above the local background, as evaluated in a surrounding – annulus. Both source and background regions excluded position angles of around the North, to suppress potential contamination from Galaxy A and from local variations in ICM emission. The inferred profile is clearly much broader than that of the keV Chandra point spread function (PSF) at this detector position as estimated using the mkpsf tool in ciao. A Kolmogorov–Smirnov test yields a probability of only that the two data sets have been drawn from the same distribution, and the source profile is well described by a –model with as is typical for extended emission from early-type galaxies (e.g., O’Sullivan et al. 2003).

At 95% confidence, a simple absorbed power-law fit to the spectrum of Galaxy B within would require (for spectral bins of 15 net counts, assuming standard statistics) or (assuming Cash statistics with bins of 5 net counts). In addition, the fit shows obvious positive residuals at keV, strongly suggestive of an Fe peak. These results are inconsistent with the expectation for emission dominated by an AGN or low-mass X-ray binaries (which both tend to show ), but suggest an important contribution from thermal gas. An APEC model with Galactic absorption returns a best-fit keV for fixed at 0.5 Z⊙, with erg s-1 (0.3–2 keV). For these parameters, the observed flux would imply a total hot gas mass of M⊙ within ( kpc).
Within of the optical center, the (2–8 keV)/ (0.5–2 keV) particle-subtracted hardness ratio of also suggests rather soft emission. This result is difficult to reconcile with the presence of an intrinsically bright but moderately obscured source, since any intrinsically obscured power-law source with should display a ratio of . With Galactic absorption only, the observed ratio would instead suggest ( at 1-), inconsistent with a typical AGN spectrum. The total 0.5–8 keV count rate within happens to be identical to that of Galaxy A, again implying erg s-1 for any intrinsically unobscured AGN. To escape Chandra detection in the 2–8 keV band, any AGN intrinsically brighter than erg s-1 with a spectrum must be subject to an intrinsic absorbing column in excess of cm-2, and the source would have to be Compton-thick ( cm-2) for all intrinsic luminosities erg-1.
In summary, Galaxy A which remains undetected at m shows little evidence for a substantial AGN component, unless sufficiently obscured to evade detection even at energies up to 8 keV. Even for the IR-detected Galaxy B, there is also no evidence for prominent nuclear X-ray activity below this energy. The lack of significant hard X-ray emission within the Chandra energy range in either object is also supported by the hardness ratio map, in which both galaxies appear softer than typical point sources in the field (some of which are likely associated with background AGN). Regarding any hot ISM material, tentative evidence for the presence of hot gas is found in Galaxy A, but we caution against strong conclusions in this case, given that this galaxy is superposed on very bright ICM emission. However, Galaxy B provides clear evidence for extended emission probably associated with hot “halo” gas. For its – color of 2.1 derived above, even extreme estimates of the discrete source contribution to the total in early-types of the resulting would suggest that % of its X-ray output is due to hot gas (O’Sullivan et al., 2001). Furthermore, its within the radius of detection would place it above, but within the scatter of, the relation between and for local early-types (O’Sullivan et al., 2001). The same applies when comparing it to the expectation from the relation between and thermal for early-types in groups as derived by Jeltema et al. (2008). These results are all consistent with the idea that Galaxy B contains significant amounts of hot diffuse gas.
5. DISCUSSION
The ICM X-ray luminosity and emission-weighted mean temperature derived from the XMM data, as listed in Table 2, would place MZ 10451 very close to the – relation for X-ray bright groups of Osmond & Ponman (2004). Combined with the regular X-ray morphology on both small and large scales, and the clear evidence for a cool core and a central metallicity excess seen in Figures 5 and 7, these features suggest a system with ICM properties very typical of those of relaxed X-ray bright groups and clusters.
Before addressing the impact of the central galaxy merger on the ICM, as well as the nature of the merger itself, it is useful to first assess the current stage of the interaction. It is not immediately clear from the present data whether the two galaxies have already experienced a first close passage. The pronounced tidal stream protruding northwards from Galaxy A might suggest so, but dedicated -body simulations of binary mergers (which we hope to employ in future work) would be needed to firmly establish under which orbital conditions this feature could arise. One argument against this possibility, however, is the observation of an extended thermal component associated with Galaxy B. It seems unlikely that a galactic hot gas halo would survive a direct passage of one galaxy through the other, especially since Galaxy B would then have approached from the north and so also have passed through the dense ICM core.
From the available information we can provide a rough estimate of the time-scale for nuclear coalescence. To this end, we apply the calibration of Kitzbichler & White (2008) based on the Millennium Simulation,
| (2) |
where is the stellar mass of the merger product and the current projected distance between the progenitors. Using M⊙ from the numbers in Table 3 along with kpc, one obtains Myr. Hence, the galaxies are likely still at least half a Gyr from coalescence, a number that is probably uncertain by at least a factor of two. Table 4 summarizes, in ascending order, this and other timescales discussed in the following.
| Timescale | Description | See |
|---|---|---|
| Myr | Timescale for dispersal of ICM pressure enhancement between Galaxy A and B | Section 5.1, Figure 7(c) |
| Myr | Age of southern hotspot if representing a weak shock front propagating from ICM core | Section 5.2, Figure 7(a) |
| Gyr | Central ICM cooling time | Section 5.1, Figure 6(c) |
| Gyr | Timescale for generation of central ICM metal excess by stellar plume of Galaxy A | Section 5.1 |
| Gyr | Timescale for nuclear coalescence of Galaxy A and B | Equation (2) |
| Gyr | Dynamical (free-fall) timescale at | Section 5.2 |
| Gyr | Time since last major group–group merger in MZ 10451 from X-ray isophotes | Section 5.2; Poole et al. (2006) |
| Gyr | ICM sound crossing time within | Section 5.2 |
| Gyr | Timescale for MZ 10451 to evolve into a “fossil group” | Equation (5) |
5.1. Impact of the Merger on the Group Environment
The regular X-ray morphology of MZ 10451, even in the central regions, suggests that the ongoing galaxy interaction has not had any major impact on the ICM so far. In particular, although the merger has significantly disrupted the stellar content near the center of MZ 10451, the system seems to have retained a cool core at this stage. The possible destruction of cool cores, or the prevention of them forming in the first place, is still poorly understood and widely debated in the literature (e.g., Burns et al. 2008; Leccardi et al. 2010). Our results suggest that central galaxy–galaxy mergers do not necessarily completely destroy cool cores through ICM heating or mixing, or that any such activity occurs closer to the final merger stages (when perhaps quasar-like activity is triggered in the case of gas-rich major mergers; cf. Hopkins et al. 2008). In partial support of the former possibility, we note that dynamical heating by galaxy motions alone generally seem insufficient to significantly disrupt cooling in cluster cores (Faltenbacher et al., 2005).
The situation in MZ 10451 is somewhat different from that in typical X-ray clusters where a fully formed BCG is already residing at the cluster center and potentially re-heating its surroundings via intermittent AGN activity. Nevertheless, the offset between Galaxy A and the X-ray peak is still small, kpc, and the central cooling time of Gyr is comparable to that of other cool-core systems at the relevant radii (Sanderson et al., 2006). This further supports the idea that any ICM mixing must have been modest in the very core of MZ 10451. This is also borne out by the entropy distribution; while enhanced central entropy compared to the case of typical cool-core systems could suggest a recent heating or mixing episode, we find the central entropy to be quite low, and close to the keV cm2 below which strong H and radio emission is typically seen in central BCGs (Cavagnolo et al., 2008), presumably as a result of ongoing star formation fueled by radiative cooling of ICM material.
Despite the apparent absence of strong ICM mixing, some features of the ICM thermodynamic properties may be linked to the ongoing interaction. Figure 7(c) indicates the presence of a region of enhanced ICM pressure between the two galaxies, with no obvious counterpart in the surface brightness or entropy maps. In the absence of external influences, this feature should disappear roughly on its sound crossing timescale, which is Myr for its estimated spatial extent of kpc. It is therefore likely to be associated with a very recent or ongoing event, plausibly reflecting ongoing adiabatic compression and heating of the ICM between the galaxies, induced by their relative motion.
It remains unclear, however, whether the tentative presence of an extended region of hot, high-entropy gas immediately south of Galaxy B is related to the interaction. The hardness ratio and entropy maps suggest that the extent of the structure is several tens of kpc even at its narrowest range. Thus, an explanation invoking a shock front generated by Galaxy B moving supersonically southwards seems excluded. Alternatively, this gas could represent high-entropy material ejected or stripped from either galaxy as a result of the interaction, but again, the sheer size of this feature makes this unlikely. There are insufficient counts in this region to test for departures from solar abundance ratios, thus precluding any direct tests for a possible origin in starburst outflows. However, such an explanation would be at odds with the lack of clear post-starburst features in the optical spectrum of either galaxy. It is possible that the feature is due to “sloshing” of the core gas owing to the gravitational perturbation to the group potential caused by the ongoing merger, although the absence of a similar feature in the surface brightness distribution may argue against this (Markevitch et al., 2001). Another possibility, discussed in more detail in the next Section, is that it is related to a larger-scale interaction between two sub-groups.
From the viewpoint of the ICM abundance distribution, Figure 5 shows that any merger–induced ICM enrichment is so far confined to the innermost kpc and so has had no large-scale impact on the ICM metal content. Nevertheless, the central abundance peak seen in this and many other systems could be partly related to processes associated with BCG formation. The observation of enhanced ICM abundances in the region covered by the stellar plume of Galaxy A may signify the presence of stripped, highly enriched ISM from this galaxy. This would suggest that central metal excesses could generally have a contribution from enriched gas shed by central BCG progenitors. In fact, the ICM mixing expected during such a merger may help to explain the considerable extent of the central abundance peak in many systems, thus alleviating the need for additional subsequent processes, such as AGN–driven turbulence (Rebusco et al., 2005), to disperse metals well beyond the optical extent of the central BCG.
An alternative explanation would associate the central abundance peak in MZ 10451 with in situ enrichment by stars tidally stripped during the interaction, some of which are likely to evolve into an intracluster light component. To assess the feasibility of this scenario, we first reiterate that the subsolar Si/Fe ratio seen in the central region implies an important contribution from SN Ia and hence from old stars, in line with results for fully formed BCGs in X-ray bright groups (Rasmussen & Ponman, 2009). This also indicates that central ICM enrichment from any young stellar population in the plume (or within the possibly star-forming Galaxy B) must be modest, in line with the apparent absence of the plume in our UV and m images in Figure 10. At the resolution of Figure 5, the elevated ICM abundance in the group core implies an excess Fe mass in the core of M⊙. Aperture photometry based on our Magellan -band image further suggests that of the stellar light of Galaxy A is located in this plume, indicating a plume stellar mass of M⊙ for ML⊙ as assumed in Section 4.3. Given these values, SN Ia in the plume could have provided the central Fe excess on a timescale of just Gyr, estimated using the approach of Rasmussen & Ponman (2009) and excluding any contribution from SN II or stellar winds. Thus, it seems entirely feasible for intracluster light generated by the merger to have produced the central Fe excess. Forthcoming Hubble Space Telescope (HST) imaging of MZ 10451 will be used to provide more reliable mass and age estimates of the stripped stellar component of Galaxy A and further test the viability of this picture.
5.2. A Group–Group Merger? Gas and Galaxy Dynamics in MZ 10451
The relatively undisturbed appearance of the ICM suggests that the central BCG merger does not result as a consequence of a recent larger-scale merger between separate subgroups. Idealized hydrodynamical simulations of major cluster–cluster mergers with a range of progenitor mass ratios and impact parameters suggest that the timescale for a merged system to appear relaxed, as judged visually from the morphology of its X-ray isophotes, is Gyr from the time at which the gas core of the secondary merges with that of the primary (Poole et al., 2006). For MZ 10451 specifically, we note that the ICM appears regular on the scales of Figure 3, i.e. out to at least kpc. The ICM should relax roughly on a sound crossing time . Using Equation (1) to evaluate the local sound speed at all gives Gyr within kpc, and Gyr within kpc, in broad agreement with the general expectation from the above simulations. This confirms that any major group–group merger in MZ 10451 cannot have taken place very recently.
However, it may still be premature to entirely dismiss the possibility of such a merger, partly because the observed entropy enhancement to the south of the group core is not easily explained by a galaxy–galaxy interaction alone, and partly because the ICM may have relaxed more rapidly than the galaxies. We note that the entropy feature is not seen in the surface brightness distribution of Figure 4, is not particularly sharply defined in the entropy and temperature maps of Figure 7, and has higher temperature and entropy than its surroundings. It is therefore unlikely to represent a cold front (Markevitch et al., 2001) resulting from a subgroup penetrating the group core, or a remnant cool core of such a subgroup.
Nevertheless, it is still conceivable that the feature represents a weak, merger-generated shock front, possibly viewed at some oblique angle. If so, a lower limit to its age of Myr can be estimated from its current projected distance to the X-ray core of kpc, assuming propagation from the core at a velocity comparable to the local sound speed. One might have expected a similar feature to the north of the group core, but projection effects could be rendering this undetectable. In addition, simulations of cluster–cluster mergers (Poole et al., 2006; McCarthy et al., 2007) suggest that such central entropy asymmetries, including the curved appearance of the region in Figure 7, can arise as a consequence of shock heating in cluster mergers when the progenitor mass ratio differs substantially from unity ( 3:1). We note that dissipation of turbulent energy injected by such a shock could easily account for the observed entropy enhancement. The mean ICM density at the approximate radial distance of this feature is cm-3; for a cylindrical volume of length and base diameter (assuming a depth along the line of sight equal to the “width” of the feature), the total gas mass is then M⊙ within this region. The energy required to raise of this gas by keV, as suggested by our spectral analysis, is erg. This is three orders of magnitude below what can be provided by shocks generated by a major group–group merger producing a system of the relevant virial mass (Paul et al., 2010), so energetically it seems entirely feasible to produce this feature through shocks associated with an infalling subgroup.
Hence, the observed north–south entropy asymmetry could conceivably result from the aftermath of a group–group merger, with Galaxy A and B representing the central galaxies of the two progenitor groups. It is, in fact, possible that Galaxy A was initially at rest at the X-ray peak of the more massive subgroup but has now been slightly displaced as a result of the final central galaxy–galaxy interaction. There are arguments both for and against this interpretation. On the one hand, the estimated time since the last major merger in MZ 10451 of Gyr, as discussed above, is larger than both the dynamical (free-fall) timescale at of Gyr and the current estimated timescale for nuclear coalescence between Galaxy A and B (cf. Table 4). Hence, if each galaxy represented the central galaxy of a progenitor system, it is perhaps surprising that they have not yet themselves merged. On the other hand, we note that the galaxy velocity distribution in MZ 10451 does appear bimodal, with the velocity histogram of the group members, shown in Figure 12(a), revealing a smaller, receding peak relative to the system mean (containing 12 of the 60 confirmed group members; Bai et al. 2010).

As also illustrated in Figure 12(a), the spatial distribution of galaxies in the group provides no clear indication that infall of a subgroup, let alone a group–group major merger, has recently taken place. To test this possibility in more detail and search for evidence of kinematic substructure in the system, we performed a Dressler–Shectman test (Dressler & Shectman, 1988). For each galaxy with radial velocity , we recorded the local kinematic deviation from the global mean velocity and velocity dispersion ,
| (3) |
using and derived including its 10 nearest neighbors. We also recorded the cumulative deviation ,
| (4) |
calibrating this result against 10,000 Monte Carlo simulations in which all galaxy velocities were randomly shuffled. The latter step provides an estimate of the probability of obtaining the observed galaxy position–velocity configuration in the presence of purely random substructure. We find %, regardless of whether all 60 members or only the 19 covered by the detectable X-ray emission are included in the calculation. The results for are illustrated in Figure 12(b) and suggest the presence of some non-random kinematic substructure in MZ 10451, both globally and in the central X-ray bright regions.
Thus, the observed galaxy kinematics seem consistent with the idea that infall of a smaller subgroup (possibly hosting Galaxy B as the central galaxy) has taken place. We also note that the estimated timescales for several of the features in Figures 5 and 7 to arise or survive (the cool core, central metal excess, southern hotspot, and pressure enhancement between Galaxy A and B) are all consistent with being lower than the likely time since such a merger (Table 4), so their presence seems compatible with this possibility. However, we stress that this interpretation must be regarded as tentative, is not without its problems, and that more robust tests of the group–group merger scenario would require detailed spectral mapping of the group core and hence deeper X-ray observations.
5.3. The Nature of the Galaxy Merger: Implications for BCG Formation
In the -band, the two central galaxies show a luminosity ratio of 2:1, with the brighter Galaxy A having a luminosity comparable to an galaxy (Zabludoff & Mulchaey, 2000). They currently represent the first and fifth-ranked group members within the derived virial radius of Mpc, although brighter galaxies with concordant redshifts are present within from the X-ray peak. However, the combined -band luminosity of the central pair, L⊙, is % larger than that of any of those galaxies within this radius. Hence, the merger will comfortably produce the brightest galaxy within the group, thus confirming it as a BCG major merger.
Recent Chandra observations show that most luminous early-type galaxies maintain thermal X-ray halos even near the centers of groups and rich clusters (Sun et al., 2007; Jeltema et al., 2008). For example, excluding central BCGs, Jeltema et al. (2008) found that % of early-type galaxies in groups with L⊙ retain a hot gas halo. Both our galaxies have comparable to this limit (Section 4.3). The presence of extended thermal emission associated with Galaxy B indicates that it, too, possesses a hot halo, suggesting that such halos may be preserved at least at this merger stage. In the case of Galaxy A, no such halo is unambiguously detected, so it remains a possibility that any extended halo of this galaxy has been largely disrupted, since this galaxy also appears particularly disturbed in the optical. We should note, however, that we do not have the S/N or spatial resolution to directly establish whether either galaxy shows current evidence for hot gas stripping, although the pseudo-entropy map (Figure 7) suggests that any such activity must be modest.
It is commonly assumed, as also suggested by numerical simulations, that the nature of low-redshift major mergers leading to bright, early-type BCGs is largely dissipationless, involving progenitors containing little or no gas (e.g., Khochfar & Burkert 2003; Boylan-Kolchin et al. 2006; De Lucia & Blaizot 2007). Based on observed stellar rotational velocities in nearby BCGs, some likely counterexamples do exist however, although these seem rather rare (Loubser et al., 2008). It is therefore of interest to establish to what extent either of the merging galaxies in MZ 10451 is experiencing active star formation fueled by a reservoir of cold gas.
In the case of Galaxy A, the observed NUV flux would suggest weak star formation at a level of M⊙ yr-1, but no IR emission is accompanying the UV output down to our approximate detection limit of 0.1 M⊙ yr-1 (Bai et al., 2010). In addition, its FUV–NUV color of is consistent with that seen for the majority of passively evolving ellipticals (Gil de Paz et al., 2007), suggesting that the UV light may be dominated by that of an evolved stellar population.
While this latter point remains true also for Galaxy B, this case is nevertheless more ambiguous. The galaxy is detected at 24 m, but there is no clear evidence for optical emission lines or nuclear X-ray activity. Any AGN responsible for the 24 m emission must thus be subject to strong intrinsic obscuration, with an absorbing column exceeding cm-2 for typical AGN X-ray luminosities. Examples of such highly obscured AGN do occur at low redshift (see, e.g., Comastri 2004), including, as is the case for Galaxy B, galaxies that do not show any Seyfert signatures in the optical band. Alternatively, the infrared emission may instead be powered by dusty star formation, implying that the galaxy also retains some cold gas. If so, the observed 24 m flux would suggest low-level star formation at a rate of M⊙ yr-1, computed using the prescription in Bai et al. (2010) which takes into account the contribution from cold dust heated by an evolved stellar population. If attributed to young stars, the GALEX NUV flux would instead suggest a rate of M⊙ yr-1 based on the Kennicutt (1998) relation and before correction for dust attenuation. This is consistent with the idea that some obscured star formation activity is taking place, supporting the notion of a cold gas reservoir in Galaxy B. Unfortunately, the absence of a robust Spitzer detection of either galaxy at 70 m implies that we cannot use the 24/70 m flux ratio to distinguish between star formation and AGN activity. Furthermore, the available NVSS radio data of the galaxy pair are not deep enough to provide useful constraints in this regard. The radio luminosity limits are well below a commonly adopted dividing line between starburst galaxies and radio-loud AGN of W Hz-1 (e.g., Yun et al. 2001), but while the limit on the parameter for Galaxy B, , is consistent with that of star-forming galaxies (e.g., Appleton et al. 2004), it does not rule out a contribution from AGN activity to the 24 m emission.
Deep Hi or CO observations would thus be needed to decisively test for the presence of a cold gas reservoir in Galaxy B. While such data will eventually be provided by the upcoming WALLABY survey111http://www.atnf.csiro.au/people/bkoribal/askap/ to be undertaken by the Australian SKA Pathfinder array, we simply note here that the tentative evidence for obscured star formation within Galaxy B points to an early-type major merger which does involve some gas, with the implication that at least some low-redshift BCG major mergers must be dissipational to some degree. Coupled with the absence of pronounced nuclear activity in either galaxy, this result is consistent with a picture in which the early stages of interactions between early-type galaxies first trigger residual star formation, followed by efficient central inflow of gas leading to strong AGN activity at the final stages (e.g., Rogers et al. 2009).
If identifying the peak of diffuse X-ray emission with the center of the group gravitational potential, our results also suggest that BCGs may form very close to the latter. This is consistent with a picture in which central BCGs have been built up through a series of mergers near cluster cores, in line with the galactic cannibalism scenario for BCG growth discussed by Ostriker & Hausman (1977). As mentioned, it is possible that Galaxy A was initially at rest at the position of the X-ray peak but has now been slightly displaced as a result of the ongoing interaction. Furthermore, our radial velocity measurements and the fact that the merging pair and the X-ray peak are all aligned, indicate that the motion of the galaxies occurs largely in radial orbits along a north-south axis, coinciding with the direction defined by the stellar plume of Galaxy A. At the same time, the large-scale X-ray morphology seen in Figure 3 implies an overall ICM elongation along a similar axis. If the elongation of the ICM betrays the orientation of the filaments feeding the cluster, then the merging galaxies and their ”parent” filaments line up. This is consistent with expectations from simulations, which suggest that the mergers forming central BCGs occur preferentially along radial orbits aligned with the filaments feeding the host cluster, and thus with the major axis of the cluster itself (West 1994; Boylan-Kolchin et al. 2006 and references therein).
5.4. Properties of the Merger Product
As a final point, it is interesting to also consider the likely properties of the merger product, in terms of the nature of the merged central galaxy and of the group as a whole. As mentioned, the estimated -band luminosity of the merged galaxy would be L⊙. Using from Table 2, we can compare this to the expectation based on the observed low-redshift correlations between BCG -band luminosity and of the host cluster derived by Lin & Mohr (2004) and Brough et al. (2008). Either of these relations would suggest L⊙ for a BCG in a group of this mass, in excellent agreement with the above estimate. While some of the stellar mass of the BCG progenitors will be tidally stripped in the merging process and thus will not contribute directly to (Stanghellini et al., 2006), it seems likely that MZ 10451 in the post-merger phase would thus have properties in good agreement with the observed – relations, particularly in light of the very considerable scatter around these relations at low values of .
The tidally stripped stars seen around both merging galaxies may become unbound during the interaction and would then contribute to the emergence of an intracluster light component. This possibility will be investigated in more detail in a future paper based on our forthcoming HST imaging of this system. However, we note for now that our existing imaging of MZ 10451 seems consistent with the notion that an intracluster light component can form in systems which do not already have a central dominant early-type galaxy. Such a scenario draws support from cosmological simulations which suggest that major mergers associated with BCG formation play a prominent, and possibly dominant, role in the generation of intracluster light (Murante et al., 2007).
It is also interesting to note that MZ 10451 would not become a “fossil group” as a consequence of the merger, if adopting the definition of Jones et al. (2003). Although the X-ray luminosity criterion, erg s-1, is already safely met, the combined magnitude of the merger product of would be only mag brighter than that of the subsequently second-brightest galaxy within kpc, thus falling short of the gap between the first- and second-ranked galaxy required to meet the above definition of a fossil system. This remains true even if just considering the region within kpc, for which would be mag.
Taking this argument even further, we note that any subsequent merger between the forming central galaxy and the resulting brightest satellite galaxy within a projected distance of (with M⊙) would create an -band magnitude gap of (). This satellite currently has a radial velocity km s-1 relative to the group mean and so is likely to be in a low-eccentricity orbit. Under these circumstances, dynamical friction acting on this galaxy could accomplish such a merger on a time-scale of
| (5) |
where and is the current orbital radius and circular velocity of the satellite, respectively, and the characteristic circular velocity of its dark matter halo (D’Onghia et al., 2005). A lower limit to is the projected distance of the satellite from the X-ray peak of kpc. Taking and assuming an -band total mass-to-light ratio of 10 for the satellite (a spiral), along with the assumption of an isothermal sphere mass distribution for its halo, we have km s-1. With these numbers, equation (5) would predict a time-scale Gyr, with equality corresponding to . Thus, even following the ongoing central merger, MZ 10451 would be resilient to the formation of a fossil-like configuration by means of dynamical friction for many Hubble times. This is consistent with the notion that present-day fossil systems are unlikely to have formed recently (e.g., Khosroshahi et al. 2007).
6. SUMMARY AND CONCLUSIONS
The low-mass cluster MZ 10451 is, to our knowledge, a unique system. It is X-ray bright, harbors a central BCG currently being formed from the major merger of two optically luminous early-type galaxies, and resides at a distance where the nature of the BCG merger and its impact on the surrounding ICM can be studied in unprecedented detail. We have combined Chandra observations of the ICM in the cluster core with XMM data of the large-scale ICM properties, and with optical, infrared, and UV data of the merging galaxies, to explore the impact of the interaction on the ICM and on the interacting galaxies themselves.
The data indicate detectable ICM emission out to at least , centered close to the two interacting galaxies. The ICM surface brightness in MZ 10451 is symmetrically distributed on both small and large scales, consistent with the expectation for a virialized system. Hence, the ongoing central galaxy–galaxy interaction has not significantly disturbed the ICM density distribution even in the group core. On the largest scales, the ICM distribution is elongated in the north-south direction, however.
The ICM exhibits a cool core and a central metal excess (here extending to kpc), as typically seen in undisturbed X-ray bright systems with a central BCG. This implies either that cool cores and central abundance peaks are not necessarily destroyed by central galaxy–galaxy mergers in clusters, or that any significant central ICM heating and mixing takes place at post-coalescence stages.
The brighter of the merging galaxies presents a pronounced plume of tidally stripped stars. The ICM metallicity in the region covered by this feature is significantly enhanced. This suggests efficient local enrichment by intracluster stars ejected by the interaction, or merger-induced stripping of highly enriched gas from either galaxy. Such processes may thus have contributed to building up the pronounced central abundance peak seen in this and other systems. Some of the tidally stripped stars may represent the emergence of an intracluster light component, suggesting that such a component can form in systems that do not already host a central dominant galaxy.
Both the merging galaxies are spatially offset from the ICM X-ray peak, but only by and kpc, and their radial velocities are both consistent with the group mean within the errors. This demonstrates that central BCG formation can occur close to the center of the cluster potential, consistent with the notion that central BCGs are built up through a series of mergers in cluster cores.
The merger axis extends toward the X-ray peak and roughly coincides with the axis defined by the large-scale elongation of the ICM. Combined with the above, this provides support for a picture in which BCG mergers are caused by galaxies falling along radial orbits aligned with the accreting filaments that feed cluster growth.
A rough estimate based on their current separation suggest that the interacting galaxies are still Gyr from nuclear coalescence. Despite being involved in a galaxy–galaxy interaction in the core of an X-ray bright system, at least one of the merging galaxies shows clear evidence of having retained an extended hot gas halo at this stage. The inferred infrared, UV, and X-ray properties of the galaxy pair are consistent with the presence of low-level obscured star formation in at least one of them. This would be consistent with a picture in which early-type galaxy interactions initially trigger residual star formation, followed by an AGN-dominated phase closer to coalescence. The tentative evidence for ongoing star formation in one of the merging galaxies suggests that low-redshift BCG major mergers need not be completely dissipationless. However, while the X-ray data reveal no evidence for strong moderately obscured AGN activity in either galaxy, the possibility of an AGN hidden behind a Compton-thick screen cannot be ruled out as an alternative to the presence of cold gas. Deeper radio observations would be required to decisively settle this issue.
Our forthcoming HST observations of MZ 10451 should further elucidate the optical properties of the central merging galaxies, and thus help constrain the properties of the merger product itself. These data will also help in establishing the age of tidally stripped stars, and the generation and properties of any intracluster light in this unusual system. A detailed analysis of these and our Magellan optical data will be presented in a forthcoming paper.
References
- Anders & Grevesse (1989) Anders, E., & Grevesse, N. 1989, Geochim. Cosmochim. Acta, 53, 197
- Appleton et al. (2004) Appleton, P. N., et al. 2004, ApJS, 154, 147
- Arp & Madore (1987) Arp, H. C., & Madore, B. F. 1987, A Catalogue of Southern Peculiar Galaxies and Associations 2 volume set, Cambridge University Press, Cambridge, UK
- Bai et al. (2010) Bai, L., Rasmussen, J., Mulchaey, J. S., Dariush, A., Raychaudhury, S., & Ponman, T. J. 2010, ApJ, 713, 637
- Best et al. (2007) Best, P. N., von der Linden, A., Kauffmann, G., Heckman, T. M., & Kaiser, C. R. 2007, MNRAS, 379, 894
- Binggeli (1982) Binggeli, B. 1982, A&A, 107, 338
- Boylan-Kolchin et al. (2006) Boylan-Kolchin, M., Ma, C.-P., & Quataert, E. 2006, MNRAS, 369, 1081
- Brough et al. (2008) Brough, S., Couch, W. J., Collins, C. A., Jarrett, T., Burke, D. J., & Mann, R. G. 2008, MNRAS, 385, L103
- Buote (2000) Buote, D. A. 2000, MNRAS, 311, 176
- Burns et al. (2008) Burns, J. O., Hallman, E. J., Gantner, B., Motl, P. M., & Norman, M. L. 2008, ApJ, 675, 1125
- Cavagnolo et al. (2008) Cavagnolo, K. W., Donahue, M., Voit, G. M., & Sun, M. 2008, ApJ, 683, L107
- Comastri (2004) Comastri, A. 2004, in Astrophysics and Space Science Library Vol. 308, Supermassive Black Holes in the Distant Universe, ed. A. J. Barger (Dordrecht: Kluwer), 245
- Condon et al. (1998) Condon, J. J., Cotton, W. D., Greisen, E. W., Yin, Q. F., Perley, R. A., Taylor, G. B., & Broderick, J. J. 1998, AJ, 115, 1693
- Conroy et al. (2007) Conroy, C., Wechsler, R. H., & Kravtsov, A. V. 2007, ApJ, 668, 826
- Cortese et al. (2008) Cortese, L., Gavazzi, G., & Boselli, A. 2008, MNRAS, 390, 1282
- Coziol et al. (2009) Coziol, R., Andernach, H., Caretta, C. A., Alamo-Martínez, K. A., & Tago, E. 2009, AJ, 137, 4795
- De Grandi et al. (2004) De Grandi, S., Ettori, S., Longhetti, M., & Molendi, S. 2004, A&A, 419, 7
- De Lucia & Blaizot (2007) De Lucia, G., & Blaizot, J. 2007, MNRAS, 375, 2
- Dickey & Lockman (1990) Dickey, J. M., & Lockman, F. J. 1990, ARA&A, 28, 215
- D’Onghia et al. (2005) D’Onghia, E., Sommer-Larsen, J., Romeo, A. D., Burkert, A., Pedersen, K., Portinari, L., & Rasmussen, J. 2005, ApJ, 630, L109
- Dressler & Shectman (1988) Dressler, A., & Shectman, S. A. 1988, AJ, 95, 985
- Dressler et al. (2006) Dressler, A., Hare, T., Bigelow, B. C., & Osip, D. J. 2006, Proc. SPIE, 6269
- Dubinski (1998) Dubinski, J. 1998, ApJ, 502, 141
- Edge & Stewart (1991) Edge, A. C., & Stewart, G. C. 1991, MNRAS, 252, 428
- Edwards et al. (2007) Edwards, L. O. V., Hudson, M. J., Balogh, M. L., & Smith, R. J. 2007, MNRAS, 379, 100
- Faltenbacher et al. (2005) Faltenbacher, A., Kravtsov, A. V., Nagai, D., & Gottlöber, S. 2005, MNRAS, 358, 139
- Finoguenov et al. (2000) Finoguenov, A., David, L. P., & Ponman, T. J. 2000, ApJ, 544, 188
- Finoguenov et al. (2006) Finoguenov, A., Davis, D. S., Zimer, M., & Mulchaey, J. S. 2006, ApJ, 646, 143
- Fuller et al. (1999) Fuller, T. M., West, M. J., & Bridges, T. J. 1999, ApJ, 519, 22
- Gil de Paz et al. (2007) Gil de Paz, A., et al. 2007, ApJS, 173, 185
- Gonzalez et al. (2003) Gonzalez, A. H., Zabludoff, A. I., & Zaritsky, D. 2003, Ap&SS, 285, 67
- Gregorini et al. (1992) Gregorini, L., Vettolani, G., de Ruiter, H. R., & Parma, P. 1992, A&AS, 95, 1
- Hansen et al. (2009) Hansen, S. M., Sheldon, E. S., Wechsler, R. H., & Koester, B. P. 2009, ApJ, 699, 1333
- Hashimoto et al. (2008) Hashimoto, Y., Henry, J. P., & Böhringer, H. 2008, MNRAS, 390, 1562
- Hopkins et al. (2008) Hopkins, P. F., Hernquist, L., Cox, T. J., & Kereš, D. 2008, ApJS, 175, 356
- Jeltema et al. (2008) Jeltema, T. E., Binder, B., & Mulchaey, J. S. 2008, ApJ, 679, 1162
- Jeltema et al. (2007) Jeltema, T. E., Mulchaey, J. S., Lubin, L. M., & Fassnacht, C. D. 2007, ApJ, 658, 865
- Johnson et al. (2009) Johnson, R., Ponman, T. J., & Finoguenov, A. 2009, MNRAS, 395, 1287
- Jones & Forman (1984) Jones, C., & Forman, W. 1984, ApJ, 276, 38
- Jones et al. (2003) Jones, L. R., Ponman, T. J., Horton, A., Babul, A., Ebeling, H., & Burke, D. J. 2003, MNRAS, 343, 627
- Kennicutt (1998) Kennicutt, R. C., Jr. 1998, ARA&A, 36, 189
- Khochfar & Burkert (2003) Khochfar, S., & Burkert, A. 2003, ApJ, 597, L117
- Khosroshahi et al. (2007) Khosroshahi, H. G., Ponman, T. J., & Jones, L. R. 2007, MNRAS, 377, 595
- Kitzbichler & White (2008) Kitzbichler, M. G., & White, S. D. M. 2008, MNRAS, 391, 1489
- Lauer (1988) Lauer, T. R. 1988, ApJ, 325, 49
- Leccardi & Molendi (2008) Leccardi, A., & Molendi, S. 2008, A&A, 487, 461
- Leccardi et al. (2010) Leccardi, A., Rossetti, M., & Molendi, S. 2010, A&A, 510, A82
- Lin & Mohr (2004) Lin, Y.-T., & Mohr, J. J. 2004, ApJ, 617, 879
- Liu et al. (2009) Liu, F. S., Mao, S., Deng, Z. G., Xia, X. Y., & Wen, Z. L. 2009, MNRAS, 396, 2003
- Loubser et al. (2008) Loubser, S. I., Sansom, A. E., Sánchez-Blázquez, P., Soechting, I. K., & Bromage, G. E. 2008, MNRAS, 391, 1009
- McCarthy et al. (2007) McCarthy, I. G., et al. 2007, MNRAS, 376, 497
- McIntosh et al. (2008) McIntosh, D. H., Guo, Y., Hertzberg, J., Katz, N., Mo, H. J., van den Bosch, F. C., & Yang, X. 2008, MNRAS, 388, 1537
- Markevitch et al. (2001) Markevitch, M., Vikhlinin, A., & Mazzotta, P. 2001, ApJ, 562, L153
- Mittal et al. (2009) Mittal, R., Hudson, D. S., Reiprich, T. H., & Clarke, T. 2009, A&A, 501, 835
- Mulchaey et al. (2003) Mulchaey, J. S., Davis, D. S., Mushotzky, R. F., & Burstein, D. 2003, ApJS, 145, 39
- Mulchaey et al. (2006) Mulchaey, J. S., Lubin, L. M., Fassnacht, C., Rosati, P., & Jeltema, T. E. 2006, ApJ, 646, 133
- Murante et al. (2007) Murante, G., Giovalli, M., Gerhard, O., Arnaboldi, M., Borgani, S., & Dolag, K. 2007, MNRAS, 377, 2
- Nipoti et al. (2003) Nipoti, C., Stiavelli, M., Ciotti, L., Treu, T., & Rosati, P. 2003, MNRAS, 344, 748
- Osmond & Ponman (2004) Osmond, J. P. F., & Ponman, T. J. 2004, MNRAS, 350, 1511
- Ostriker & Hausman (1977) Ostriker, J. P., & Hausman, M. A. 1977, ApJ, 217, L125
- O’Sullivan et al. (2001) O’Sullivan, E., Forbes, D. A., & Ponman, T. J. 2001, MNRAS, 328, 461
- O’Sullivan et al. (2003) O’Sullivan, E., Ponman, T. J., & Collins, R. S. 2003, MNRAS, 340, 1375
- Paul et al. (2010) Paul, S., Iapichino, L., Miniati, F., Bagchi, J., & Mannheim, K. 2010, ApJ, submitted (arXiv:1001.1170)
- Pimbblet (2008) Pimbblet, K. A. 2008, Publications of the Astronomical Society of Australia, 25, 176
- Poole et al. (2006) Poole, G. B., Fardal, M. A., Babul, A., McCarthy, I. G., Quinn, T., & Wadsley, J. 2006, MNRAS, 373, 881
- Quintana & Lawrie (1982) Quintana, H., & Lawrie, D. G. 1982, AJ, 87, 1
- Rafferty et al. (2008) Rafferty, D. A., McNamara, B. R., & Nulsen, P. E. J. 2008, ApJ, 687, 899
- Rasmussen & Ponman (2007) Rasmussen, J., & Ponman, T. J. 2007, MNRAS, 380, 1554
- Rasmussen & Ponman (2009) Rasmussen, J., & Ponman, T. J. 2009, MNRAS, 399, 239
- Rasmussen et al. (2006) Rasmussen, J., Ponman, T. J., Mulchaey, J. S., Miles, T. A., & Raychaudhury, S. 2006, MNRAS, 373, 653
- Rebusco et al. (2005) Rebusco, P., Churazov, E., Böhringer, H., & Forman, W. 2005, MNRAS, 359, 1041
- Rines et al. (2007) Rines, K., Finn, R.,& Vikhlinin, A. 2007, ApJ, 665, L9
- Rogers et al. (2009) Rogers, B., Ferreras, I., Kaviraj, S., Pasquali, A., & Sarzi, M. 2009, MNRAS, 399, 2172
- Sanderson et al. (2009) Sanderson, A. J. R., O’Sullivan, E., & Ponman, T. J. 2009, MNRAS, 395, 764
- Sanderson et al. (2006) Sanderson, A. J. R., Ponman, T. J., & O’Sullivan, E. 2006, MNRAS, 372, 1496
- Stanghellini et al. (2006) Stanghellini, L., González-García, A. C., & Manchado, A. 2006, ApJ, 644, 843
- Sun et al. (2007) Sun, M., Jones, C., Forman, W., Vikhlinin, A., Donahue, M., & Voit, M. 2007, ApJ, 657, 197
- Sun et al. (2009) Sun, M., Voit, G. M., Donahue, M., Jones, C., Forman, W., & Vikhlinin, A. 2009, ApJ, 693, 1142
- Sutherland & Dopita (1993) Sutherland, R. S., & Dopita, M. A. 1993, ApJS, 88, 253
- Tran et al. (2008) Tran, K.-V. H., Moustakas, J., Gonzalez, A. H., Bai, L., Zaritsky, D., & Kautsch, S. J. 2008, ApJ, 683, L17
- Tremaine (1990) Tremaine, S. 1990, in Dynamics and Interactions of Galaxies, ed. R. Wielen (Berlin: Springer), 394
- Tremaine & Richstone (1977) Tremaine, S. D., & Richstone, D. O. 1977, ApJ, 212, 311
- Vale & Ostriker (2008) Vale, A., & Ostriker, J. P. 2008, MNRAS, 383, 355
- West (1994) West, M. J. 1994, MNRAS, 268, 79
- Yamada et al. (2002) Yamada, T., Koyama, Y., Nakata, F., Kajisawa, M., Tanaka, I., Kodama, T., Okamura, S., & De Propris, R. 2002, ApJ, 577, L89
- Yun et al. (2001) Yun, M. S., Reddy, N. A., & Condon, J. J. 2001, ApJ, 554, 803
- Zabludoff & Mulchaey (1998) Zabludoff, A. I., & Mulchaey, J. S. 1998, ApJ, 496, 39
- Zabludoff & Mulchaey (2000) Zabludoff, A. I., & Mulchaey, J. S. 2000, ApJ, 539, 136
- Zabludoff et al. (1990) Zabludoff, A. I., Huchra, J. P., & Geller, M. J. 1990, ApJS, 74, 1
- Zaritsky et al. (2004) Zaritsky, D., Gonzalez, A. H., & Zabludoff, A. I. 2004, ApJ, 613, L93