Photomultiplier Tubes in the MiniBooNE Experiment
Abstract
The detector for the MiniBooNE [1] experiment at the Fermi National Accelerator Laboratory employs 1520 8 inch Hamamatsu models R1408 and R5912 photomultiplier tubes with custom-designed bases. Tests were performed to determine the dark rate, charge and timing resolutions, double-pulsing rate, and desired operating voltage for each tube, so that the tubes could be sorted for optimal placement in the detector. Seven phototubes were tested to find the angular dependence of their response. After the Super-K phototube implosion accident, an analysis was performed to determine the risk of a similar accident with MiniBooNE.
keywords:
MiniBooNE , phototube , photomultiplier tube , R1408 , R5912PACS:
29.40.Ka1 Introduction
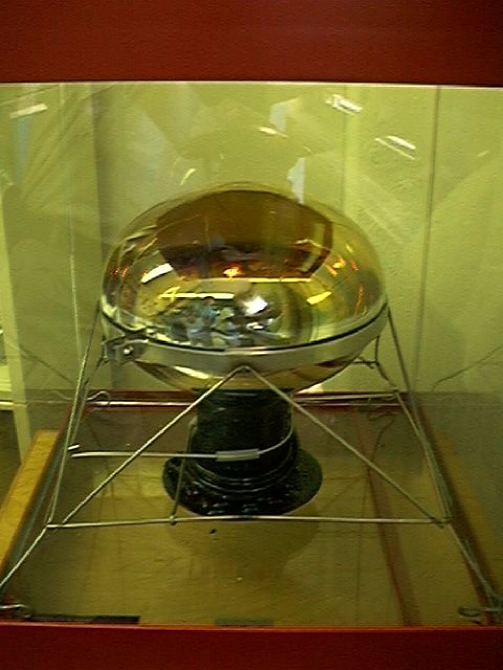
The MiniBooNE experiment [1] is a oscillation search at Fermi National Accelerator Laboratory designed to confirm or rule out the LSND signal [2]. The Fermilab Booster accelerates protons to 8 GeV; these protons strike a beryllium target, generating mesons which decay to produce the MiniBooNE beam. The neutrinos interact in a 12 m diameter sphere filled with mineral oil of food-grade purity, and the Čerenkov light from charged particles produced in these interactions is detected by 8 inch Hamamatsu [3] photomultiplier tubes (PMTs) lining the sphere. There are 1280 PMTs in the light-tight inner signal region: 956 are Hamamatsu model R1408, inherited from the LSND experiment; the remainder are Hamamatsu model R5912. Light produced in the outer concentric veto region is detected by an additional 240 R5912 PMTs. A typical tube is pictured in Figure 1. Light signatures recorded by the PMTs are used to reconstruct events within the detector. Leptons from charged current neutrino interactions are of particular interest, since these leptons tag the incoming neutrino flavor.
It is important to sufficiently understand the operating characteristics of the PMTs, since they are the only active detector element in MiniBooNE. MiniBooNE uses a Monte Carlo simulation to understand the detector’s response to neutrino interactions. This program simulates photons traveling through the detector from creation to detection, and models all intermediate processes. The geometry of all detector elements is coded into the simulation, including that of the PMTs.
Photons striking the photocathode in a PMT produce photoelectrons (PEs), whose number is amplified via a dynode chain; the magnitude of the current so produced is proportional to the number of incident photons whose energy is above a certain threshold. A specific operating voltage must be found for each PMT so that all tubes have the proper gain. Gain is defined here as observed output charge (divided by charge per electron) per input photoelectron. The charge and timing information recorded from each PMT can then be used to reconstruct the events off-line. Ideally, this information, along with photocathode efficiency as determined by Hamamatsu, specifies exactly when and how many photons hit the PMT. Each PMT is tested in several ways to determine: basic functionality, timing resolution, charge resolution, dark rate and operating voltage. The operating voltage was chosen so that the gain is closest to the desired signal electrons per photoelectron.
In addition to these global PMT tests, specialty tests were done on seven PMTs. In order for the Monte Carlo simulation to properly model the behavior of the PMTs, it is necessary to correctly include their efficiency as a function of incident photon angle. The dominant effect comes simply from the solid angle subtended by a PMT as a function of angle, and this is handled by coding an approximate PMT shape into the simulation. Any remaining efficiency function must be measured and entered into the code. The measurement, however, will itself contain the solid angle effects; these must be factored out of the measured angular efficiency to avoid double-counting. A thorough understanding of the angle-dependent response, time and charge resolution, and individual variations of the photomultiplier tubes will help accurately identify neutrino events within the MiniBooNE detector.
This paper discusses the following topics. In Section 2, the technical specifications of the phototubes are described, along with the custom bases that MiniBooNE used. In Section 3, the tests which were performed on every tube, with their results, are described. In Section 4, the angular tests which were performed on 7 tubes are described, along with their results and a comparison of these results to other angular tests. Section 5 describes the studies of MiniBooNE’s risk of an implosion chain reaction.
2 Technical Design of the PMTs
Phototubes in the MiniBooNE detector satisfy the following technical requirements. Their maximum dark rates lie below the response rate expected from cosmic rays. Their gains are high, around , to be adequately sensitive. Their responses are reliably fast, and have a narrow enough pulse width to minimize response pileup. Each of these characteristics was tested; these tests are described in subsequent sections.
2.1 PMT Specifications from Hamamatsu and custom base design
The two models (R5912 and R1408) of phototubes used in MiniBooNE differ primarily in their dynode structures and number of stages, and are similar in all the characteristics described above.
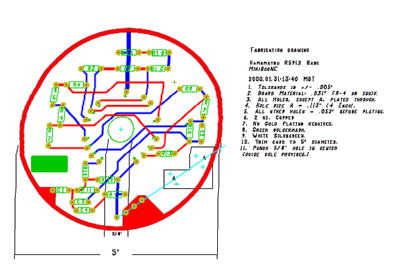
The R5912 is a ten-dynode-stage photomultiplier tube with an 8 inch hemispherical photocathode. The base supplies the high voltages for the grids, dynodes, and anode, and provides the back termination in the anode circuit. The voltage divider chain is entirely passive, and is fabricated with carbon-film resistors and ceramic-disk capacitors. A single coaxial cable is used to provide high voltage (on the order of 1500V) and to connect the anode signal to the readout. The anode circuit is back terminated in 50 and balanced to compensate for the distortion caused by the capacitive coupling in the termination circuit. The high voltage taper is the one recommended by Hamamatsu (ca. 1996) for gain. A drawing of the tube dome and a diagram of the dynode circuitry from the Hamamatsu data sheets are included in the appendix as Figure 19. Figure 2 shows the printed circuitboard layout for the R5912 custom bases.
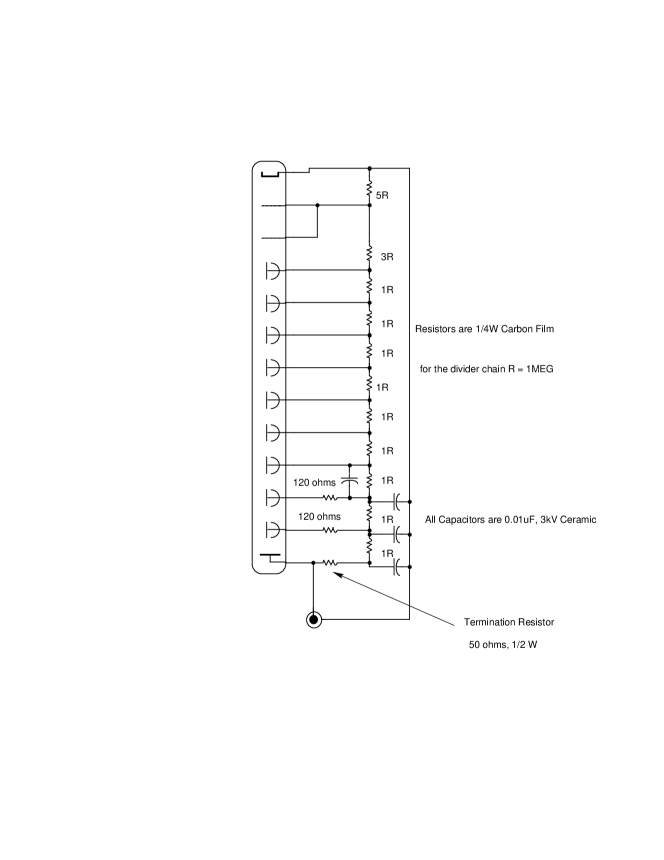
The R1408 is a nine-dynode-stage photomultiplier tube. Hamamatsu upgraded it to the R5912 at least 10 years before this publication. The circuit diagram for the base (designed for the LSND experiment) is shown in Figure 3.
The detector design requires that the tubes, bases, and cables be immersed in oil for several years without adversely affecting the phototubes or the oil. To accomplish this, the bases and necks of all MiniBooNE PMTs were coated with the two-component epoxy EP21LV from Masterbond [4], which is impervious to and insoluble in oil. For the R1408 tubes recycled from LSND, the Masterbond was applied on top of the existing Hysol [5] coating.
3 Global Testing
The method of global testing for the PMTs has been described in detail elsewhere [6]; a synopsis of that report is provided here.
The purpose of global testing was to select an operating voltage which resulted in a similar response from each PMT, regardless of model (R1408 or R5912). The selected gain was 107 electrons per photoelectron ().
The testing process served to determine five characteristic data about each PMT: dark rate, time jitter, charge resolution, double-pulsing rate, and pulse shape. These data were used to sort the tubes into five categories, from best to worst in timing and charge resolution. Categories 4 and 5 had similar resolutions, and were divided between the two categories by dark rate. These classifications were used to distribute tubes ranked 1 through 4 (with about 320 in each rank) evenly throughout the tank. Category 5 tubes were used in the veto, where timing and charge resolution is less crucial but low dark rate is important.
3.1 Global testing: apparatus
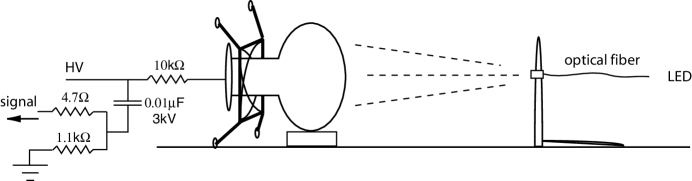
Figure 4 shows a schematic of a single tube in the test setup. The full setup accommodated 30 R1408 PMTs and 16 R5912 PMTs. Tubes were dark adapted for 12-24 hours. After this, tube responses were recorded using an automated VXI readout system. Fiber optic cables located about eight inches from the face of each tube transmitted a steady stream of pulses from an LED pulser. A diagram of a signal tube setup is shown in Figure 4.
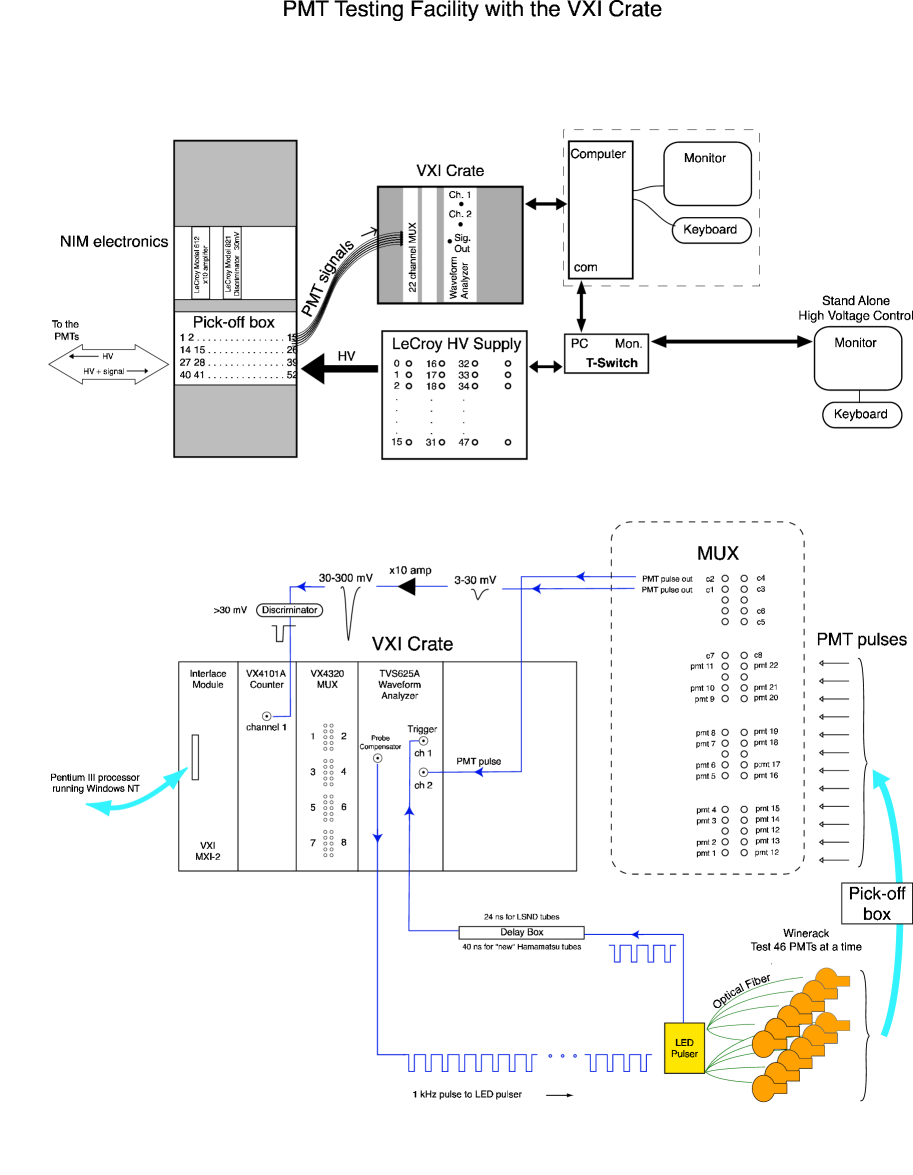
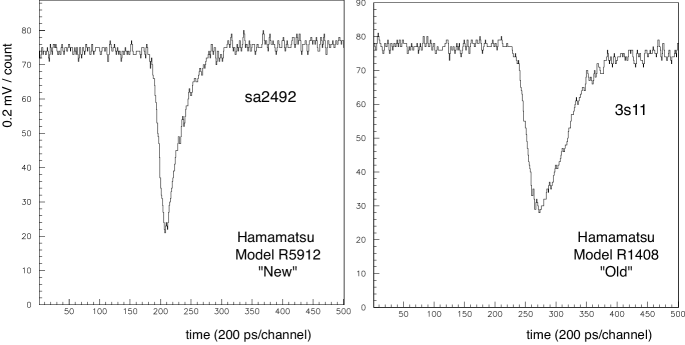
The output pulse was sent to the VXI electronics, where the waveform was digitized (Fig. 5). Different delays were added to the LED trigger to center the captured waveform in the time windows (Fig. 6). The pulses were digitized over 512 channels at a rate of 5 giga-samples/sec using the Tektronix oscilloscope inside the VXI crate.
3.2 Global testing: procedures and data handling
The testing data were acquired in two modes. First, the dark rate rates were collected by recording the noise rates measured at a range of operating voltages, with no light source. Second, the PMTs were illuminated by an LED light source whose wavelength was 450 nm (corresponding approximately to the Čerenkov frequency of the oil). The source flashed at a rate of 1 kHz; the width of each pulse was 1 ns. PMT responses to 600-1000 LED flashes were used to determine the operating voltage for the required gain. This procedure also allowed both the charge and time resolutions, and pre- and post-pulsing anomalies to be studied.
3.3 Global testing: results
Each PMT was tested to determine its operating voltage, as well as its gain, dark rate, charge resolution, timing resolution, and double pulsing rate. The results of the later five measurements are reported below.

PMT gain corresponds to the mean number of electrons produced by the phototube in response to one PE. This was determined using the equation
where is the total charge from the PMT for all pulses with response past threshold, is the number of responses past threshold, and is the light level. Total charge was computed by summing up charge in the main PMT pulse for all responses with in-time pulses that pass threshold, excluding double pulses. The second factor is the reciprocal of the average number of PEs seen by a PMT for a given light level, , (excluding zero responses) predicted from Poisson statistics. The voltage was selected in order to obtain a gain of electrons per . The distribution of operating voltages at which the PMTs run in the detector is shown in Fig. 7.
Dark rate is defined as the number of pulses larger than 3 mV in one second. The experiment required that the tubes operate with a dark rate below 8 kHz in the main tank and below 4 kHz in the veto. Dark rates were measured over a range of voltages, from several hundred volts below suggested operating voltage up to operating voltage and above. Plots of dark rate versus voltage, or plateau plots, serve as a measure of PMT quality. The PMTs are operated on the plateau, where dark rate does not change significantly as the operating voltage increases. The R1408 PMTs were found to have poorly defined plateaus, but they were considered acceptable if the dark rates had a steady, shallow rise when the operating voltage was increased.

The charge resolution, is determined from the width of the peak in the PMT response corresponding to one PE. The distribution of charge resolutions for all PMTs is shown in Fig. 8.
The time jitter in the measurements is dominated by the timing resolution of the PMTs; the timing resolution of the oscilloscope was found to be negligible. The distribution of timing resolutions for all PMTs is shown in Fig. 9.

Pre- and post-pulsing, where the main PMT pulse is preceded or followed by additional small pulses, is a known effect in the types of PMTs used on MiniBooNE [6]. Pre-pulsing was observed in only four R1408 tubes, which were rejected. Post-pulsing occurs in two different time intervals: between 8-60 ns after the main pulse, and 100 ns-16 s after the main pulse. MiniBooNE is concerned about the first case (“early post-pulsing”), because data in the detector are recorded in 100 ns intervals, making it unlikely that the second case will contaminate events. Early post-pulsing can begin when an electron accelerated to the first dynode starts a typical cascade, and causes another electron to be ejected from the first dynode. This second electron can move around the inside of the PMT dome before settling back to the first dynode and initiating a second cascade, which becomes the post-pulse. Hamamatsu reports that R5912 and R1408 PMTs are expected to have early post-pulses in of the responses from every tube. MiniBooNE observed higher rates. PMTs were required to have a double-pulsing rate of for the R5912 PMTs and for the R1408 PMTs at the time of installation. The distribution of PMT double-pulsing rates for all PMTs is shown in Fig. 10.

4 Angular Testing
Extensive specialized testing was done on seven phototubes to explore the behavior of other important parameters, especially the dependence of the PMT response on the angle of the incoming light. The data from R1408 and R5912 tubes were kept separate until the final analyses. The main objective of the angular tests was to find how the response of the PMTs depended on the angle of incident light. There were three additional tests. One tested a few tubes at various voltages. Another rotated the tubes about two orthogonal axes arbitrarily labelled “yaw” and “pitch” to test the assumption that the tubes are rotationally symmetric. The last tested tubes in air, without the oil present in the other tests.
4.1 Angular tests: apparatus
The apparatus used for these tests is designed to replicate as closely as possible the characteristics of the MiniBooNE detector, on a much smaller and more manageable scale. The central part of the apparatus is a 40 gallon, stainless steel tank, painted on the inside with the paint used in the detector tank: a primer and black top coat. The primer is Hydralon P water-based epoxy primer (Sherwin Williams E72AC500/V66VC503 Hydralon P water-based epoxy primer), and the black topcoat is a flat black moisture cure aliphatic polyurethane chemical agent resistive coating (F93B102 Flat black moisture cure polyurethane). The tank can be filled with MiniBooNE oil when tests require it. It houses a single PMT, which can be rotated along the polar or azimuthal angle of the tube, using two precision rotary tables, one for pitch and one for yaw with respect to the table. The tubes were fixed to these tables with an arbitrary rotation, so “pitch” and “yaw” refer only to the mechanical apparatus and not any characteristic of the tubes. These tables have externally-coupled mechanical controls which allow the phototube position angle to be changed without opening the tank and exposing the tube to light. A 10.25 inch diameter window at the front of the tank allows the tests to simulate the light in MiniBooNE events by propagating the light several meters before it strikes the phototube. Because of this window, the entire testing room must be kept dark throughout each test.
The light source is a PicoQuant PLS 450, a sub-nanosecond pulsed LED. Its center wavelength is 460 nm, with 50 W average power at 40 MHz, approximately 30 nm spectral width, and typically 800 ps pulse width. It was used in 10 second sample periods at about Hz. The light was filtered to produce a low-intensity beam (1 photoelectron per pulse). The light was directed through an optical cable to face the tank from a distance of approximately 3 meters. The light from this source makes a cone with half-angle about 23∘, with greatest intensity along the centerline. The 3 m distance is great enough that one can assume that the entire face of the tube is uniformly illuminated with light in parallel rays.
The signals from the tube in the testing tank can be read out via an oscilloscope/GPIB card, or via the MiniBooNE data acquisition system. For the angular tests, a specialized data aquisition system was used (Fig. 11). The signal from the tube in the tank is amplified by a factor of 100, sent to a discriminator with 30 mV threshold, and finally put into coincidence with the delayed sync out signal from the LED pulser. The number of coincidences and the number of input light pulses each go to a scaler; they are then recorded and used to calculate the relative efficiency.

The tank is magnetically shielded with a -metal box. This was done because ambient magnetic fields (e.g., the Earth’s) can influence the relative efficiency of the tubes, and thus rotation within these fields may change the shape of the relative efficiency results. To see if ambient magnetic fields could have a significant effect, the tank was rotated (while holding the configuration of the tube and internal light source constant). The resulting effect was smaller than (but on the same order as) the angular dependence. When the tank was shielded and the same tests were performed, this dependence on orientation within ambient fields was not seen.
4.2 Angular tests: procedures
The apparatus detailed above was used to study relative efficiency () as a function of angle. Using rapid, short-duration pulses of the LED, the of the tube was measured at a given position by taking the ratio of the number of responses which coincided with LED pulses to the total number of pulses, with about pulses per datum.
values were measured at increments through the entire of response, with two repetitions at each point and two rotations of the tube (from to and back again) for a total of four measurements at each tube position. Data were recorded directly into a spreadsheet, providing an ongoing real-time check.
This rotational test was performed on four R1408 and three R5912 tubes. Most of these tubes had been previously tested with the global testing (see Section 3), so the expected dark rate was known, and known to be comparable to that for the other tubes. The global testing results also specified tube operating voltages. It was necessary to dark adapt each tube for at least 12 hours to obtain a dark rate comparable to that of the tubes in the detector, which have not been exposed to bright light for over three years.
The phototubes are essentially rotationally symmetric about their central vertical axis, with variation only in the dynode structure below the main dome. The R1408 tubes have “venetian blind” style dynodes; the R5912 tubes have “box and line” style dynodes. No significant differences were observed when the dynodes at the starting position were oriented horizontally, vertically, or at . Additionally, a test was performed on one tube varying the yaw angle (similar to the pitch measurements performed on all tubes); again no significant differences were observed. The equivalence of pitch and yaw implies that that the roll orientation of the tube does not affect the results. This simplified the measurements greatly.
Another test was performed by varying the operating voltages by 50 V above and below the nominal voltages found by previous MiniBooNE tests. The gain variation with voltage, which determines the , was already known, so this test checked for variation in the shape of the curve more than the expected variations in amplitude. None of significance was observed.
4.3 Angular tests: results
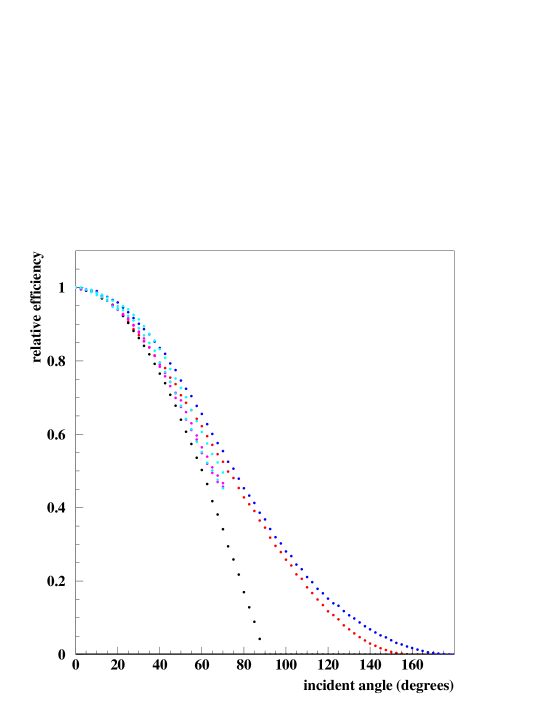
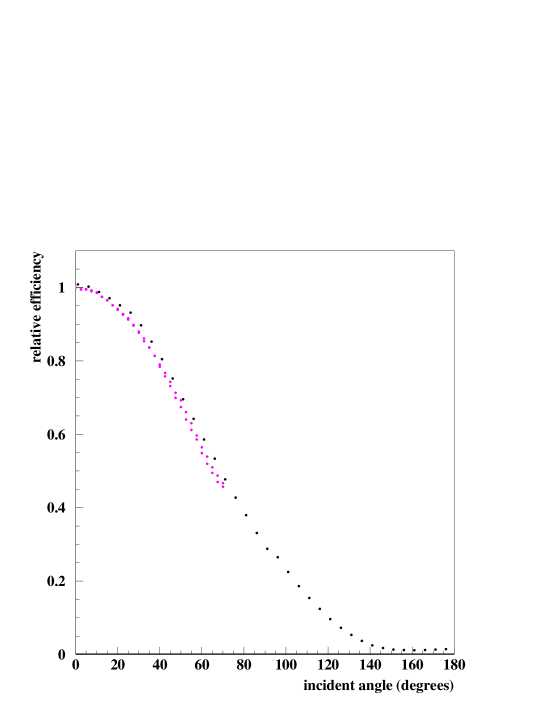
Plots of relative efficiency as a function of angle were made for each set of measurements; these are roughly bell-shaped, as one would expect from the shape of the tubes. Typical results from an R1408 and an R5912 (with the fits as described below) are included in Figures 12 and 13. These plots are similar from tube to tube (see Figure 14). The parameters for the fits, as well as the average which will be used in the MiniBooNE Monte Carlo simulation, are included in Table 1. The results obtained were compared to expectations from the shape of the PMTs and results obtained by the SNO [8] experiment.
4.3.1 Angular tests: results and polynomial fits
Because the PMT rotator mount inside the tank does not precisely specify the initial angle, is found for each curve; the angle corresponding to is assumed to correspond to . Each plot’s horizontal axis is shifted accordingly before the plots are compared. Each y-axis is scaled to . An initial quadratic fit is performed on the central points of each plot to determine the horizontal shift. A 6-degree polynomial fit is then performed on each plot in the region to . Outside of this region, statistics were significantly lower, making the data less comparable from tube to tube. The fit polynomial is forced to be symmetric by employing only even powers of the incident angle. The polynomial coefficients are varied to minimize the . Finally, before comparing the functions, each fit is normalized by dividing by its constant term (which equals ), forcing . The results of the fits are shown in Table 1 and superimposed on Figures 14 and 18.


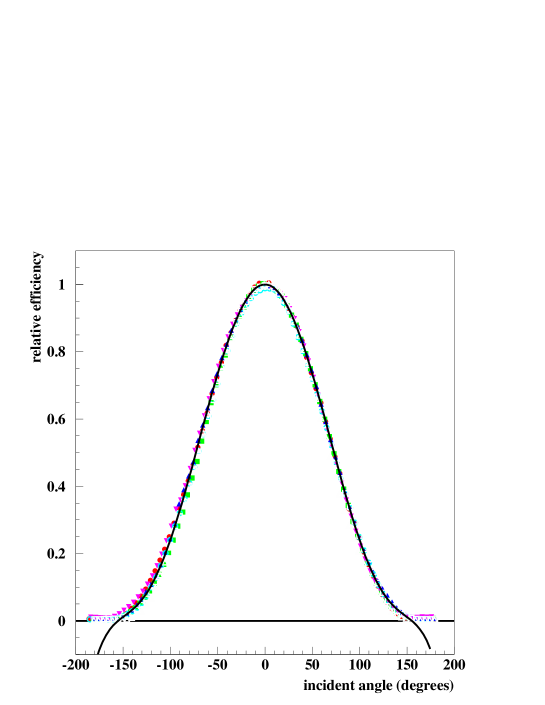
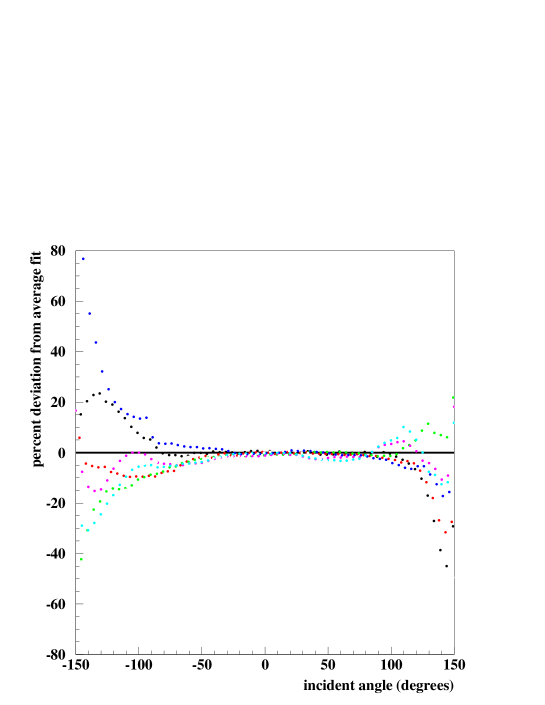
The errors on these data are dominated by tube-to-tube variation. The tests on each tube individually had very high statistics, typically around light pulses at each measured angle, and about 600 000 responses at central angles or 4 000 at extreme angles (where the tube was facing backwards). Thus, to describe the error, it is more important to look at the relatively large differences between data sets from different tubes. This was done by examining the parameters of the fits. The average of the seven fitted values of each parameter and their standard deviation from that average are given in Table 1. Figure 14 compares each PMT to the average fit, and deviations from the average fit are shown in Fig. 15.
| tube number | |||
|---|---|---|---|
| 15s3 | -1.182 | 5.018 | -7.624 |
| 19s3 | -1.234 | 5.436 | -8.468 |
| 20s1 | -1.162 | 4.818 | -7.136 |
| 20n16 | -1.156 | 4.725 | -6.728 |
| SA2753 | -1.101 | 4.191 | -5.539 |
| SA2761 | -1.177 | 4.964 | -7.552 |
| SA2272 | -1.264 | 5.563 | -8.549 |
| average | -1.182 | 4.959 | -7.371 |
| error | 5.337 | 4.583 | 1.042 |
| % error | 4.5 | 9.2 | 14.1 |
The even-polynomial fits are sufficiently accurate and consistent for the R1408 tubes. For the R5912 tubes, the fits are less accurate on one side (see Figure 13). To describe this difference, several other fits of the R5912 tube data were attempted. The main attempted non-symmetric fits used a different 5-degree polynomial for angles above or below zero, requiring only that they meet at . The same horizontal shift and were used for this fit as for the initial, even polynomial fit. However, it was found that the variation between individual tubes was larger than the average difference between R5912 tubes and R1408 tubes, so the even polynomial fit was used for all tubes.
4.4 Angular tests: comparison to predictions and to SNO data
MiniBooNE’s relative efficiency angular data were compared to several geometrical models, and to data from previous tests from the Sudbury Neutrino Observatory (SNO) experiment [8]. The three geometrical models assumed the photocathode was a flat disk, a hemisphere, and the shape from the Hamamatsu technical specifications. The data from SNO were taken from tests on two R1408 PMTs in air and water, for a total of four tests. The PMTs in their detector are all Hamamatsu R1408 PMTs (the same as the MiniBooNE R1408 tubes), making comparisons with them particularly useful. These seven results are shown together in Figure 16. Note that all of the SNO results lie between the hemisphere and the ovoid shape predictions on the top and the flat disk prediction on the bottom. SNO used water instead of oil because the SNO detector contains water.
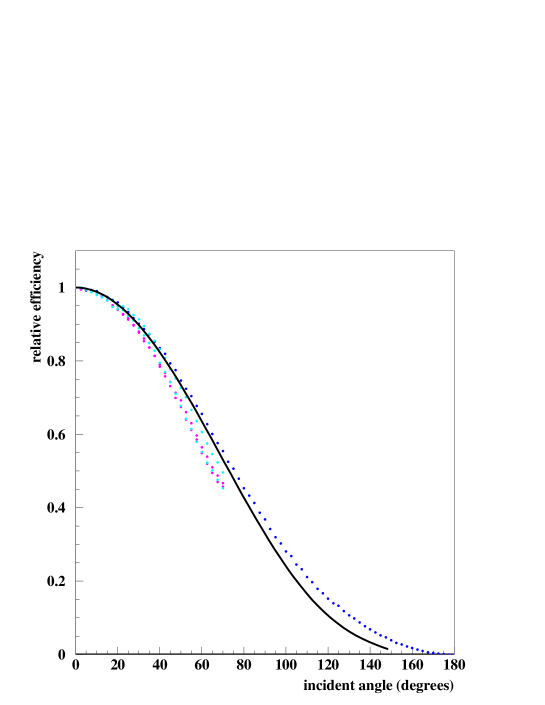
While developing the testing procedure, one tube was tested without filling the testing tank with oil. The results from this test, normalized to , were very similar to the air tests done by SNO. This comparison is shown in Figure 18.
Comparisons among the angular response measurements, SNO data, and geometrical models reveal overall similarities. The present data are also observed to be closer to the geometrical model from the Hamamatsu ovoid shape description than to the results obtained in either air or water by SNO. This may be the case because these data were taken in oil, where the index of refraction is much closer to that of glass than either air or water, resulting in less reflection at the oil-glass interface.
5 Implosion Risk Studies
On November 12, 2001, a PMT implosion in the Super Kamiokande(Super-K)[9][10] detector started a chain reaction that resulted in the loss of several thousand tubes. At the time, the MiniBooNE detector was not yet filled with oil. Assessment of the possibility of a similar accident occurring at MiniBooNE was immediately undertaken.
5.1 The Super-K detector design
The Super-Kamiokande detector is cylindrical, 36 m tall and 34 m in diameter, and filled with water. Hamamatsu 20-inch PMTs line the interior on a support structure. They are spaced 0.8 m center to center to give 40% photocathode coverage in the tank. These tubes are rated for a pressure of 608 kPa (6 atm). When full, the static pressure at the bottom of the detector is 208 kPa (2.05 atm).
At the time of the accident the tank was being refilled following some maintenance work, and was approximately filled with water. The failure began with the implosion of a single tube on the detector floor; the reason for this failure is not known. This set off a chain reaction which ultimately destroyed most of the tubes more than 5 m below the water line. All tubes within 5 m of the surface survived.
5.2 Comparison of Super-K and MiniBooNE implosion scenarios
MiniBooNE has a significantly smaller (12 m diameter) spherical detector, using 8 inch Hamamatsu PMTs rated for 709 kPa (7 atm) pressure. The tubes are spaced 0.55 m center to center. The detector is filled with oil, which is a factor of 0.9 less dense than water. The static pressure at the bottom of the MiniBooNE tank is 208 kPa (4.5 atm). Each of these factors suggests that the MiniBooNE detector should be more resistant to a chain reaction of implosions than was the Super-K detector.
A computational model to calculate the shock wave pressure resulting from tube implosion was developed, based upon the stored energy in an evacuated tube at a given depth, assuming the pulse length is the tube radius. It should be noted that the energy stored in an 8 inch MiniBooNE tube is over an order of magnitude less than in a 20 inch Super-K tube.
The pressure on a neighboring tube when a tube at the bottom of the MiniBooNE detector implodes was compared to the pressure resulting from a Super-K implosion at a depth of 5 m, the depth above which all Super-K tubes survived. It was found the pressure in MiniBooNE was 0.45 times the Super-K pressure at survival depth, thus indicating a safety factor of two for MiniBooNE if the tubes were equally strong. In fact, the 8 inch tubes are rated for a higher pressure than the 20 inch tubes. MiniBooNE is therefore confident that the experiment is operating with a safety factor of greater than two, and that an accidental implosion of one of MiniBooNE’s tubes will not result in a chain reaction.
A more rigorous hydrodynamic calculation was done using numerical techniques. From these calculations a somewhat greater safety factor of 2.6 can be inferred.
5.3 Tests performed at Super-K and SNO
After the Super-K accident, several tests were done at Super-K using the 20 inch tubes. Personal communication from several Super-K collaborators indicate that at a depth of 30 m of water chain reaction implosions occurred, but at 15 m there were no chain reactions. Since the pressure at 15 m is significantly greater than the maximum pressure in MiniBooNE this supports the conclusion that MiniBooNE tubes are not at risk for this sort of accident.
In 1990, the SNO collaboration also performed a series of tests of 8 inch PMTs in a water-filled pressure vessel. No chain reactions occurred at a pressure of 608 kPa (6 atm). This test also supports the previous conclusion.
6 Conclusion
This paper has reported on tests of the R1408 and R5912 photomultiplier tubes used in the MiniBooNE experiment. We have briefly described the global testing of all tubes, described in detail in reference [6]. The main results reported in this paper pertain to the phototube angular tests, and to the calculation of implosion risk for MiniBooNE. The angular response of the tubes determined a sixth order polynomial function describing the angular response. Implosion risk calculations for the tubes in the MiniBooNE detector were described. It was found that the MiniBooNE detector has a large safety factor.
7 Acknowledgments
The authors would like to thank the following people for their valuable contributions: Jesse Guerra, Andy Lathrop, Zhijing Tang, Ryan Patterson, T. Neil Thompson, Sally Koutsoliotas, and Christi Bohmbach. Thanks are due also to the following people for helpful discussions and editing: Bruce Brown, David Finley, Bill Louis, Peter Meyers, Mike Shaevitz, Ray Stefanski, and Morgan Wascko.
This material is based in part upon work supported by the National Science Foundation under Grants No. NSF PHY-0139464 and NSF PHY 00-98826 and the U.S. Department of Energy No. DE-FG02-91ER40671 .
References
- [1] Proposal for the MiniBooNE experiment: http://www-boone.fnal.gov/publicpages/proposal.ps.
- [2] C. Athanassopoulos et al. [LSND Collaboration], Phys. Rev. Lett. 77, 3082 (1996) [arXiv:nucl-ex/9605003].
-
[3]
Hamamatsu Catalog, “Large Photocathode Area PMTs”, Catalog No.TPMH1286E02.
http://usa.hamamatsu.com/
http://www.hpk.co.jp/Eng/main.htm . -
[4]
MASTER BOND INC. 154 Hobart Street, Hackensack, New Jersey 07601.
Phone: (201) 343-8983
Fax: (201) 343-2132
Web Site: http://www.masterbond.com -
[5]
Loctite brand product,
http://www.loctite.com.
In US Toll Free: 800-LOCTITE (800-562-8483)
In Canada, call: 800-263-5043
Henkel Corp - Industrial, 1001 Trout Brook Crossing, Rocky Hill, CT 06067 - [6] B. T. Fleming, L. Bugel, E. Hawker, V. Sandberg, S. Koutsoliotas, S. McKenney and D. Smith, IEEE Trans. Nucl. Sci. 49, 984 (2002).
- [7] J. May, M. Wysocki, L. Bugel, B.T. Fleming, P. Nienaber, and D. Smith, Nuclear Science Symposium Conference Record, IEEE, 1, 10-16 Nov. 2002, pp. 446-449, vol. 1.
- [8] M.T. Lyon, PhD thesis, University of Oxford 59 (2002).
- [9] http://neutrino.phys.washington.edu/superk.
- [10] Fermi News, Vol. 24 no.19, Fri Nov. 23, 2001
Appendix A Hamamatsu Design Specifications