Revisiting Surface Diffusion in Random Deposition
Abstract
An investigation of the effect of surface diffusion in random deposition model is made by analytical methods and reasoning. For any given site, the extent to which a particle can diffuse is decided by the morphology in the immediate neighbourhood of the site. An analytical expression is derived to calculate the probability of a particle at any chosen site to diffuse to a given length, from first principles. Using the method, the probabilities for different diffusion lengths are calculated and their dependence on system size and the number of deposited layers is studied. Numerical simulation of surface diffusion in random deposition model with varying extents of diffusion are performed and their results are interpreted in the light of the analytical calculations. Thus, a clearer understanding of the diffusion process and the effect of diffusion length on surface roughness is obtained. Systems with surface diffusion show nearly random deposition-like behaviour upto monolayer deposition. Their interface widths, in a logarithmic plot, are initially linear, as in random deposition. With increase in the number of layers, correlation effects between neighbouring columns become dominant. The interface deviates from its initial linear growth and eventually becomes saturated. An explanation for this behaviour is discussed and the point of departure from the linear form is estimated analytically.
pacs:
68.35.Fx, 68.35.Ct, 68.35.-pI Introduction
Surface diffusion in random deposition model was introduced by Familyfamily86 to study the scaling properties of rough surfaces under the effect of surface diffusion in dimensions. In the model, particles are deposited from above onto a line of sites. The particle arriving at any randomly chosen site, diffuses to the nearest neighbouring site that is lower than the selected site. The resulting surface is smooth compared to the surface in random deposition. Diffusion to neighbouring sites introduces correlations among the neighbouring columns which eventually lead to saturation of the surface roughness.
The roughness of the interface is quantitatively expressed in terms of interface width , which is a function of system size and the growth time . is defined by the root-mean-square (rms) fluctuation of the height of the interface.
| (1) |
Following Family-Vicsekfamvic85 scaling relation, scales initially as for a fixed system size. It saturates to a time-independent value , beyond a model-dependent saturation time . The saturated width scales with the system size as .
It was observed by Family, through simulations in one dimension, that the scaling exponents obtained are quite different from those obtained for random deposition (RD) barabasi . An interesting point, reported by Family, was that the surface properties do not change with further increase in diffusion length. However, no explanation was put forward for this independence.
Surface diffusion is found to be one of the most important factors affecting surface morphology in several practical applications. For example, in molecular beam epitaxy (MBE), selective area metalorganic vapour phase epitaxy (SA-MOVPE) and chemical beam epitaxy of nanowires, the length of surface diffusion is significant in determining the growth rate and the mode of growth expt . This diffusion length may be controlled by varying one or more experimental parameters such as the substrate temperature or introducing atomic or molecular hydrogen under pressure mori95 . An investigation is hence necessary to understand the role of surface diffusion in surface growth processes, and the nature of the dependence.
In Family’s model, the extent of diffusion is confined to nearest neighbours. However, at any stage of deposition, there may be several sites with successively lower neighbours beyond the nearest. At such sites, a priori it seems, roughness may be further reduced if diffusion is not limited to nearest neighbour alone.
In this present work, we study in an analytical manner and also through numerical simulation, the significance of diffusion length in determining interface roughness. Using simple combinatorial argument, the probability with which a particle at any chosen site will diffuse over a certain distance is derived, whence, for a given system size and number of deposited particles, the probability of diffusion over different distances (nearest neighbour, next nearest neighbour etc.) can be estimated. The diffusion length with the maximum likelihood will be the most dominant in determining the smoothness of the surface.
To complement the analytical study, numerical simulations of random deposition with surface diffusion are performed. A newly arriving particle is allowed to diffuse over a prescribed neighbourhood defined by a diffusion length . Starting with , corresponding to Family’s nearest neighbour diffusion, this diffusion length is varied over the values and its effect on the dynamics of growth is observed. We shall refer to this extended Family’s model as random deposition with surface diffusion (RDSD). The system sizes chosen, range from small sizes , studied by Family, to larger sizes like and .
Our analytical study shows that the nearest neighbour diffusion probability is most dominant, thereby explaining Family’s observation that diffusion to farther neighbours does not affect surface properties. The numerical simulations show a small change in surface properties as the diffusion length is increased from to . Beyond , the surface properties show no further change, in accordance with our analytical results.
We address another related feature of RD and RDSD processes in the sub-monolayer region. For RD, the logarithmic plot of the interface width with time increases linearly. With the introduction of surface diffusion, the plot is nearly collinear with that for RD in the sub-monolayer region. A deviation from this linear form is evident as a complete layer of deposition is approached, much before the saturation of the interface width. This feature is discussed and a quantitative estimate of the time of this departure from the straight line is made.
II The Model
In Family’s model of surface diffusion in random depositionfamily86 , a particle dropped in column sticks to the top of the column , or depending on which of the three columns has the smallest height. If the columns , and have the same height, then the particle simply stays on top of column and does not diffuse. If the neighbouring columns and are of equal heights, lower than that of , the particle is allowed to move to the top of either neighbour with equal probability.
To extend the model to larger diffusion lengths, a particle arriving at a chosen site is allowed to diffuse to farther neighbours on either side. As an illustration, for allowed diffusion length , a particle arriving at a chosen site is allowed to diffuse up to two neighbours, successively lower, on either side. The particle first moves to the site lowest among , and . If it has already moved to a neighbouring site, i.e., or , it then moves to the next neighbour, i.e., or respectively, if that site is further lower. If in the first move and sites are equal to each other and lower than site , the movement to the left or right is initiated by random choice. If however both sites and are equal to or higher than site , no movement takes place. Figure 1 illustrates the deposition rules for the model.

III Analytical Estimate of Diffusibility
Let us consider a system of length . The probability of selecting a random site among the available sites is .

Let us first focus on the morphology of a small subsystem consisting of the chosen site of height (where a new particle arrives) and its two nearest neighbours and with heights and respectively. The configurations which allow at least one step diffusion at the site , say, to the left, must have the height of the ()th column less than the height of the th column, i.e., . If layers, or a total of particles are deposited, the probability that the chosen site has a lower left neighbour is given by
| (2) |
The summations are subject to the restrictions and . Likewise, for diffusion to both left and right, at the site , by at least one step, the height of the left nearest neighbour and that of the right nearest neighbour should both be less than . Then the probability for at least one step diffusion to both sides is (See Figure 2),
| (3) | |||||
Here again, the summations are subject to the restrictions , and . From the set of all configurations that allow at least one step diffusion to the left at the chosen site, if one removes all those that allow diffusion to both sides by at least one step, one is simply left with the configurations that allow diffusion only to the left and not to the right. Hence, the probability of diffusing at least one step to the left with no diffusion to the right is given by
From symmetry, we may write , the probability of diffusion to the right, with no diffusion to the left as,
The probability that a particle arriving at the chosen site may diffuse to at least one neighbouring site on either side is given by,
| (4) | |||||
Extending the above arguments to diffusion steps, the probability of diffusion by at least steps to either side is given by,
| (5) |
where, following Eq. (2) we may write
where, the summations are over and every , for . The restrictions on the summations are and . Similarly, we may write for ,
where, the restrictions on the summations are , and .
The probability that a particle arriving at a selected site will diffuse exactly steps is given by
| (6) |
and the probability of zero or no diffusion is
| No. of Layers | 1 | 2 | 5 | 10 | 20 | 100 |
|---|---|---|---|---|---|---|
| 0.5253 | 0.4533 | 0.4035 | 0.3810 | 0.3672 | 0.3478 | |
| 0.3882 | 0.4048 | 0.4050 | 0.4016 | 0.3970 | 0.3902 | |
| 0.08207 | 0.1252 | 0.1579 | 0.1728 | 0.1824 | 0.1918 | |
| 0.004444 | 0.01578 | 0.02998 | 0.03855 | 0.04499 | 0.05771 | |
| 0.00004930 | 0.0009140 | 0.003366 | 0.005471 | 0.007388 | - | |
| 7.166 x 10⁻⁸ | 0.00002252 | 0.0002457 | 0.0005842 | 0.0008818 | - |
| No. of Layers | 1 | 2 | 5 | 10 | 20 | 100 |
|---|---|---|---|---|---|---|
| 0.5279 | 0.4542 | 0.4172 | 0.3816 | 0.3673 | 0.3488 | |
| 0.3864 | 0.4046 | 0.4005 | 0.4011 | 0.3970 | 0.3900 | |
| 0.08105 | 0.1247 | 0.1514 | 0.18664 | 0.1824 | 0.1914 | |
| 0.004516 | 0.01566 | 0.02762 | 0.02452 | 0.04497 | 0.05747 | |
| 0.00006098 | 0.0009081 | 0.002969 | 0.005475 | 0.007382 | 0.01064 | |
| 1.623 x 10⁻⁷ | 0.00002336 | 0.0002037 | 0.0005439 | 0.0008808 | - |
We have computed these probabilities for several system sizes. In Table 1 and Table 2 the values are given for system sizes and respectively. We observe that the system sizes do not have any marked influence on the probabilities.
A plot of versus the number of layers in logarithmic scale is shown in Fig 3. The probability that there is no diffusion at all, steadily decreases as the number of deposited layers increases. For finite diffusion lengths, all other probabilities , increase as the number of layers increases. After layers of deposition, the zero and one step diffusion probabilities are the highest, followed by two and three step diffusion probabilities. After layers, when the RDSD model has attained saturation, the nearest neighbour diffusion probability dominates, followed by zero diffusion probability as can be seen in Fig 4. The probabilities for diffusion lengths and are significantly smaller in comparison, together accounting for less than of the total possibility of diffusion. The probabilities for higher diffusion lengths are negligible.
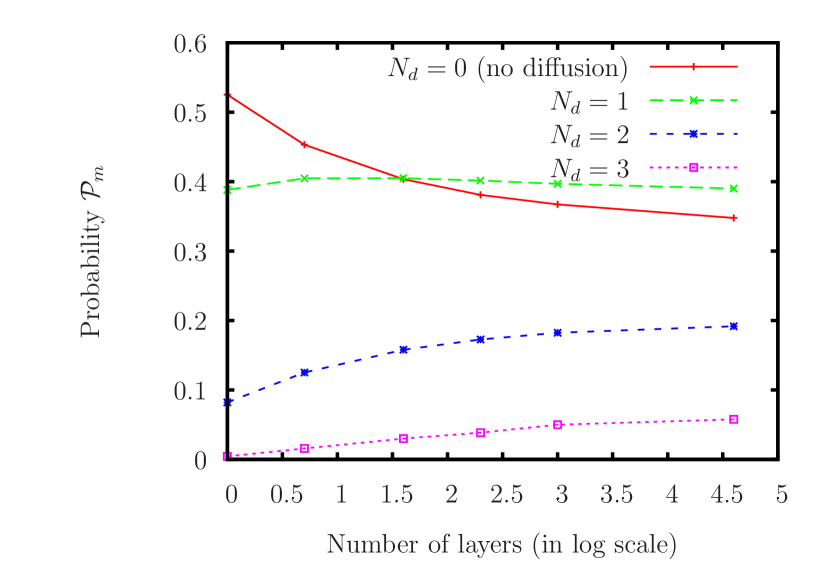
In any given layer, beyond the first, the diffusion probability maximizes at diffusion length one. Thus, one step diffusion has the most dominant effect in determining surface smoothness.
IV Numerical simulation study
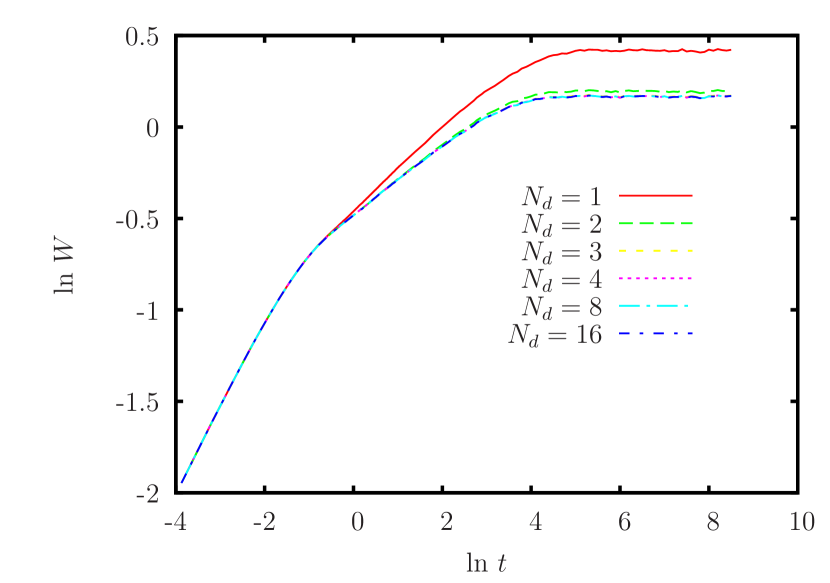
Our simulations for nearest neighbour or one step diffusion include all system sizes studied by Family, and beyond, up to . Limiting our study to the system sizes studied by Family in dimension reproduces his results with great accuracy. The study is then extended to larger diffusion lengths. For diffusion lengths we observe that a small change in the surface properties is discernible up to . The surface roughness decreases slightly, system saturates at an earlier time and has a lower saturation width. Beyond , the interface width versus time plots merge (See Figure 5).
It is important to note that in our simulations of RDSD, two independent random number generators were used, one for selecting the site on the growing surface and, another for depositing the particle with equal probability when left and right diffusions are equally likely. These two random number generators are completely independent and uncorrelated to each other and are generated by linear congruential method knuth ; sedge .
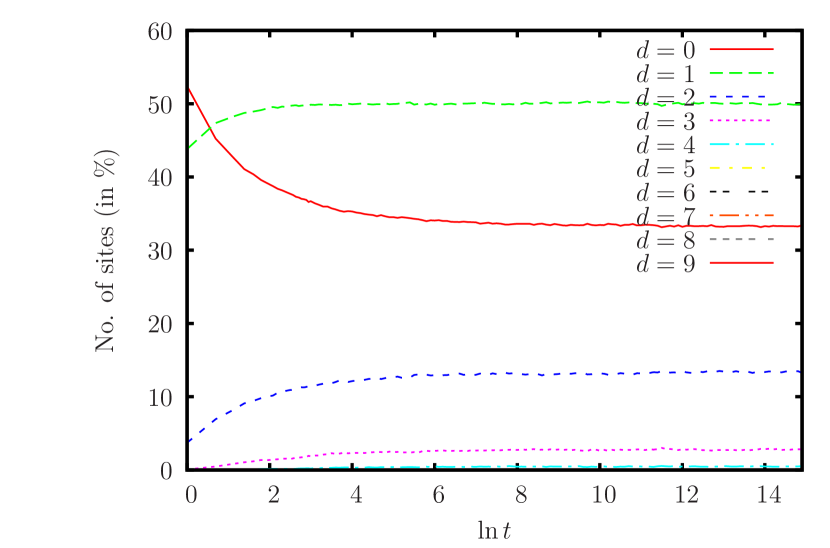
To understand the results of simulation better, we study the maximum possible diffusibility of sites at various stages of growth. The maximum possible diffusibility for a given site is the number of adjacent sites which are successively lower in height (See Figure 1). For RD, we find that beyond sub monolayer region, about of the sites allow diffusion to at least one step or more, implying that an arriving particle if allowed, will diffuse to one or more, successively lower nearest neighbours (See Figure 6). The plots are qualitatively similar to the plots in Figure 3. The percentage of sites with a certain diffusibility, say , is a measure of the probability of diffusion by steps, and the number of layers deposited is a measure of time.
The diffusibility distribution is next studied for Family’s nearest neighbour model where a newly arriving particle diffuses to a lowest nearest neighbour, even when farther lower sites are available. The height profile is studied after saturation, to ascertain the possibility of further diffusion at each site. We observe that in the saturation region, for about of the sites, further diffusion, (beyond nearest neighbour) is possible. With the diffusion length extended to , it is observed that, for only of the sites, diffusion beyond two neighbours is possible. With further increase in , the percentage of sites favouring diffusion greater than the maximum allowed limit set by , diminishes further. These observations agree with the diminishing probabilities appearing in Eq. (6), for increasing . The analytically calculated probabilities and the diffusibility distributions in the simulations explain the small change observed in the growth exponent and saturation width when the diffusion length is increased from to steps. Further increase in diffusion length beyond has no discernible effect on the surface properties obtained from simulations.
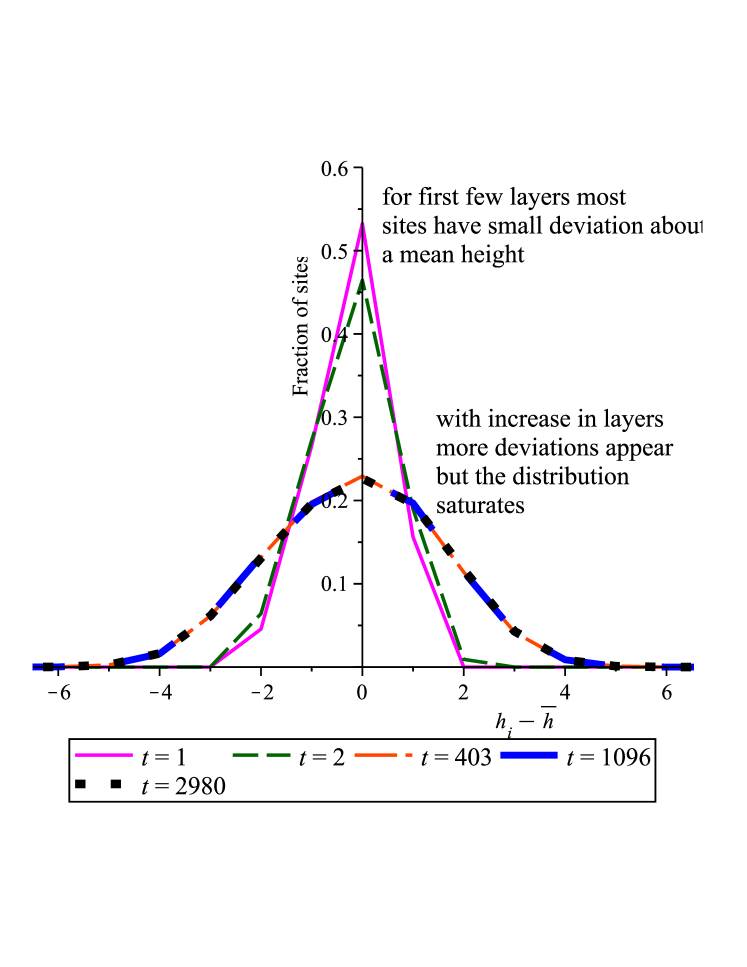
A study of the height profile, shows that in RD, the distribution of the heights of the sites about a mean height, becomes flatter and wider as more layers are deposited, signifying an increase in interface roughness as time progresses. When diffusion is allowed, this flattening and widening process stops beyond a certain time, implying saturation of interface width. In Figure 7, this saturation of the height distribution is shown for diffusion length and system size .
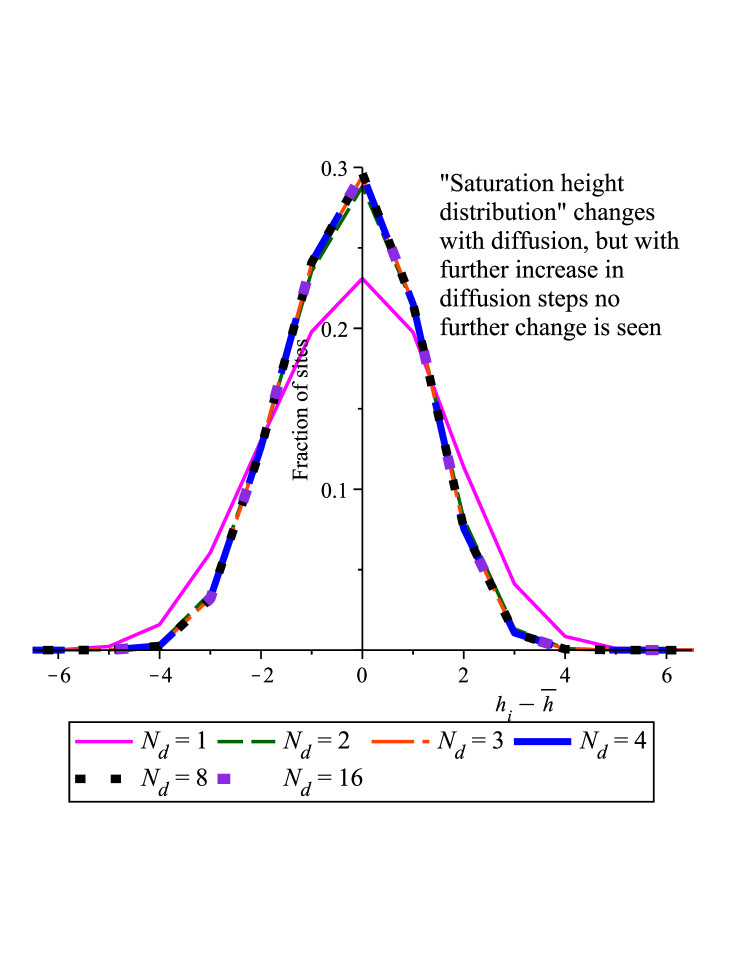
The height distributions after saturation in RDSD models depend on the diffusion length and are plotted for and in Figure 8. It is noted that the saturated height distributions do not change for diffusion length beyond .
In RDSD, the logarithmic graph of interface width versus time, is initially, nearly collinear with the corresponding graph in RD; later it deviates from the linear form and eventually saturates. We estimate the quantitative nature of this deviation. Let us consider a random deposition process with system size , number of particles deposited and defines sub-monolayer deposition. The probability of a site being occupied is and that being empty is . In the sub-monolayer random deposition, a chosen site may allow diffusion provided either one or both its nearest neighbours are empty. Thus, the probability of finding a site where diffusion may be possible is given by which is equal to .
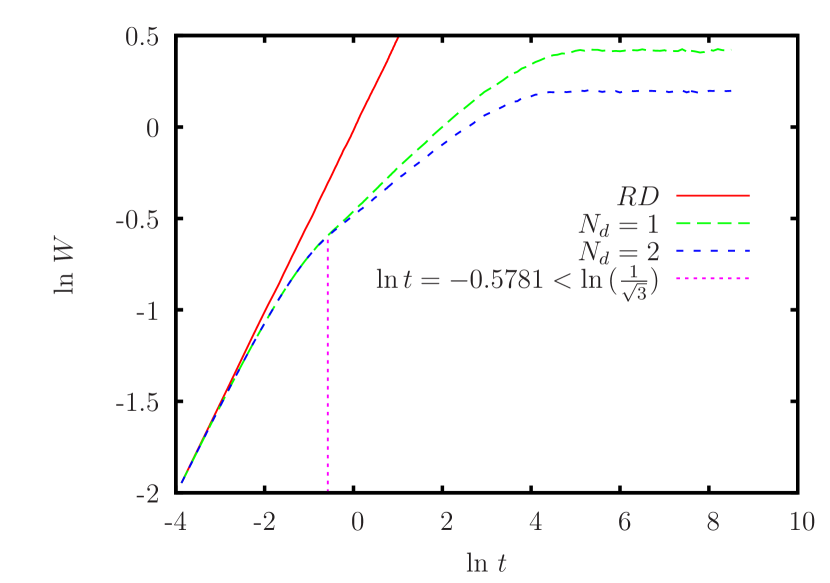
The effects of diffusion are most noticeable when this probability function is maximum. Denoting , it is easily verified that the maximum for the above probability function occurs when . Thus for , , which implies no more than of the sites in the sub-monolayer in RD, allow diffusion. In an actual process, which involves diffusion, we conjecture that the above probability function will reach the maximum value at an even lower value of . Deviation from random behaviour, in an actual process, is visible for and the deviation will become significantly large for .
In Figure 9, the results of an actual simulation for and RD are shown where departure from random behaviour is evident for .
V Discussion and Conclusion
We have shown by means of analytical calculation as well as numerical simulation that in RD, appearance of long staircase-like formations with successive sites having ascending or descending heights, even after several layers of deposition, is improbable. After a few successive descending sites ( or ), one reaches the local minimum of a staircase. Thus, even in the case of RD, maximum diffusibility of sites is limited. However, the differences in the heights of unequal nearest neighbours increase without limit. This is in agreement with the fact that roughness of the interface increases as , even though the maximum diffusibility at any site is limited. It is interesting to note that the number of sites with different diffusibility approaches stable values as time progresses (See Figures 3 and 6).
The study of the effect of diffusion can be extended to systems that allow diffusion through flat regions or even through barriers. They may represent continuation of rolling of classical particles through flat regions due to inertia or quantum barrier penetration, e.g., chemical deposition process even for reactants separated by potential barrier. Further investigation pertaining to the above processes are in progress.
The authors wish to acknowledge the computational facility extended by Center for Mobile Computing and Communication of Jadavpur University. One of the authors (BM) also wishes to acknowledge the financial assistance provided by the West Bengal State Departmental Fellowship (India).
References
- (1) F. Family, J. Phys. A 19(8), L441 (1986).
- (2) F. Family and T. Vicsek, J. Phys. A 18(2), L75 (1985).
- (3) A. L. Barabasi and H. E. Stanley, Fractal Concepts in Surface Growth, Cambridge University Press (1995).
- (4) N. Waki et al, Thin Solid Films 498(1-2), 163 (2006), L. E. Jensen et al, Nano Letters 4(10), 1961 (2004), and references therein.
- (5) Y. Morishita, Y. Nomura, S. Goto and Y. Katayama, Appl. Phys. Lett. 67(17), 2500 (1995), and references therein.
- (6) D. E. Knuth, The Art of Computer Programming, Volume 2, Seminumerical Algorithms, Addison-Wesley, Reading Mass. (1981).
- (7) R. Sedgewick, Algorithms in C++, Addison-Wesley, Reading Mass. (1992).