Accelerating waves in polar coronal holes as seen by EIS and SUMER
Abstract
We present EIS/Hinode & SUMER/SoHO observations of propagating disturbances
detected in coronal lines in inter-plume and plume regions of a polar coronal
hole. The observation was carried out on November 2007 as
JOP196/HOP045 programme.
The SUMER spectroscopic observation gives the information about the fluctuation
in radiance and on both resolved (Doppler shift) and unresolved (Doppler width) line-of-sight
velocities whereas EIS wide slot images detect
fluctuations only in radiance but maximizes the probability of overlapping field of view between
the two instruments.
From distance-time radiance maps, we detect the presence of propagating waves
in a polar inter-plume region with a period of 15 min to 20 min and a propagation
speed increasing from () km s-1 just above the limb, to
() km s-1 around above the limb.
These waves can be traced to originate from a bright region of the on-disk
part of the coronal hole where the propagation speed is in the range of
() km s-1 to () km s-1, with the same
periodicity.
These on-disk bright regions can be visualized as the base of
the coronal funnels. The adjacent plume region also shows the presence of
propagating disturbance with the same range of periodicity but with propagation
speeds in the range of () km s-1 to () km s-1 only.
A comparison between the distance-time radiance map of both regions, indicate
that the waves within the plumes are not observable (may be getting dissipated)
far off-limb whereas this is not the case in the inter-plume region.
A correlation analysis was also performed to find out the time delay between
the oscillations at several heights in the off-limb region, finding results
consistent with those from the analysis of the distance-time maps.
To our knowledge, this result provides first spectroscopic evidence of
acceleration of propagating disturbances in the polar region close to the Sun
(within 1.2 R/R⊙), which provides clues to the understanding of the
origin of these waves.
We suggest that the waves are likely either Alfvénic or fast magnetoacoustic in the
inter-plume and slow magnetoacoustic in plume regions.
This may lead to the conclusion that inter-plumes are preferred channel for
the acceleration of the fast solar wind.
1 Introduction
Coronal holes are regions of cool and low density plasma that, as such, are ‘dark’ at coronal temperatures (Munro & Withbroe, 1972). During solar minima, coronal holes are generally confined to the Sun’s polar regions, while at solar maxima they can also be found at lower latitudes, usually associated with remnant active regions, as so-called ‘equatorial’ coronal holes. The predominantly unipolar magnetic field from coronal hole regions is thought to give rise to the fast solar wind (e.g., Krieger et al., 1973). During solar minimum, Ulysses observations clearly show that the solar wind exhibits two modes of outflow: the fast wind, associated with polar coronal holes, with outflow speeds of km s-1 and the slow wind with outflow speeds of km s-1 associated with equatorial regions (Woch et al., 1997; McComas et al., 2000). However, during solar maxima, low latitude coronal holes also show faster than average solar wind speed upto km s-1 (Zhang et al., 2003). Extreme-ultraviolet images of polar coronal holes reveal the presence of diffuse, spike-like or sheet-like structures called plumes (Bohlin et al., 1975; Ahmad & Withbroe, 1977), which subtend an angle of roughly relative to Sun center at low altitude and expands super-radially with the coronal hole (DeForest et al., 1997). Regions between these structures are termed as inter-plumes. From VUV spectroscopy, plumes are known to be denser and cooler than the surrounding inter-plume regions (e.g., Wilhelm, 2006), while spectral lines are observed to be broader in inter-plumes (i.e., Banerjee et al., 2000b; Giordano et al., 2000; Teriaca et al., 2003). However differences in mass, momentum and energy flux in plumes and in inter-plumes are still not known precisely.
There are several theoretical models which describe the role of MHD waves in the acceleration of the fast solar wind in coronal holes (see review by Ofman, 2005; Cranmer, 2009, and references therein) and inter-plumes are often believed to be the primary site for this acceleration. It is further conjectured that these waves originate from the on-disk bright network regions (Wang et al., 1997; Patsourakos & Vial, 2000; Giordano et al., 2000; Banerjee et al., 2001). A number of studies (Ofman et al., 1997, 2000; Banerjee et al., 2001; Popescu et al., 2005) have reported detection of oscillations in the off-limb regions of polar coronal holes. All of these studies point to the presence of compressional waves, thought to be slow magneto-acoustic waves (DeForest & Gurman, 1998; O’Shea et al., 2006, 2007; Banerjee et al., 2009b). On the other hand, evidence for Alfvén waves propagating into the corona had been reported by Banerjee et al. (1998, 2009a); Dolla & Solomon (2008); Landi & Cranmer (2009) by studying the line width variations with height in polar coronal holes. Recent reports of detections of low-frequency ( 5 mHz), propagating transverse motions in the solar corona (Tomczyk et al., 2007) (from coronagraphic observation) and chromosphere (De Pontieu et al., 2007b) and their relationship with chromospheric spicules observed at the solar limb (De Pontieu et al., 2007a) with the Solar Optical Telescope aboard Hinode (Kosugi et al., 2007) have widened interest in the subject. Recently Jess et al. (2009) have reported detection of torsional Alfvénic motions associated with a large on-disk bright-point group. These waves are believed to be a promising candidate for the heating of the corona and acceleration of the solar wind (Belcher, 1971; Suzuki & Inutsuka, 2005).
Furthermore, it has been suggested that the fast solar wind streams originate from coronal hole funnels and are launched by reconnection at network boundaries, (Tu et al., 2005). Measurements of the outflow speed in the extended corona have been obtained with the Ultraviolet Coronagraph Spectrometer (UVCS) aboard SoHO (e.g., Antonucci et al., 2000; Teriaca et al., 2003; Antonucci et al., 2004; Telloni et al., 2007). Some of these studies concluded that plumes have lower outflow speeds than inter-plume regions (Noci et al., 1997; Giordano et al., 2000; Wilhelm et al., 2000; Patsourakos & Vial, 2000; Teriaca et al., 2003; Raouafi et al., 2007) and, hence, may not contribute significantly to the fast solar wind, whereas some other theoretical and observational studies find higher outflow speeds in plumes than in inter-plume regions for at least some altitudes above the photosphere (Casalbuoni et al., 1999; Gabriel et al., 2003, 2005). These contradictory reports led to the debate on whether plumes or inter-plumes are the preferred source regions for the acceleration of the fast solar wind. This topic is highly debated and still open for further confirmation.
Recently, Banerjee et al. (2009b) reported the detection of propagating slow magnetoacoustic waves with periods between 10 min and 30 min and speed km s-1 to km s-1 above the limb of a polar coronal hole. In their study, the propagating disturbances which are due to radiance perturbations are seen from the limb region up to above the limb. There is no discernible acceleration or deceleration of any individual feature as it propagates. In that study, the oscillations were detected in the two spectral lines of Ne viii 770 Å and Fe xii 195 Å observed with the Solar Ultraviolet Measurements Of Emitted Radiation (SUMER, Wilhelm et al., 1995) aboard the Solar and Heliospheric Observatory (SoHO) and with the EUV imaging spectrometer (EIS, Culhane et al., 2007) aboard Hinode, respectively.
In this paper, we combine again the capabilities of SUMER and EIS to observe the on-disk, limb and far off-limb region of the coronal hole, to search for the origin of waves close to the Sun and study their propagating nature. The plan of the paper is as follows: in section 2, the observations acquired for this study and the data reduction techniques are outlined. In section 3 results of the present study are presented with the distance-time radiance map analysis, power series analysis and time-delay analysis. A discussion of the observational results and a comparison with similar results are taken up in section 4 and finally conclusions are drawn in section 5.
2 Observations
2.1 Data
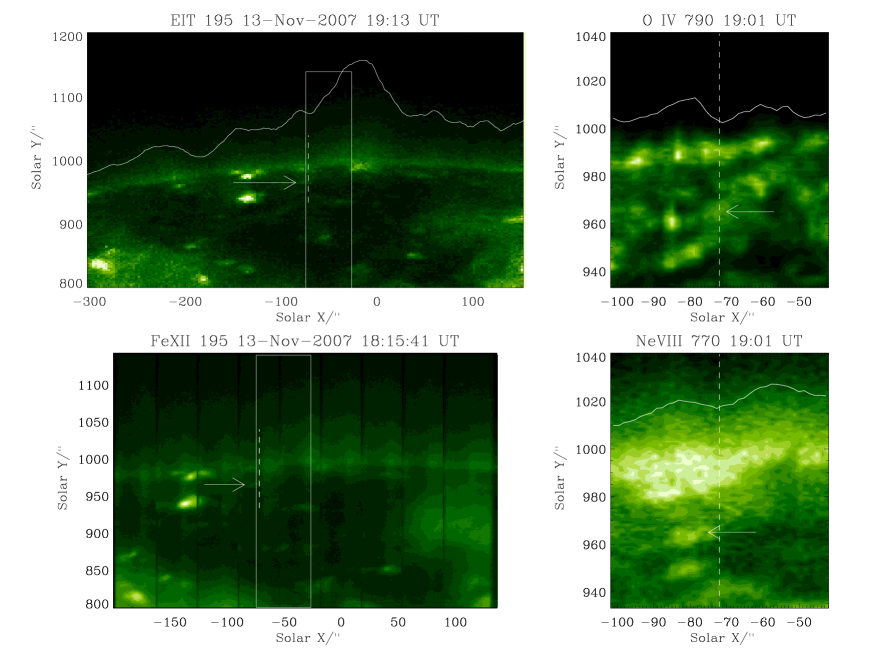
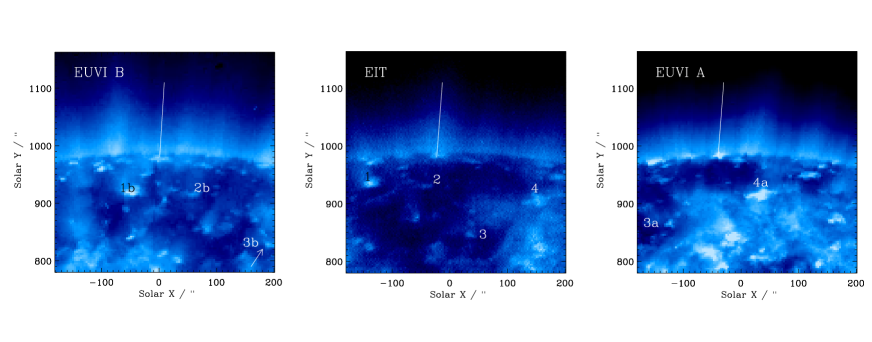
The data analyzed here were obtained on 13th November 2007 during a Hinode/SUMER joint observing campaign as part of the Hinode Observing Programme (HOP) 45/Joint Observing program (JOP) 196. The data consist of time series taken by SUMER and EIS in the north polar coronal hole. For SUMER, the slit was centered on the limb and spectral profiles of the Ne viii 770 Å, O iv 790 Å and S v 786 Å were acquired from 19:13 to 22:15 UTC with an average cadence of 18.12 s in sit and stare mode. The exposure time was 18 s and a total of time-frames were obtained during the observation. For EIS, the wide slot was used to obtain images in several spectral lines in the wavelength ranges of 170 to 210 Å and 250 to 290 Å with spatial resolution of pixel-1 over the time interval from 18:20 to 23:50 UTC. The exposure time was 45 s with an effective cadence of s. A total of time-frames were obtained during the observation. Before the start of the temporal series, raster images were obtained with SUMER and EIS in order to co-align and to provide context. During the observation, the EIS slot covered the quiet Sun south of the coronal hole as well as the on-disk and off-limb parts of the hole (see Figure 1). Table 1 lists the emission lines included in this study from EIS and SUMER, their formation temperature, and the location where the radiance maximum is observed. Top left panel of Figure 1 shows the location of the different slits on an EIT image taken in the Fe xii 195 Å passband. The rectangular box marks the location of the EIS slot while the dashed line gives the location of the SUMER slit. The radiance variation along the solar-X at solar-Y is over-plotted as a white line in arbitrary units and allows us to identify the locations of plume and inter-plume regions within our field of view revealing that the SUMER slit is pointed within an inter-plume region while the EIS slot covers both plume and inter-plume regions. Bottom left shows the context raster obtained by EIS in Fe xii line whereas right panels show the context rasters in O iv (top) and Ne viii (bottom) spectral lines as obtained by SUMER. Figure 2 corresponds to the images obtained by EUVI/STEREO (Howard et al., 2008) for the same region. The angular separation between the two spacecraft, about 40 ∘, allows an estimate of the orientation of the plume.
| Ion | Wavelength (Å) | log Tmax (K) | Limb brightening |
|---|---|---|---|
| He ii | 256.32 | 4.9 | 985″ |
| S v | 786.47 | 5.2 | 988″ |
| O iv | 790.19 | 5.2 | 989″ |
| Mg vi | 270.39 | 5.6 | 990″ |
| Fe viii | 185.21 | 5.6 | 990″ |
| Mg vii | 278.40 | 5.8 | 991″ |
| Si vii | 275.35 | 5.8 | 993″ |
| Ne viii | 770.42 | 5.8 | 993″ |
| Fe x | 190.04 | 6.0 | 993″ |
| Fe xi | 188.23 | 6.1 | – |
| Fe xii | 195.12 | 6.1 | 992″ |
2.2 Data reduction and alignment
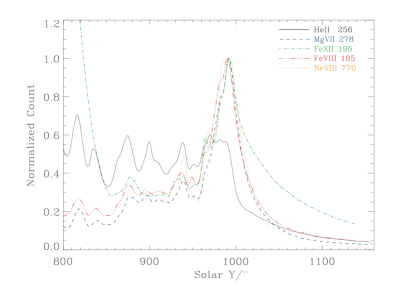
All data have been reduced and calibrated with the standard procedures given in the SolarSoft (SSW)111http://sohowww.nascom.nasa.gov/solarsoft/ library. SUMER data were first decompressed, corrected for response inhomogeneities (flatfield), dead-time, local-gain and for geometrical distortion (de-stretch), using the most recent standard routines (see Wilhelm et al., 1997; Teriaca et al., 1999). After these steps, data still showed a residual pattern from the micro-channel plate structure that was removed using a correction matrix obtained by first averaging all spectral images and then applying a low pass filter to the average. Single Gaussian fitting was used to retrieve the line amplitude, position and line widths of the SUMER spectral lines. Before fitting, a running average over three pixels along the slit and over three consecutive spectra was applied to improve the signal to noise ratio of the SUMER data. Line positions from the fitting are then converted into Doppler shifts by taking as reference the average over the disk part of the image. The observed line widths are corrected for the instrumental profile by applying a de-convolution function taking into account the order of diffraction and the slit width used during the observations (SolarSoft routine ). The raw EIS data were processed by the standard SolarSoft programme which helps in removing detector bias and dark current, hot pixels and cosmic rays and returns absolutely calibrated data. The movement of the slot image on the detector due to thermal variations along the orbit was corrected. The displacement in the dispersion (solar X) direction was obtained by measuring the position of the edge of the Fe xii 195 Å slot image over time. The displacement in the Y direction is taken equal to 2.5 times that in the X direction (Imada, 2010). The validity of the latter assumption was verified by checking the limb Y position vs. time. Finally, EIS data were corrected for the spacecraft jitter by using housekeeping data. Figure 3 shows the variation of the radiance along a vertical strip (about 100 pixels long, centered over the limb) at the overlap position of the EIS slot with the SUMER slit as a function of time (x-t slice). The x-t slice are for data without any correction (top panel), with the orbital effects corrected (middle), and with correction for both orbital and jitter effects (bottom). Data are also affected by passage of the spacecraft through South Atlantic Anomaly (SAA). The regions of affected data appear around 20:35 and 22:15 UTC and, less clearly visible, around 18:55 UTC. These affected portions are replaced by linear interpolation. It should be finally noticed that for wavelet analysis, EIS data have been binned over 5 and 9 pixels in the X and Y-directions, respectively. This will further smooths out any residual jitter or orbital variation. The data from the short wavelength detector were shifted in the Y-direction to compensate the wavelength dependent offset between the short and long wavelength detectors (Kamio & Hara, private communication). To align the different instruments, the SUMER context raster has been chosen as the reference. Hence, the EIS context raster has been cross-correlated with the SUMER raster and an offset of in the E-W direction (solar X), and in the N-S direction (solar Y) was found and corrected for. After the alignment, the pointing of the different instruments are plotted in Figure 1. We have plotted the variation of radiance along the solar-Y at the overlap region of the SUMER slit and EIS slot at solar-X , see Figure 4. This allows us to identify the location of the limb brightening in various spectral lines and their radiance fall-off in the off-limb region. We set the limb position at solar-Y, as identified from the limb brightening of He ii in Figure 4. The radiance peaks of the He ii line for the disk part of the coronal hole are used to identify bright locations (presumably the footpoint of the coronal funnels).

3 Results
In this section we will present detailed analysis of the sit-and-stare observation as recorded by EIS and SUMER. From the context image, Figure 1, it is clear that the SUMER slit is pointing to an inter-plume region and the EIS slot covers both plume and inter-plume region, overlapping with the SUMER slit. Thus, in the inter-plume region, EIS and SUMER will both provide information whereas in the plume region only EIS observations are available. Analysis of the radiance maps (x-t slices), wavelet analysis and correlation analysis will be performed at the two locations as described in the following three subsections.
3.1 Radiance x-t slices
Maps of radiance along the slit vs. time (distance-time map or x-t slices) were built using the SUMER Ne viii integrated line radiance and the EIS Fe xii radiance averaged over in the X direction at the position overlapping with the SUMER slit (which covers the inter-plume region). The resulting maps were then smoothed over min and the background trend of min has been subtracted from each solar-Y pixel along time. In general, similar procedures are applied while doing the Fourier or wavelet analysis of a time series. In the x-t slices, the presence of alternate bright and dark regions indicate the presence of oscillations. Moreover, diagonal or slanted radiance enhancements are signature of propagating disturbances. Thus, from such maps it becomes possible to estimate periods and projected propagation speeds (see e.g. DeForest & Gurman, 1998).
Both the SUMER slit and the EIS slot are centered on the solar limb and, hence, cover the region on-disk as well as off-limb. As the observed region is near to the pole, the effect of solar rotation is very small and amount to less than about per hour at below the limb. We first concentrate our attention to the inter-plume location, around solar-X, probed by both instruments. Figure 5 shows the x-t map of the radiance of the Ne viii spectral line, where the presence of slanted bright and dark region is clearly visible. A disturbance appears from the on-disk bright region around solar-Y (see Figure 1 and 4), and propagates towards the limb. The signature of oscillations are very strong in this bright region. No signature of propagation is visible below solar-Y (the SUMER slit covers down to solar-Y). Hence the assumption that this bright region is the source of these propagating disturbances is justified (Figure 5). The speed of propagation measured from the slope of the enhanced slanted radiance stripes is () km s-1. This average speed is measured up to solar-Y which is very close to the region of limb brightening (see also Figure 4). As the propagation reaches the limb, its speed increases and the enhanced features become more vertical. Up to solar-Y, the measured speed is () km s-1. This change in speed is a clear signature of acceleration of the propagating disturbance. Furthermore, when this propagation reaches beyond the limb brightening height i.e. in the corona, its speed further increases to () km s-1 and the propagation is seen up to solar-Y. Beyond this height the signature of propagation becomes very poor, most likely due to the low signal. The periodicity of the fluctuations is min to 20 min. In Figure 5, the over-plotted white lines follow the slope of the enhancements and are plotted with a periodicity of min. It can be seen that in some places the over-plotted white line do not coincide with the enhanced lanes but it is nevertheless parallel to it. This suggests that even if the periodicity changes within a certain range, the propagation speeds are fairly uniform. There is no clear evidence of propagating disturbances (in terms of velocity fluctuations) in the line-of-sight (LOS) velocity (obtained from Doppler shift) x-t map, although periodicities are revealed by the wavelet analysis (see next section).
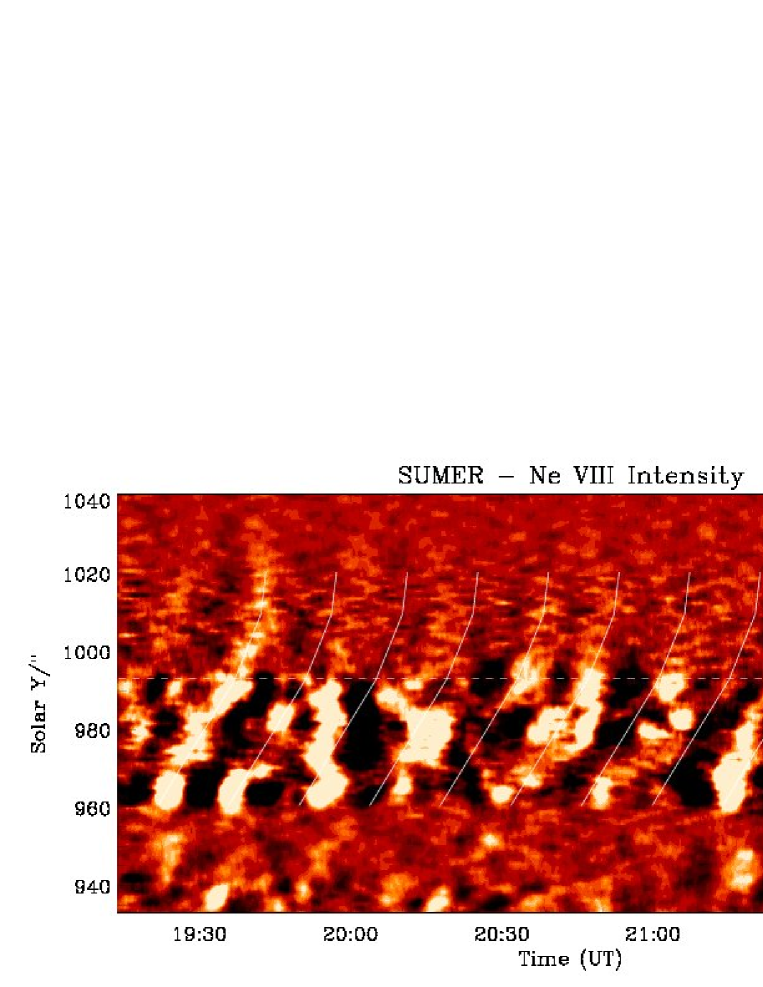
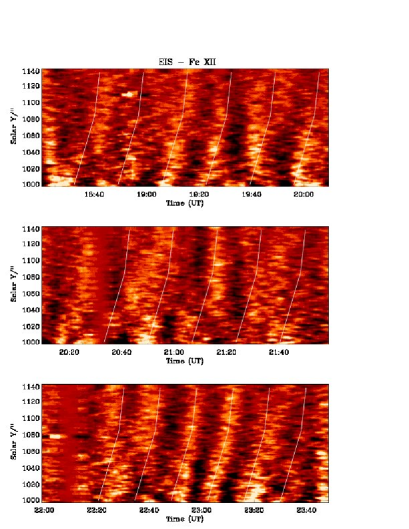
Figure 6 shows the radiance x-t map of the
Fe xii 195 Å line at the same
location (solar-X , inter-plume region).
The image was processed as described above.
The analysis of the x-t map over the coronal hole, reveals that there is no clear signature of
propagating disturbances in the on-disk coronal hole region. These alternate bright and dark
regions are clearly visible only around the limb and far off-limb, hence only these regions are
plotted in Figure 6.
In this map, the propagating disturbances are visible from solar-Y up to the
upper end of the EIS slot at solar-Y.
In this inter-plume region, the disturbance propagates with an average speed of
() km s-1 from solar-Y to solar-Y increasing to an average speed of () km s-1 up to solar-Y,
clearly showing signatures of acceleration. The periodicity of the
fluctuations is in the range of 15 min to 18 min.
Here the over-plotted white lines gives the slope of the enhancements
and are plotted with a periodicity of min. It can be again seen here that in some
places the over-plotted white line do not coincide with the enhanced lanes but is nevertheless
parallel to it as was discussed for the results from the Ne viii line.
Summarizing, observations in the Ne viii spectral line reveal a propagating disturbance
originating in a bright region in the on-disk coronal hole that starts propagating towards the
limb region with speed () km s-1. Near the limb the speed
increases to () km s-1 and reaches () km s-1 in the off-limb region.
A similar speed is measured at the same height in the Fe xii spectral line by EIS.
Hence, both instruments see approximatively the same speed in the same region, which is different
from the result reported by Banerjee et al. (2009b) for a likely plume region, where they find
different propagation speeds in different lines.
Further off-limb, the speed of the propagating disturbance reaches () km s-1
as seen by EIS in the Fe xii spectral line.
Overall, acceleration of propagating
disturbances are observed from on-disk to far off-limb in an inter-plume region simultaneously
by two different instruments on different satellites.
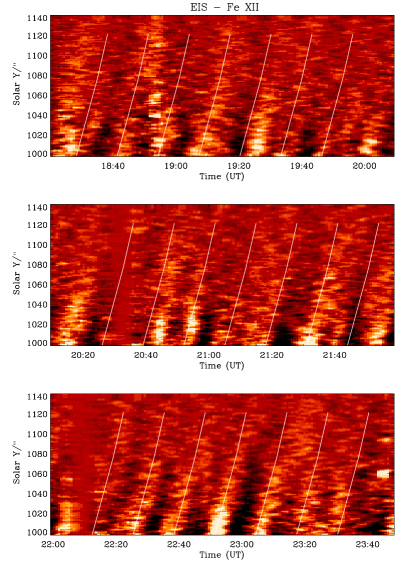
The EIS slot also covers part of a plume and the position around solar-X is selected to represent this region. The processed x-t radiance map is plotted in Figure 7. Also in this case, there is no clear signature of propagating disturbances in the on-disk coronal hole region. These alternate bright and dark regions are clearly visible only at the limb and off-limb, hence again only these regions are plotted in Figure 7. In this map, the propagating disturbances are visible from solar-Y up to solar-Y. In this plume region the disturbance propagates with a speed of () km s-1 from solar-Y to solar-Y and with () km s-1 up to solar-Y. Beyond this height the map becomes diffuse and there is no clear signature of propagation. Although this may be interpretated in terms of wave dissipation, this lack of signature at greater heights may be simply due to merging with the background signal.
3.2 Analysis of oscillations
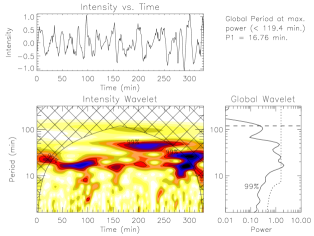
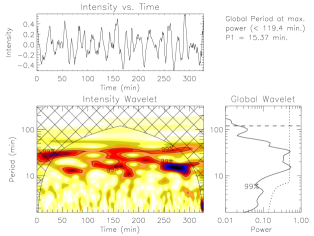
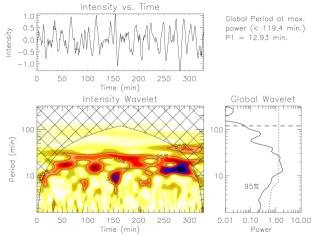
In this subsection, in order to study the detailed properties of the propagating disturbances as seen in the enhanced radiance x-t maps (Figures 5, 6 and 7), we make use of wavelet analysis and focus on individual locations in the on-disk and off-limb corona. The full SUMER time series is used to detect oscillations in the radiance, Doppler shift as well as in the Doppler width of the Ne viii spectral line at several locations. The bright location is identified on-disk using the maximum radiance seen in He ii Å by EIS. At several off-limb locations there is sufficient signal to noise to detect oscillations with a high confidence level. Figures 8, 9, 10 & 11 show examples of oscillations measured in the polar region at fixed solar-X (which corresponds to the inter-plume region) and at several solar-Y locations: (on-disk), (off-limb, but close to the limb) and (far off-limb), as mentioned in the figure caption. On the other hand, Figure 12 shows oscillation measured at solar-X (which corresponds to the plume region) and solar-Y (off-limb). In these figures the top panel shows the variation of the radiance (hereafter the term radiance will be used for trend subtracted integrated line radiance) with time. Details on the wavelet analysis, which provides information on the temporal variation of a signal, are described in Torrence & Compo (1998). For the convolution with the time series in the wavelet transform, the Morlet function is choosen. The oscillations shown in the upper panel had their background trend removed by subtracting from the original time series a point ( min) and point ( min) running average for SUMER and EIS data, respectively. In the wavelet spectrum, the cross-hatched regions are locations where estimates of oscillation period become unreliable which is called as cone-of-influence (COI). As a result of the COI, the maximum measurable period is shown by a horizontal dashed line in the global wavelet plots, which are obtained by taking the mean over the wavelet time domain. This global wavelet is very similar to the Fourier transform as both are giving the distribution of power with respect to period or frequency. Whenever the Fourier spectrum is smoothed, it approaches the global wavelet spectrum. The period at the location of the maximum in the global wavelet spectrum is printed above the global wavelet spectrum.
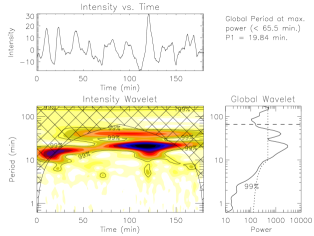
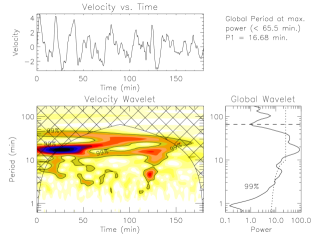
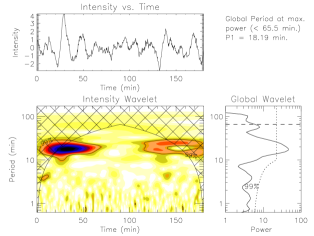
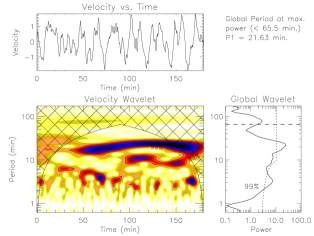
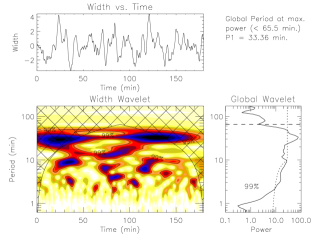
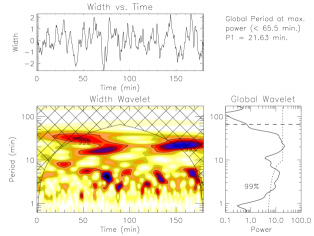
From the x-t map analysis (Figure 5) it was seen that outward propagating disturbances at the inter-plume location (solar-X) originate from a bright on-disk region at solar-Y. As this region has been covered by the SUMER slit, we have information about the radiance, Doppler shift as well as the Doppler width of the Ne viii spectral line. Time series have been obtained at this bright location by taking a average over solar-Y and then wavelet power spectra have been plotted for both radiance and LOS velocity in Figure 8. There is a clear presence of min to 20 min periodicity in both radiance and velocity. Going to the off-limb inter-plume at solar-Y, time series in both radiance and Doppler velocity were obtained by averaging over in the Y direction (to increase the signal to noise ratio). Also from the wavelet power spectra (Figure 9), a clear presence of min to 20 min periodicity in both radiance and doppler shift was found. Wavelet power spectra of the Doppler width time series were also obtained at the two locations and are shown in Figure 10. The analysis reveals a periodicity similar to that observed in radiance and in Doppler shift.
EIS Fe xii time series have been produced by averaging over and in the X and Y-direction, respectively. Then a wavelet analysis was performed at two inter-plume locations; one near the limb (solar-Y) and the other further off-limb (solar-Y). The wavelet power spectra are shown in Figure 11. Both heights show periodicity between 15 min and 20 min, consistent with the results from the x-t map (see Figure 6). Furthermore, these periods are consistent with the periods obtained from Ne viii. In summary, again it can be concluded that the propagating disturbance, which originates from the on-disk bright region, propagates off-limb and in the far off-limb inter-plume region.
In order to check the periods of propagating disturbances in the plume region, the wavelet analysis has been carried out also at location solar-Y and solar-X by averaging over in solar-Y and in solar-X, (see Figure 12). Also in this case, the period of propagation, 12 min to 20 min, is consistent with the x-t map in Figure 7. However, as seen from the x-t map, these disturbances are not visible at greater heights above the limb.
3.3 Correlation Analysis
In the earlier subsections we presented results from the Ne viii and
Fe xii lines only. Propagation properties of waves can also be studied
by correlation analysis.
First, we focus our attention on the on-disk bright region, where we
expect the waves seen at the inter-plume location to originate.
At this location (Y), we find clear presence of
oscillations in different lines as recorded
by SUMER and EIS (as tabulated in Table. 1).
For the on-disk study, we will concentrate on the correlation between different lines as recorded by SUMER
and EIS while for the off-limb study we will calculate correlation coefficients between different heights
as recorded by the same Fe xii line.
The correlations between the time series from two different lines
have been obtained using the IDL routine at different time delays between the two series.
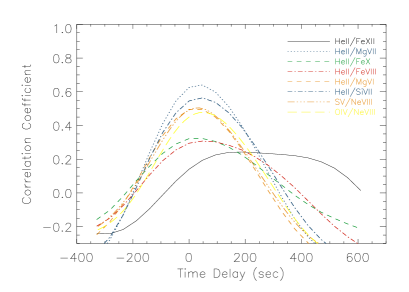
Correlation coefficients have been calculated for six line pairs and are plotted in the left panel of
Figure 13. The time resolution is about 18 s for SUMER and 47 s for EIS
(governed by the respective cadences).
The time delay at peak of correlation can be considered as the time delay between the oscillations in the
two lines forming the pair.
It can be seen that the level of correlation and the time delay are in inverse proportion, which means
that the correlation is higher for the lines having smaller temperature separation and, because in
coronal hole the temperature changes mainly as a function of height, smaller time delay.
The correlation between He ii and Fe xii is smaller and shows the largest time delay whereas the
correlation between He ii and Fe x is comparatively high and has less time delay.
If there would be height information available, then it would
be possible to estimate the propagation speed of oscillations from one height to another.
The radiance variation of several lines with respect to
solar-Y has been plotted in Figure 4 at solar-X. As described in
O’Shea et al. (2006), the difference in the
peak positions provides an estimate of the differences in the formation heights between different lines at
that particular time and condition.
Hence, using the correlation technique, the time delay between two lines
can be obtained and using the limb brightening technique, the formation
height difference can be estimated for a line pair.
The results obtained have been summarized in Table 2.
Due to the relatively poor temporal resolution, uncertainties in time delay measurements
are large. Hence, for the on-disk bright region,
results obtained here can only be used to infer that waves are propagating
from lower to higher heights in the solar atmosphere.
| Line- | log Tmax | Correlation | Time delay1 | Height diff.2 |
|---|---|---|---|---|
| pair | (K) | co-efficient | (s) | (km) |
| He ii/Fe xii | 4.9/6.1 | 0.242954 | 188 | 4509 |
| He ii/Fe xi | 4.9/6.1 | 0.250901 | 94 | – |
| He ii/Fe x | 4.9/6.0 | 0.322859 | 47 | 5628 |
| He ii/Fe viii | 4.9/5.6 | 0.307703 | 47 | 3180 |
| He ii/Si vii | 4.9/5.8 | 0.564139 | 47 | 5363 |
| He ii/Mg vii | 4.9/5.8 | 0.640592 | 47 | 4104 |
| He ii/Mg vi | 4.9/5.6 | 0.496354 | 47 | 3654 |
| S v/Ne viii | 5.2/5.8 | 0.504659 | 36 | 3647 |
| O iv/Ne viii | 5.2/5.8 | 0.477825 | 54 | 2917 |
1Limited by time resolution defind by effective cadence of respective instruments. 2Limited by spatial resolution of respective instruments, km.
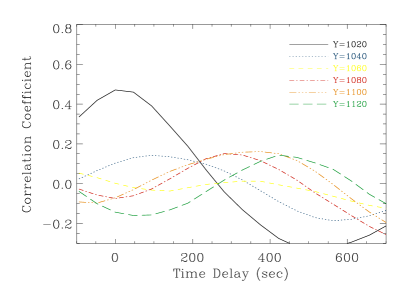
A similar correlation analysis is applied to the offlimb inter-plume region at X using data from the same line, Fe xii, but at different heights with respect to solar-Y. The results are plotted in the right panel of Figure 13. The time resolution is about s, the EIS cadence. Also in this case, the level of correlations and time delays are in inverse proportion as expected. The measured time delays are plotted against solar-Y in left panel of Figure 14. The continuous line corresponds to a second order polynomial fit applied to the data points (as marked by asterisks). The error bar on these time delays is obtained from the Half Width Half Maximum (HWHM) of the particular correlation plot. The dotted line corresponds to the fit to the slanted radiance ridges in the x-t maps (white lines of Figure 6). The figure indicates that the travel time is decreasing with height indicating an acceleration, as was seen from the x-t map of Fe xii in Figure 6. This Figure provides an independent estimate of the acceleration.
The Alfvén wave speed through the quasi-static corona can be calculated from the expression . We use the density profile given by Teriaca et al. (2003) and take into account the superradial fall of the magnetic field with height according to Kopp & Holzer (1976), with a base magnetic field of G. For comparison purpose, the Alfvén wave speed is also calculated by assuming a constant magnetic field of G with height. The measured time delays at different Solar-Y in inter-plume region are then compared with the travel time for a theoretical Alfvén mode. The Alfvénic time delays obtained assuming a magnetic field constant with height and expanding according to Kopp & Holzer (1976), are plotted, respectively, as a dashed and a dot-dashed line in the left panel of Figure 14. To estimate the propagation speed, we plot right panel of Figure 14 which shows the variation of propagation speed with respect to the height in the solar atmosphere. The speed is calculated by the time derivative of the fit to the measured time delays shown in the left panel of Figure 14 and is plotted as a continuous line. This speed is compared with the theoretically calculated propagation speed of Alfvén modes, plotted as dot-dashed and dashed line, respectively, for the expanding and constant field case. It can be seen that the measured propagation speed is roughly consistent with being Alfvénic if we assume a field of 0.65 G at the base. From the figure it can be seen that near the limb and off-limb, the speed of propagation is about 130 km s-1, increasing to more than 220 km s-1 far off-limb, close to the speeds obtained from the x-t map in Figure 6. It also appears that above a certain height (Y ) the speed increases more rapidly. These results might indicate that physics of the propagation might also change at these heights.


4 Discussion
Our results show the propagation of disturbances from an on-disk region to the off-limb corona within inter-plume region. These disturbances appear to originate from an on-disk bright location, presumably the footpoint of a coronal funnel, around solar-Y (see Figure 5). No signature of propagation is visible below solar-Y. The propagation speed, as measured from the x-t map (distance-time map) of Ne viii and Fe xii line radiance, increases with height. Outward propagating disturbances are also recorded in a plume structure within the EIS field of view, but the acceleration is almost zero. Furthermore, the disturbances become diffuse far off-limb as seen from the EIS Fe xii x-t map. From wavelet analysis these disturbances have a periodicity in the range of 15 min to 20 min in both regions and the periodicity is seen almost over the whole duration of observation, although the power is increasing and decreasing with time. A correlation analysis of the light curves of different spectral line-pairs in the on-disk bright region reveals larger time-delays for line pairs with the larger difference in formation height (inferred from the limb brightening curves), indicating upward propagation. This upward propagation indicates that these waves are generated somewhere lower in the atmosphere, probably in the chromosphere, since these are also seen in He ii and then propagate upward towards the off-limb region. In the off-limb region, cross-correlation between light curves from the same spectral line (Fe xii) but obtained at different heights above the limb shows time-delays indicating outward propagation, in agreement with the results from the analysis of the x-t maps.
The propagating disturbances, clearly visible in the inter-plume region in the Ne viii radiance x-t map, are not visible in the Ne viii Doppler shift and width x-t maps. However, the wavelet analysis shows that both Doppler shift and width oscillations are present in the on-disk bright region and near off-limb with approximately the same periodicity as seen in radiance (see Figures 8, 9, & 10), and they are also mostly in phase. The presence of oscillations in radiance and both resolved (Doppler shift) and unresolved (Doppler width) velocities with approximately the same period, is evidence of propagating waves with at least a compressional component in the inter-plume lanes. The measured speed of propagation of these waves from the Ne viii line is () km s-1, () km s-1 and () km s-1 in the on-disk region, near the limb and off-limb respectively. Fe xii data shows that the propagation speed further increases to () km s-1 in the far off-limb region of inter-plume. In the plume region, instead, the observed off-limb propagation speed increases from () km s-1 to only () km s-1 far off-limb. Beyond this point the radiance disturbances become diffuse. The increase in propagation speed is small and the acceleration is negligible within the given uncertainties.
The propagation speed becomes supersonic ( km s-1, for Fe xii line formation temperature) far off-limb in the inter-plume region. Moreover, near the limb region, the Ne viii and Fe xii lines, which are in phase, show nearly equal propagation speeds for some overlapping region despite having quite different formation temperatures, suggesting that these propagating disturbances are temperature independent. This, together with the presence of oscillations in Doppler width and shift, may suggest that these waves are Alfvénic in nature. Pure Alfvén waves do not cause any density perturbation and thus would not cause any radiance fluctuation. However, in the real case of waves propagating in a density stratified atmosphere, non-linear effect may also cause small density fluctuations leading to radiance changes of a few percent (Tu & Marsch, 1995; Kaghashvili et al., 2009). Moreover, oscillations in the observed line widths can be caused by torsional Alfvén waves (Zaqarashvili, 2003; Van Doorsselaere et al., 2008). Hence, interpretation of these propagating disturbances in terms of Alfvén waves appears quite reasonable.
Furthermore, observed radiance oscillations can also be explained as a line-of-sight effect of entirely incompressible MHD waves as described in Cooper et al. (2003). In this model, when observed at an angle to the direction of propagation, the wave-induced deformation in a coronal loop causes brightness variations. This is because the amount of optically thin emitting plasma along the line-of-sight changes as a function of time. Thus, the radiance variations can be produced even by entirely incompressible MHD waves.
Conversely, the measured propagation speeds are also consistent with the fast magnetoacoustic mode of propagation within the error bars of the propagation speeds in Ne viii and Fe xii lines and explains the observed radiance oscillations due to its compressible nature. Hence, interpretation of these propagating disturbances in terms of fast magnetoacoustic waves also appears reasonable.
It should be noted that it is always the apparent propagation speed in the plane of the sky that is measured. The structures carrying the waves most likely form an angle with the plane of the sky and, thus, these propagation speeds are always a lower limit. However, in the case of the inter-plume region, we trace the origin of the wave to an on-disk bright region located at X and Y. Assuming roughly radial propagation, this would imply an angle of with the plane of sky, leading to a difference between apparent and real propagation speed of less than , a negligible quantity. In the case of the plume, a careful inspection of Figure 2 shows that the plume is rooted very close to the visible limb and is lying close to the plane of the sky. This suggests that in this case the difference between apparent and real propagation speed is likely very small.
The kind of oscillations which are presented here are very similar to other
already reported in the literature (e.g. DeForest & Gurman, 1998; Ofman et al., 2000; Banerjee et al., 2000a, 2001; Morgan et al., 2004; O’Shea et al., 2006, 2007; Gupta et al., 2009; Banerjee et al., 2009b)
in on-disk and off-limb regions of coronal holes observed with different
instruments. Banerjee et al. (2001) have reported oscillations in
on-disk network regions and in inter-plume regions similar to those reported here.
Gupta et al. (2009) have calculated the speed of propagation in the
on-disk bright region using the statistical technique and the measured speed
were of the same order as reported here.
All these observations indicate the presence of propagating MHD waves.
Recently, McIntosh et al. (2010) detected propagating
features in polar plumes using STEREO observations.
These authors have interpreted these features in terms of high speed jets of
plasma traveling along the structures which repeat quasi-periodically, with
repeat-times ranging from 5 min to 25 min. This would be contrary to the widely
held interpretation that this observational phenomenon is due to compressive waves.
One should also consider Doppler dimming results from UVCS and SUMER aboard
SoHO, which shows that velocities above 100 km s-1 are reached only above
1.5 R/R⊙ in either plumes or inter-plumes
(Teriaca et al., 2003; Gabriel et al., 2003, 2005).
To our knowledge, this is the first time that a signature of accelerating Alfvénic waves or fast magnetoacoustic waves originating in an on-disk bright region has been observed in near and far off-limb regions within 1.2 R/R⊙. In inter-plume region, the disturbance is seen propagating up along the whole EIS slot length whereas in the plume region, it becomes diffuse far off-limb. In inter-plume region the wave propagates farther in the corona with high acceleration whereas in plume region it may have been dissipated in the off-limb region. However, the lack of signature at greater heights in the plume may be simply due to merging with the background signal. This suggests that inter-plume regions may be the preferred channel for the acceleration of the fast solar wind. This conclusion is in agreement with earlier reports (Wang et al., 1997; Patsourakos & Vial, 2000; Giordano et al., 2000; Banerjee et al., 2001; Teriaca et al., 2003).
5 Conclusion
Analysis of Ne viii and Fe xii radiance x-t maps reveal the presence of outward propagating radiance disturbances in the off-limb and near off-limb region of inter-plume with periodicities of about 15 min to 20 min. From the SUMER Ne viii line radiance x-t map, one can infer that the waves originate from a bright location (presumably the footpoint of a coronal funnel) and propagate towards the limb with a speed () km s-1. Around the limb the speed has increased to () km s-1, reaching () km s-1 off-limb. Further far off-limb, the speed of the propagation becomes () km s-1 as seen in the EIS Fe xii line. Similar propagating disturbances are also seen in the plume region but with negligible acceleration, if any. The waves are not visible far off-limb, suggesting that they may be dissipated or, more simply, merge into the background. The waves as recorded in the inter-plume regions are either Alfvénic or fast magnetoacoustic in nature whereas the one seen in plumes are more likely slow magnetoacoustic type. Tu et al. (2005) have conjectured that the solar wind outflow is launched by reconnection at network boundaries between open flux lines and intra-network closed loops. The intra-network closed loops are pushed by supergranular convection towards the network triggering reconnection. This scenario is consistent with our identification of the origin of the propagating disturbances in inter-plume region with an on-disk bright region. These results support the view that the inter-plume regions are the preferred channel for the acceleration of the fast solar wind.
References
- Ahmad & Withbroe (1977) Ahmad, I. A., & Withbroe, G. L. 1977, Sol. Phys., 53, 397
- Antonucci et al. (2000) Antonucci, E., Dodero, M. A., & Giordano, S. 2000, Sol. Phys., 197, 115
- Antonucci et al. (2004) Antonucci, E., Dodero, M. A., Giordano, S., Krishnakumar, V., & Noci, G. 2004, A&A, 416, 749
- Banerjee et al. (2000a) Banerjee, D., O’Shea, E., & Doyle, J. G. 2000a, Sol. Phys., 196, 63
- Banerjee et al. (2001) Banerjee, D., O’Shea, E., Doyle, J. G., & Goossens, M. 2001, A&A, 380, L39
- Banerjee et al. (2009a) Banerjee, D., Pérez-Suárez, D., & Doyle, J. G. 2009a, A&A, 501, L15
- Banerjee et al. (2000b) Banerjee, D., Teriaca, L., Doyle, J. G., & Lemaire, P. 2000b, Sol. Phys., 194, 43
- Banerjee et al. (1998) Banerjee, D., Teriaca, L., Doyle, J. G., & Wilhelm, K. 1998, A&A, 339, 208
- Banerjee et al. (2009b) Banerjee, D., Teriaca, L., Gupta, G. R., Imada, S., Stenborg, G., & Solanki, S. K. 2009b, A&A, 499, L29
- Belcher (1971) Belcher, J. W. 1971, ApJ, 168, 509
- Bohlin et al. (1975) Bohlin, J. D., Sheeley, N. R., & Tousey, R. 1975, in Space Research XV, ed. M. J. Rycroft, 651–656
- Casalbuoni et al. (1999) Casalbuoni, S., Del Zanna, L., Habbal, S. R., & Velli, M. 1999, J. Geophys. Res., 104, 9947
- Cooper et al. (2003) Cooper, F. C., Nakariakov, V. M., & Tsiklauri, D. 2003, A&A, 397, 765
- Cranmer (2009) Cranmer, S. R. 2009, Living Reviews in Solar Physics, 6, 3
- Culhane et al. (2007) Culhane, J. L., et al. 2007, Sol. Phys., 243, 19
- De Pontieu et al. (2007a) De Pontieu, B., et al. 2007a, PASJ, 59, 655
- De Pontieu et al. (2007b) —. 2007b, Science, 318, 1574
- DeForest & Gurman (1998) DeForest, C. E., & Gurman, J. B. 1998, ApJ, 501, L217+
- DeForest et al. (1997) DeForest, C. E., Hoeksema, J. T., Gurman, J. B., Thompson, B. J., Plunkett, S. P., Howard, R., Harrison, R. C., & Hassler, D. M. 1997, Sol. Phys., 175, 393
- Dolla & Solomon (2008) Dolla, L., & Solomon, J. 2008, A&A, 483, 271
- Gabriel et al. (2005) Gabriel, A. H., Abbo, L., Bely-Dubau, F., Llebaria, A., & Antonucci, E. 2005, ApJ, 635, L185
- Gabriel et al. (2003) Gabriel, A. H., Bely-Dubau, F., & Lemaire, P. 2003, ApJ, 589, 623
- Giordano et al. (2000) Giordano, S., Antonucci, E., Noci, G., Romoli, M., & Kohl, J. L. 2000, ApJ, 531, L79
- Gupta et al. (2009) Gupta, G. R., O’Shea, E., Banerjee, D., Popescu, M., & Doyle, J. G. 2009, A&A, 493, 251
- Howard et al. (2008) Howard, R. A., et al. 2008, Space Science Reviews, 136, 67
- Imada (2010) Imada, S. 2010, in preparation
- Jess et al. (2009) Jess, D. B., Mathioudakis, M., Erdélyi, R., Crockett, P. J., Keenan, F. P., & Christian, D. J. 2009, Science, 323, 1582
- Kaghashvili et al. (2009) Kaghashvili, E. K., Quinn, R. A., & Hollweg, J. V. 2009, ApJ, 703, 1318
- Kopp & Holzer (1976) Kopp, R. A., & Holzer, T. E. 1976, Sol. Phys., 49, 43
- Kosugi et al. (2007) Kosugi, T., et al. 2007, Sol. Phys., 243, 3
- Krieger et al. (1973) Krieger, A. S., Timothy, A. F., & Roelof, E. C. 1973, Sol. Phys., 29, 505
- Landi & Cranmer (2009) Landi, E., & Cranmer, S. R. 2009, ApJ, 691, 794
- McComas et al. (2000) McComas, D. J., et al. 2000, J. Geophys. Res., 105, 10419
- McIntosh et al. (2010) McIntosh, S. W., Innes, D. E., de Pontieu, B., & Leamon, R. J. 2010, A&A, 510, L2+
- Morgan et al. (2004) Morgan, H., Habbal, S. R., & Li, X. 2004, ApJ, 605, 521
- Munro & Withbroe (1972) Munro, R. H., & Withbroe, G. L. 1972, ApJ, 176, 511
- Noci et al. (1997) Noci, G., et al. 1997, Advances in Space Research, 20, 2219
- Ofman (2005) Ofman, L. 2005, Space Science Reviews, 120, 67
- Ofman et al. (1997) Ofman, L., Romoli, M., Poletto, G., Noci, G., & Kohl, J. L. 1997, ApJ, 491, L111+
- Ofman et al. (2000) —. 2000, ApJ, 529, 592
- O’Shea et al. (2006) O’Shea, E., Banerjee, D., & Doyle, J. G. 2006, A&A, 452, 1059
- O’Shea et al. (2007) —. 2007, A&A, 463, 713
- Patsourakos & Vial (2000) Patsourakos, S., & Vial, J.-C. 2000, A&A, 359, L1
- Popescu et al. (2005) Popescu, M. D., Banerjee, D., O’Shea, E., Doyle, J. G., & Xia, L. D. 2005, A&A, 442, 1087
- Raouafi et al. (2007) Raouafi, N., Harvey, J. W., & Solanki, S. K. 2007, ApJ, 658, 643
- Suzuki & Inutsuka (2005) Suzuki, T. K., & Inutsuka, S. 2005, ApJ, 632, L49
- Telloni et al. (2007) Telloni, D., Antonucci, E., & Dodero, M. A. 2007, A&A, 472, 299
- Teriaca et al. (1999) Teriaca, L., Banerjee, D., & Doyle, J. G. 1999, A&A, 349, 636
- Teriaca et al. (2003) Teriaca, L., Poletto, G., Romoli, M., & Biesecker, D. A. 2003, ApJ, 588, 566
- Tomczyk et al. (2007) Tomczyk, S., McIntosh, S. W., Keil, S. L., Judge, P. G., Schad, T., Seeley, D. H., & Edmondson, J. 2007, Science, 317, 1192
- Torrence & Compo (1998) Torrence, C., & Compo, G. P. 1998, Bulletin of the American Meteorological Society, 79, 61
- Tu & Marsch (1995) Tu, C., & Marsch, E. 1995, Space Science Reviews, 73, 1
- Tu et al. (2005) Tu, C.-Y., Zhou, C., Marsch, E., Xia, L.-D., Zhao, L., Wang, J.-X., & Wilhelm, K. 2005, Science, 308, 519
- Van Doorsselaere et al. (2008) Van Doorsselaere, T., Nakariakov, V. M., & Verwichte, E. 2008, ApJ, 676, L73
- Wang et al. (1997) Wang, Y.-M., et al. 1997, ApJ, 484, L75+
- Wilhelm (2006) Wilhelm, K. 2006, A&A, 455, 697
- Wilhelm et al. (2000) Wilhelm, K., Dammasch, I. E., Marsch, E., & Hassler, D. M. 2000, A&A, 353, 749
- Wilhelm et al. (1995) Wilhelm, K., et al. 1995, Sol. Phys., 162, 189
- Wilhelm et al. (1997) —. 1997, Sol. Phys., 170, 75
- Woch et al. (1997) Woch, J., Axford, W. I., Mall, U., Wilken, B., Livi, S., Geiss, J., Gloeckler, G., & Forsyth, R. J. 1997, Geophys. Res. Lett., 24, 2885
- Zaqarashvili (2003) Zaqarashvili, T. V. 2003, A&A, 399, L15
- Zhang et al. (2003) Zhang, J., Woch, J., Solanki, S. K., von Steiger, R., & Forsyth, R. 2003, Journal of Geophysical Research (Space Physics), 108, 1144