11email: pgmartin@cita.utoronto.ca 22institutetext: Department of Astronomy & Astrophysics, University of Toronto, 50 St. George Street, Toronto, ON M5S 3H4, Canada 33institutetext: Institut d’ Astrophysique Spatiale, UMR8617, Université Paris-Sud, F-91405, Orsay, France 44institutetext: Centre d’Etude Spatiale du Rayonnement, CNRS, Toulouse, France 55institutetext: INAF-Istituto Fisica Spazio Interplanetario, Roma, Italy 66institutetext: NASA Herschel Science Center, Caltech, Pasadena, CA 77institutetext: School of Physics, University of Exeter, Stocker Road, Exeter, EX4 4QL, UK 88institutetext: ASI Science Data Center, I-00044 Frascati (Roma), Italy 99institutetext: Departement de Physique, Université Laval, Québec, Canada 1010institutetext: Dipartimento di Fisica, Universitá di Roma 2 “Tor Vergata”, Roma, Italy 1111institutetext: Spitzer Science Center, California Institute of Technology, Pasadena, CA 1212institutetext: Dipartimento di Fisica, Universitá del Salento, Lecce, Italy 1313institutetext: Dipartimento di Fisica, Universitá di Roma 1 “La Sapienza”, Roma, Italy
Direct Estimate of Cirrus Noise in Herschel Hi-GAL Images ††thanks: Herschel is an ESA space observatory with science instruments provided by European-led Principal Investigator consortia and with important participation from NASA.
In Herschel images of the Galactic plane and many star forming regions, a major factor limiting our ability to extract faint compact sources is cirrus confusion noise, operationally defined as the “statistical error to be expected in photometric measurements due to confusion in a background of fluctuating surface brightness.” The histogram of the flux densities of extracted sources shows a distinctive faint-end cutoff below which the catalog suffers from incompleteness and the flux densities become unreliable. This empirical cutoff should be closely related to the estimated cirrus noise and we show that this is the case. We compute the cirrus noise directly, both on Herschel images from which the bright sources have been removed and on simulated images of cirrus with statistically similar fluctuations. We connect these direct estimates with those from power spectrum analysis, which has been used extensively to predict the cirrus noise and provides insight into how it depends on various statistical properties and photometric operational parameters. We report multi-wavelength power spectra of diffuse Galactic dust emission from Hi-GAL observations at 70 to 500 within Galactic plane fields at and . We find that the exponent of the power spectrum is about . At , the amplitude of the power spectrum increases roughly as the square of the median brightness of the map and so the expected cirrus noise scales linearly with the median brightness. For a given region, the wavelength dependence of the amplitude can be described by the square of the spectral energy distribution (SED) of the dust emission. Generally, the confusion noise will be a worse problem at longer wavelengths, because of the combination of lower angular resolution and the rising power spectrum of cirrus toward lower spatial frequencies, but the photometric signal to noise will also depend on the relative SED of the source compared to the cirrus.
Key Words.:
ISM: general, structure — Stars: formation, protostars — Submillimeter: ISM1 Introduction
Cirrus noise, which is operationally defined as the “statistical error to be expected in photometric measurements due to confusion in a background of fluctuating surface brightness” (Gautier et al., 1992), is a major issue limiting the cataloging of compact sources that underpins the study of the early stages of star formation in the interstellar medium. Examination of wide range of mass of the stellar precursors, requires measurement of sources with a wide range of luminosity, or at each wavelength, flux density. Stars form where there is abundant material, and so the cirrus brightness in the field tends to be high. Furthermore, many studies, both targeted and unbiased, are in the Galactic plane, which is also bright. Cirrus noise varies with cirrus brightness (Sect. 3), introducing further complexity to the problem. Cirrus fluctuations characteristically decrease with decreasing spatial scale (Sect. 3), but even with the improved angular resolution of Herschel, cirrus noise remains a dominant factor. The Herschel observation planning tool HSpot (www.ipac.caltech.edu/Herschel/hspot.shtml) has a built-in confusion noise estimator to provide “on-line guidance on where to expect fundamental detection limits for point sources that cannot be improved by increasing the integration time.” With such guidance the serious impact of cirrus noise was anticipated, and as shown below it can now be quantified directly using submillimeter data.
To appreciate the problem at its fundamental level, consider actual catalogs of extracted sources (Molinari, 2010; Molinari et al., 2010a) in two degree-sized Hi-GAL Galactic plane fields (Molinari et al., 2010b) (see Sect. 2).

The solid histogram in Figure 1 shows the flux densities of sources cataloged at 250 in the brighter field. Note the falloff in source counts at flux densities less than 10 Jy. This falloff is not an intrinsic property of the underlying population of sources. We show below that this falloff is the expected consequence of cirrus noise, which can be quantified independently of the making of the catalogs. In the fainter field (dashed histogram), the cutoff is lower because of decreased cirrus noise. Clearly, it will be important to account for the varying dramatic effects of cirrus noise in order to recover the statistics of the intrinsic faint-source population.
Cirrus noise is operationally defined and so for a particular measuring strategy, such as fitting compact sources with Gaussians as used in Hi-GAL, this can actually be estimated directly from the source-removed maps (Sect. 3). There is also an extensive literature on “estimating confusion noise due to extended structures given some statistical properties of the sky” (Gautier et al., 1992); see (Kiss et al., 2003; Jeong et al., 2005; Miville-Deschênes et al., 2007; Roy et al., 2010). The cirrus brightness statistics are well described by a power spectrum, appropriate for Gaussian random fields. Gautier et al. (1992) found some non-Gaussianity and Miville-Deschênes et al. (2007) found non-vanishing skewness and excess kurtosis in the underlying brightness fluctuation fields. Nevertheless, these are not large effects and for estimating the variance the power spectrum is demonstrably still a powerful tool, particularly because of the insight it provides into how the cirrus noise depends on various statistical and operational parameters. Therefore, we connect the new direct estimates with what can be obtained using power spectra (Sect. 3). In Sect. 4 we show that reliable power spectra can be obtained even from first-generation images processed for Hi-GAL. Finally, we return to how estimates of cirrus noise should ultimately explain the faint-end cutoff in forthcoming source catalogs (Sect. 5).
2 Observations
Two fields were observed (at and ) during SDP as part of Hi-GAL (Molinari et al., 2010b), using the Parallel mode with both nominal and orthogonal scanning to acquire data in the PACS 70 and 160 bands and all three SPIRE bands (250, 350 and 500 ). The data processing using HIPE and map-making using ROMAGAL are described by Molinari (2010) and references therein. The maps were converted into brightness units (MJy/sr) and the DC offsets recovered as described by Bernard (2010). The offsets are not needed for the cirrus noise analysis, but are needed to describe, for example, the median brightness of the map used in Sect. 3 and Sect. 4.
Compact sources have been detected and then quantified using a Gaussian model (Molinari, 2010; Molinari et al., 2010a). Using the modeled properties, the sources have been removed to produce the images used for the analysis here. There remain some bright, fairly compact peaks not meeting the classification criteria for compact sources, but probably gravitationally influenced and not standard cirrus structure. There are also some artefacts from removal of the brightest compact sources. Given the preliminary nature of these source-subtracted images, for this initial analysis we have analysed large degree-sized sub-regions in which these effects are minimized. They are otherwise representative of bright cirrus. The brightest is from the fairly homogeneous low-longitude half of the map, delineated by and , with median brightness . For convenience, we refer to this field as f30. A contrasting region, in having a lower median brightness , is the lower right quarter map, delineated by and (denoted f59).
3 Direct estimates of cirrus noise and relationship to power spectra
In the literature, cirrus noise is defined operationally for a photometric measurement template used to evaluate the flux density of a compact source on a fluctuating background (not simply “finding” it). We obtain a direct estimate of cirrus noise numerically by placing the template randomly in a cirrus map and finding the rms of the apparent “source” flux density, . In the context of power-law cirrus, Gautier et al. (1992) quantified this analytically for several measurement templates, and these plus simulated cirrus maps have been used to validate our numerical approach in detail (see below). Among these templates is the “aperture plus reference annulus” chosen by Helou & Beichman (1990) and adopted by Kiss et al. (2001) and Roy et al. (2010). In practice, compact sources are often fit with a model template consisting of a Gaussian and a planar inclined plateau, with a footprint larger than the extent of the Gaussian to provide a reference area to characterize the “background.” We adopt a radius of 1.82 times the FWHM of the Gaussian used. This Gaussian-based strategy has the practical advantage of still being useful for moderately crowded sources, unlike simple aperture plus annulus photometry. As a specific and relevant example using the 250 Hi-GAL fields, the source FWHM is typically 1.5 times larger than the diffraction-limited PSF and so we adopt a Gaussian template with this larger FWHM. We also assume that the source-subtracted map is a good proxy for the cirrus in the field. The estimated cirrus noise is 1.7 Jy for f30 and 0.23 Jy for the fainter f59, scaling roughly as the median brightness which changes by a factor 5.8.
As mentioned, there is extensive literature in which the cirrus noise is quantified using the power spectrum. Furthermore, these authors showed that the power spectrum of Galactic cirrus follows a power law , quantified by an amplitude at some fiducial , and an exponent that is typically (Miville-Deschênes et al., 2007), as also found here. We adopt , a scale close to the beam sizes, to avoid issues of extrapolation if is not quite . The essentials of the detailed Gautier et al. (1992) analysis of the “cirrus noise” for a telescope with mirror diameter working at wavelength and can be summarized as:
| (1) |
Here is a dimension of the measurement template (e.g., aperture diameter or FWHM of Gaussian) in units of (explicitly in the formula with the same power). If the compact sources being measured are extended, as will be the case in many Galactic surveys including those illustrated here, then needs to be correspondingly larger. The consequent increase in is captured by the factor for the range of interest. is an amplitude appropriate to a particular measurement template. actually changes significantly with for small , but this is not relevant because no practical application would use photometric templates smaller than the diffraction limit; for the range of interest, there is only a weak dependence (see also Fig. 3 in Gautier et al., 1992). Neither or depend on wavelength; that dependence is carried explicitly in the term and implicitly in the square root dependence on .
We have made simulated power-law cirrus maps with and directly evaluated the cirrus noise with various templates for a range of . We recover the predicted dependence and specific values of , like 0.034 predicted for the widely-used aperture-annulus template of Helou & Beichman (1990) with near 1.6. From these simulated maps we also derived the amplitude appropriate to the Gaussian fitting template for the empirical range of near 1.8 for the actual sources. When the simulated cirrus map has resulted from convolved with the actual Neptune beam (Sect. 4), ( for the nominal Gaussian PSF).
4 Properties of observed power spectra
Details of computing the power spectrum and its errors may be found, for example, in Roy et al. (2010). In practice, contributions to the total power spectrum come not only from diffuse dust emission, but also from point sources, the cosmic infrared background (CIB), and “noise” (which might reasonably be assumed to be fairly white). When these components are statistically uncorrelated, the total power spectrum can be expressed as (Miville-Deschênes et al., 2007):
| (2) |
For bright Galactic plane fields, the contribution from the CIB to the power spectrum is negligible. We have removed the brighter compact sources, but others at or below the detection threshold must remain and need to be accounted for by . While the “noise” is measurable, and of interest, it too makes an insignificant contribution.
, the power spectrum of the PSF, decays at large . For the SPIRE bands we used the empirical PSF from scans of Neptune (ftp://ftp.sciops.esa.int/pub/hsc-calibration/SPIRE/PHOT/Beams) and computed using the technique developed by Roy et al. (2010). A Gaussian approximation is poor and adversely impacts the extraction of , but the fitted functions in Table 1 are good to within a few percent for the range of interest , where is the highest spatial frequency in the power spectrum for these approximately Nyquist-sampled maps ( at 250 ).
| 0.789137 | -0.070793 | 0.349304 | ||
| 0.671082 | 0.294573 | 0.250785 | ||
| 0.402564 | 0.095114 | 1.785801 |
-
a
The top set of curves in Figure 2 shows the power spectrum at 250 for the f30 field. Compared to the power spectra from BLAST shown by Roy et al. (2010), can be determined to larger , as expected because of the smaller Herschel beam. The lower set of curves shows similar results for the fainter f59 field. The steps in fitting the data by equation 2 to find , and the results of the fit, are described in the figure caption. The fit is very good (reduced ).
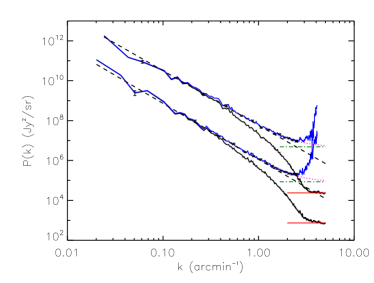
For the fainter f59 field, the noise level, , is comparable to the detector noise predictable by HSpot. It is in fact slightly lower than for the much fainter Polaris field observed with the same coverage (see Fig. 3 in Miville-Deschênes, 2010). Tests indicate that this slight improvement comes from using ROMAGAL rather than the naive map-maker in HIPE. However, note that the noise level for the brighter sub-region is dramatically higher, . This appears to scale as the square of the median brightness of the map and so must measure residual map artefacts, not detector noise. Nevertheless, these are already excellent images with the “noise” small compared to over the range of interest . The presence of is only subtly evident in a slight concave curvature of the power spectrum at large and is adequately modeled there as a constant.
For f30 we find and in the fainter f59 field , not significantly different. These are close to estimates in the Galactic plane by Roy et al. (2010), and also remarkably similar to what has been found at 100 for high-latitude diffuse cirrus (Miville-Deschênes et al., 2007), despite quite different conditions and geometries which could in principle affect the cirrus fluctuations. This supports the adoption of for equation 1 to quantify in the submillimeter.
At 250 we have examined two further regions, the upper right quarter of the map and the Polaris field. From this we conclude that scales roughly as the square of the median brightness. A corollary is that should scale roughly as the median brightness, as we have already found directly (Sect. 3). This behavior is as though the inherent statistical structure in brightness is the same, just scaled up and down. Empirically, at 100 a steeper scaling has been seen for bright cirrus (Miville-Deschênes et al., 2007), and so this should be revisited for all wavelengths when more fields are available. One factor that is changing from field to field, and within fields, is the dust temperature (Bernard, 2010). Even with the same dust column density structure, this will modulate the cirrus brightness, with stronger effects at 100 than in the submillimeter.
For a given region, images of optically thin dust emission at different passbands could be simply related by the scale factor or the (relative) spectral energy distribution (SED). Here, is the dust emissivity. Because of averaging along the line of sight and over different grain components with potentially different , this is a simplification. Nevertheless, Roy et al. (2010) demonstrated with BLAST and IRAS data how an SED with a reasonable can be recovered from the wavelength dependence of (conversely, varies as SED2).
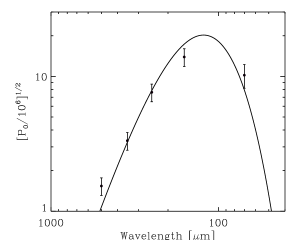
We have examined this with the Herschel data, measuring the power spectra and finding for each of the five passbands. The results for the sub-region are plotted in Figure 3. These data were then fit with a single-temperature modified blackbody ( or ). We find that the functional form is satisfactory, and that K. The temperature has been fit independently pixel by pixel (Bernard, 2010). For this sub-region, with the average temperature is 22.5 K (range 16 – 28.5 K, median: 22.5 K). The close agreement is reassuring. Thus, other things being equal, the SED of will be close to that of the cirrus emission. In measuring the flux density of a compact source, the wavelength dependence of the signal (source SED) to noise (diffuse dust SED) will depend on the relative temperatures as well. Sources cooler (hotter) than the cirrus will be detected at a relatively higher (lower) S/N at long wavelengths. However, equation 1 also shows that in practice cirrus noise will be more severe for the long-wavelength bands because of the larger beam, offsetting this effect on S/N for cooler sources and compounding it for hotter ones.
5 Cirrus noise and faint-end cutoffs in catalogs
We can estimate the cirrus noise from the power spectra and equation 1. For f30 and f59 at is 58 and , respectively. When fit by Gaussians, sources in these Hi-GAL fields require typically . has been evaluated from simulations for this range of . We find and 0.25 Jy, respectively. These compare favorably with the values estimated directly, 1.7 and 0.23 Jy, respectively (Sect. 3). In the f30 field, a 5- catalog would be cut off at about 9 Jy. The fainter f59 field is also affected, but would have a lower 5- cutoff of 1.3 Jy. Cirrus noise therefore severely limits the depth of the catalogs and generally in Hi-GAL Galactic plane fields will be the pre-dominant factor. When catalogs from multiple fields with different median brightnesses are combined/interpreted, account must be made for the differing impact of cirrus noise.
The faint-end cutoffs in the catalogs of compact sources illustrated in Figure 1 are close to the estimated influence of cirrus noise. Quantitatively, this must be somewhat of a coincidence. As described by Molinari (2010) and Molinari et al. (2010a), the catalog is not selected on the basis of signal to noise (S/N) of the flux densities. No errors have been tabulated for the flux densities from the Gaussian fits. Judging from their a posteriori S/N estimator, which involves peak flux (Jy/beam), there is a wide range, including some below 5. Simulations to assess catalog completeness find that the peak flux for 80% completeness is 4.1 Jy/beam over the entire map, and so for the typical source FWHM, the corresponding flux density completeness limit is 9.2 Jy close to our estimated 5- threshold and the observed histogram peak in Figure 1. For the fainter survey there is a lower 80% completeness limit (1.6 Jy); peak in the histogram occurs at a lower value, again close to this limit and our estimated 5- threshold.
At longer wavelengths, cirrus noise will be more limiting for both source detection and source flux density determinations, because of the (beam) dependence. This highlights another important consideration for band-merged catalogs, that the S/N for cataloged sources will be wavelength dependent.
References
- Bernard (2010) Bernard, J.-P. 2010, A&A, 000
- Gautier et al. (1992) Gautier, III, T. N., Boulanger, F., Perault, M., & Puget, J. L. 1992, AJ, 103, 1313
- Helou & Beichman (1990) Helou, G. & Beichman, C. A. 1990, in Liege International Astrophysical Colloquia, Vol. 29, Liege International Astrophysical Colloquia, ed. B. Kaldeich, 117–123
- Jeong et al. (2005) Jeong, W.-S., Mok Lee, H., Pak, S., et al. 2005, MNRAS, 357, 535
- Kiss et al. (2001) Kiss, C., Ábrahám, P., Klaas, U., Juvela, M., & Lemke, D. 2001, A&A, 379, 1161
- Kiss et al. (2003) Kiss, C., Ábrahám, P., Klaas, U., et al. 2003, A&A, 399, 177
- Miville-Deschênes (2010) Miville-Deschênes, M.-A., . 2010, A&A, 000
- Miville-Deschênes et al. (2007) Miville-Deschênes, M.-A., Lagache, G., Boulanger, F., & Puget, J.-L. 2007, A&A, 469, 595
- Molinari (2010) Molinari, S. 2010, A&A, 000
- Molinari et al. (2010a) Molinari, S., Faustini, F., Schisano, E., Pestalozzi, M., & Di Giorgio, A. 2010a, A&A
- Molinari et al. (2010b) Molinari, S., Swinyard, B., Bally, J., et al. 2010b, PASP, 122, 314
- Roy et al. (2010) Roy, A., Ade, P. A. R., Bock, J. J., et al. 2010, ApJ, 708, 1611