Evolution of the radio - X-ray coupling throughout an entire outburst of Aquila X-1
Abstract
The 2009 November outburst of the neutron star X-ray binary Aquila X-1 was observed with unprecedented radio coverage and simultaneous pointed X-ray observations, tracing the radio emission around the full X-ray hysteresis loop of the outburst for the first time. We use these data to discuss the disc-jet coupling, finding the radio emission to be consistent with being triggered at state transitions, both from the hard to the soft spectral state and vice versa. Our data appear to confirm previous suggestions of radio quenching in the soft state above a threshold X-ray luminosity of % of the Eddington luminosity. We also present the first detections of Aql X-1 with Very Long Baseline Interferometry (VLBI), showing that any extended emission is relatively diffuse, and consistent with steady jets rather than arising from discrete, compact knots. In all cases where multi-frequency data were available, the source radio spectrum is consistent with being flat or slightly inverted, suggesting that the internal shock mechanism that is believed to produce optically thin transient radio ejecta in black hole X-ray binaries is not active in Aql X-1.
1 Introduction
Multi-wavelength observations of accreting stellar-mass compact objects have revealed a fundamental coupling between the processes of accretion and ejection. As an X-ray binary (XRB) evolves through a set of characteristic X-ray spectral and variability states over the course of an outburst, the radio emission, assumed to arise from jets launched from the inner regions of the system, is also seen to evolve. Fender et al. (2004a) proposed a phenomenological model for this accretion-ejection (disc-jet) coupling in the relatively well-studied black hole (BH) XRBs. In this model, compact steady jets are present in the hard X-ray spectral state, with the jet power scaling with X-ray luminosity. The jet velocity increases when the source makes a transition to a softer spectral state, leading to internal shocks within the flow (e.g. Kaiser et al., 2000), observed as discrete knots of radio emission that move outwards at relativistic speeds. The compact jets then switch off. The system eventually makes a transition back to a hard spectral state, whereupon the core jets are re-established, and the source fades back into quiescence. This second state transition tends to occur at a lower luminosity than the original transition from the hard to the soft state, implying a hysteresis in the outburst cycle (Maccarone & Coppi, 2003).
Compact jets are also inferred to exist in neutron star (NS) systems, from brightness temperature arguments, the observed flat-spectrum radio emission, and the detection of a jet break in broadband spectra (Migliari et al., 2006, 2010). Rapid energy transfer from the core to detached radio lobes (Fomalont et al., 2001; Fender et al., 2004a) also argues strongly for the existence of jets in NS systems, although their compact jets have not been directly imaged, as in BH systems (Dhawan et al., 2000; Stirling et al., 2001). Since NS XRBs are typically fainter radio emitters than their BH counterparts at the same X-ray luminosity (Fender & Kuulkers, 2001; Migliari & Fender, 2006), the nature of the disc-jet coupling in NS systems is consequently less well understood. Migliari & Fender (2006) made a systematic study of radio emission from NS XRBs, finding evidence for steady jets in hard state systems at low luminosities (% of the Eddington luminosity, ) and transient jets in outbursting sources close to , as seen in BH systems but without complete suppression of the radio emission in soft states. The correlation between X-ray and radio emission in hard states was steeper in NS systems (Migliari & Fender, 2006) than the analogous correlation in BH systems (Gallo et al., 2003), implying a different coupling between X-ray luminosity and mass accretion rate, although the jet power for a given accretion rate is similar in both classes of system (Körding et al., 2006).
Understanding the similarities and differences between the disc-jet coupling in BH and NS systems is crucial in determining the role played by the depth of the gravitational potential well, the stellar surface, and any stellar magnetic field in the process of jet formation.
1.1 Aql X-1
Aql X-1 is a recurrent transient XRB which undergoes outbursts every d. The accretor is a confirmed NS (Koyama et al., 1981), in a -h orbit (Chevalier & Ilovaisky, 1991; Shahbaz et al., 1998; Welsh et al., 2000) with a K7V companion (Chevalier et al., 1999). Its X-ray spectral and timing behavior classify it as an atoll source (Reig et al., 2000). The distance, determined from the luminosity of its Type I X-ray bursts, is in the range 4.4–5.9 kpc (Jonker & Nelemans, 2004).
Despite its frequent outbursts, there are few reported radio detections of Aql X-1, likely owing to the faintness of atoll sources in the radio band (Migliari & Fender, 2006). Tudose et al. (2009a) analyzed all publicly-available archival data from the Very Large Array (VLA), taken exclusively during X-ray outbursts, between 1986 and 2005. They detected the source at 11 epochs, with a maximum radio flux density of 0.4 mJy. In all cases where multi-frequency observations were available, the radio spectrum was inverted (, where flux density scales with frequency as ). They also found tentative evidence for quenching of the radio emission above a certain X-ray luminosity.
Here, we extend on the work of Tudose et al. (2009a), presenting the most complete radio coverage of an outburst of Aql X-1 obtained to date, to elucidate the nature of the radio/X-ray coupling in this source.
2 Observations
Rising X-ray flux from Aql X-1 was observed on 2009 November 1 (Linares et al., 2009) by the Proportional Counter Array (PCA) on board the RXTE satellite during the ongoing Galactic bulge monitoring program (Markwardt et al., 2000). Here we present follow-up radio and X-ray data taken during the outburst.
2.1 VLA
On detection of rising X-ray flux, we triggered VLA monitoring at 8.4 GHz. Data were taken in dual circular polarization with a total observing bandwidth of 100 MHz. The array was in its least-extended D configuration. On detection of radio emission (Sivakoff et al., 2009), we also began observing at 4.8 GHz until the source faded below our detection threshold. Further, we reduced all remaining unpublished archival VLA data, covering the outbursts of 2006 August and 2007 October. Data reduction was carried out according to standard procedures within AIPS (Greisen, 2003).
2.2 VLBA
Following the initial VLA radio detection, we triggered observations with the Very Long Baseline Array (VLBA). We observed at 8.4 GHz in dual circular polarization, using the maximum available recording rate of 512 Mbps, corresponding to an observing bandwidth of 64 MHz per polarization. The observations, of duration 2–6 h, were phase-referenced to the nearby calibrator J1907+0127, from the third extension to the VLBA Calibrator Survey (VCS-3; Petrov et al., 2005) and located from Aql X-1. The phase-referencing cycle time was 3 min, with occasional scans on the VCS-4 (Petrov et al., 2006) check source J1920-0236. For the longer observations, 30 min at the start and end of the observing run were used to observe bright calibrator sources at differing elevations to calibrate unmodeled clock and tropospheric phase errors, thereby improving the success of the phase transfer. Data reduction was carried out according to standard procedures within AIPS.
2.3 EVN
As reported by Tudose et al. (2009b), Aql X-1 was observed at 5 GHz with the European VLBI Network (EVN) on 2009 November 19 (14:30–19:00 UT) using the e-VLBI technique. The array comprised stations at Effelsberg, Medicina, Onsala, Torun, Westerbork, Yebes and Cambridge with a maximum recording rate of 1 Gbps. We observed in full-polarization mode with a total bandwidth of 128 MHz per polarization, and data were phase referenced to J1907+0127. The data were calibrated in AIPS and imaged in Difmap (Shepherd, 1997) using standard procedures.
2.4 RXTE
Following Altamirano et al. (2008), we used the 16-s time-resolution Standard 2 mode PCA data to calculate X-ray colors and intensities. Hard and soft colors were defined as the count rate ratios (9.7–16.0 keV / 6.0–9.7 keV) and (3.5–6.0 keV / 2.0–3.5 keV), respectively, and intensity was defined as the 2.0–16.0 keV count rate. Type I X-ray bursts were removed, background was subtracted and deadtime corrections were made, before normalizing intensities and colors by those of the Crab Nebula, on a per-PCU basis.
3 Results
3.1 Lightcurves
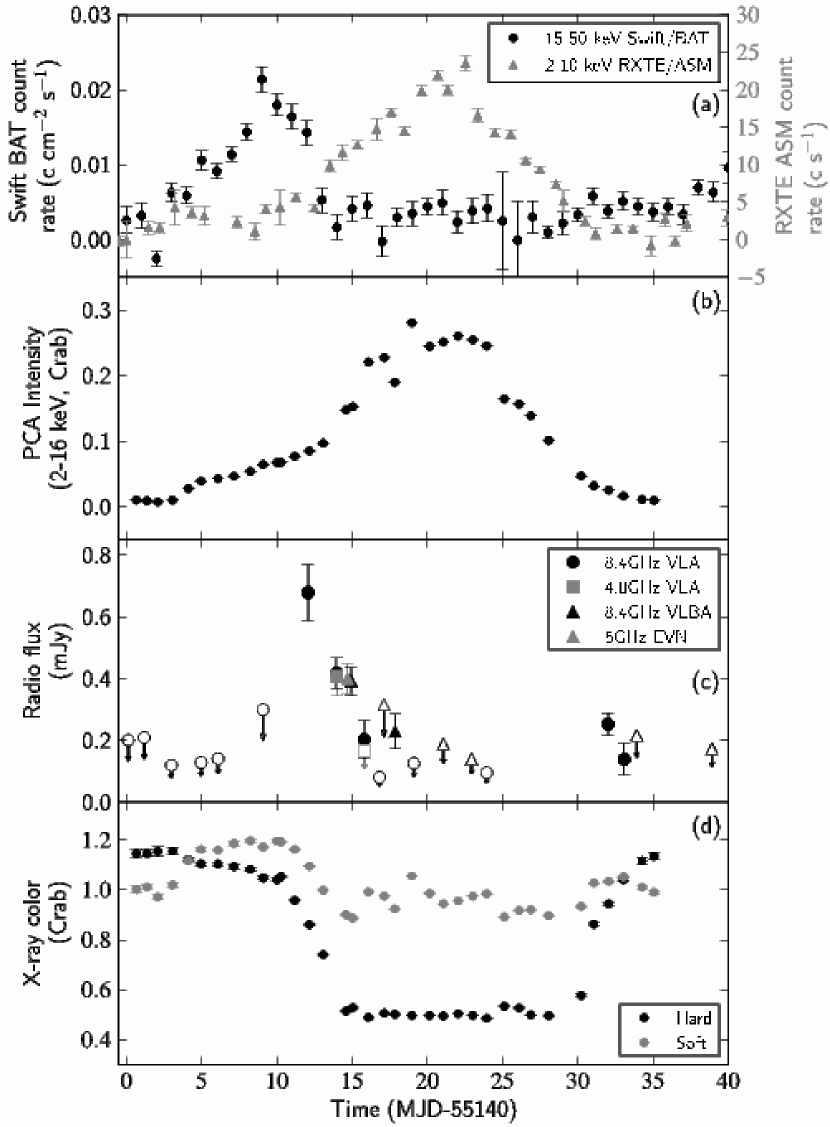
The observational results are given in Table 1 and plotted in Fig. 2, together with the publicly available 2–10 keV RXTE ASM and 15–50 keV Swift BAT lightcurves. The hard X-ray flux peaks first during the outburst, as noted by Yu et al. (2003). As this starts to decrease, the soft flux rises and the X-ray colors decrease. Radio emission is first detected at this point of X-ray spectral softening, with an 8.4 GHz flux density of mJy (the highest level measured to date from Aql X-1). The hard X-ray flux then levels off while the radio emission fades below detectable levels and the soft X-ray flux peaks at mCrab before decaying. As the X-ray color increases again and the spectrum hardens, a second burst of radio emission is detected. Thus while the radio sampling is relatively sparse during the second state transition, the radio emission is consistent with being triggered at transitions in both directions between the hard and the soft X-ray states.
3.2 Imaging
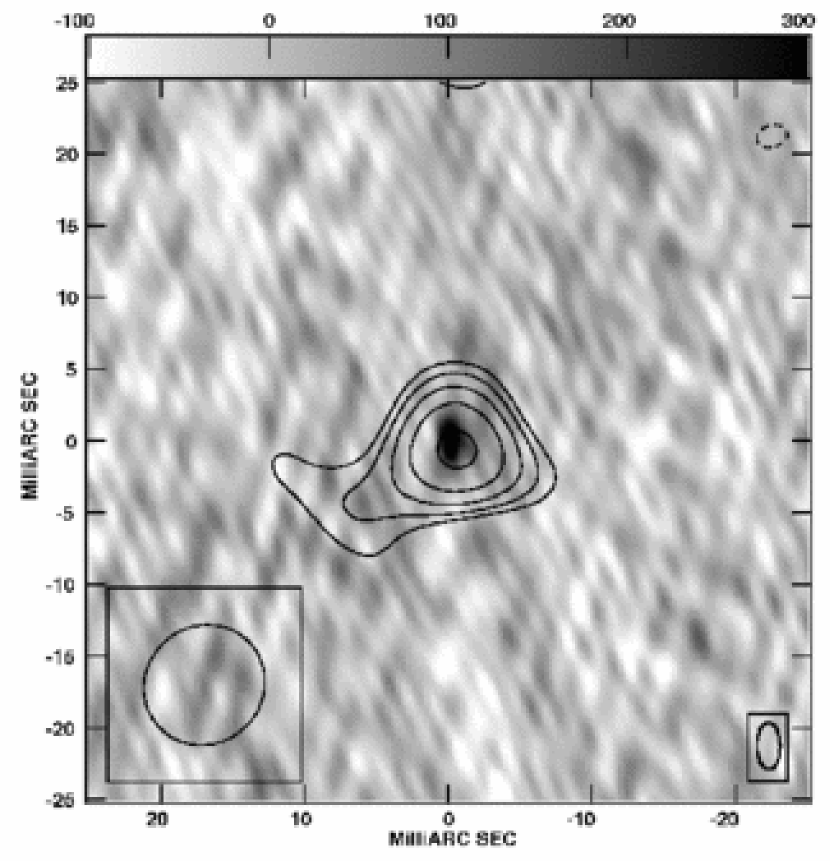
During the X-ray spectral softening, the source was detected for the first time with VLBI. The 5-GHz EVN observations were not fully consistent with an unresolved source, showing tentative evidence for a marginal-significance (, mJy) extension to the southeast (Fig. 2). The 8.4-GHz VLBA observations made on the same day were consistent with an unresolved source, to a noise level of 0.046 mJy beam-1, and implied a slightly inverted core radio spectrum (). Within uncertainties, the VLBI flux density was consistent at both frequencies with the integrated VLA flux density measured the previous day, so the majority of the flux was recovered on milliarcsecond scales. However, faint extended emission at the level seen by the EVN cannot be fully discounted, since convolving the 8.4-GHz VLBA data to the 5-GHz EVN resolution raised the noise level too high to detect such emission. Simulations demonstrated that the longer baselines of the VLBA would not detect faint extended emission as seen by the EVN on a size scale of 10 mas unless it were significantly more compact than the EVN beamsize. This allows for the possibility that the emission is sufficiently faint and extended to be resolved out by the VLBA (possibly indicative of a large-scale, steady jet), but makes it unlikely to be caused by compact, localized internal shocks. Alternatively, the extension in the EVN image may not in fact be real.
The VLBA position of Aql X-1, relative to the VCS-3 phase reference source J 1907+0127, whose position was taken to be (J 2000) 19h07m119962510(747) 01°27′0896251(135), was
where the quoted error bars are purely statistical errors from fitting in the image plane. Imaging the check source J 1920-0236, phase referenced to J 1907+0127, suggested that the systematic errors are well below 1 mas. This VLBA position is also consistent within errors with the EVN position.
4 Discussion and comparison with black hole systems
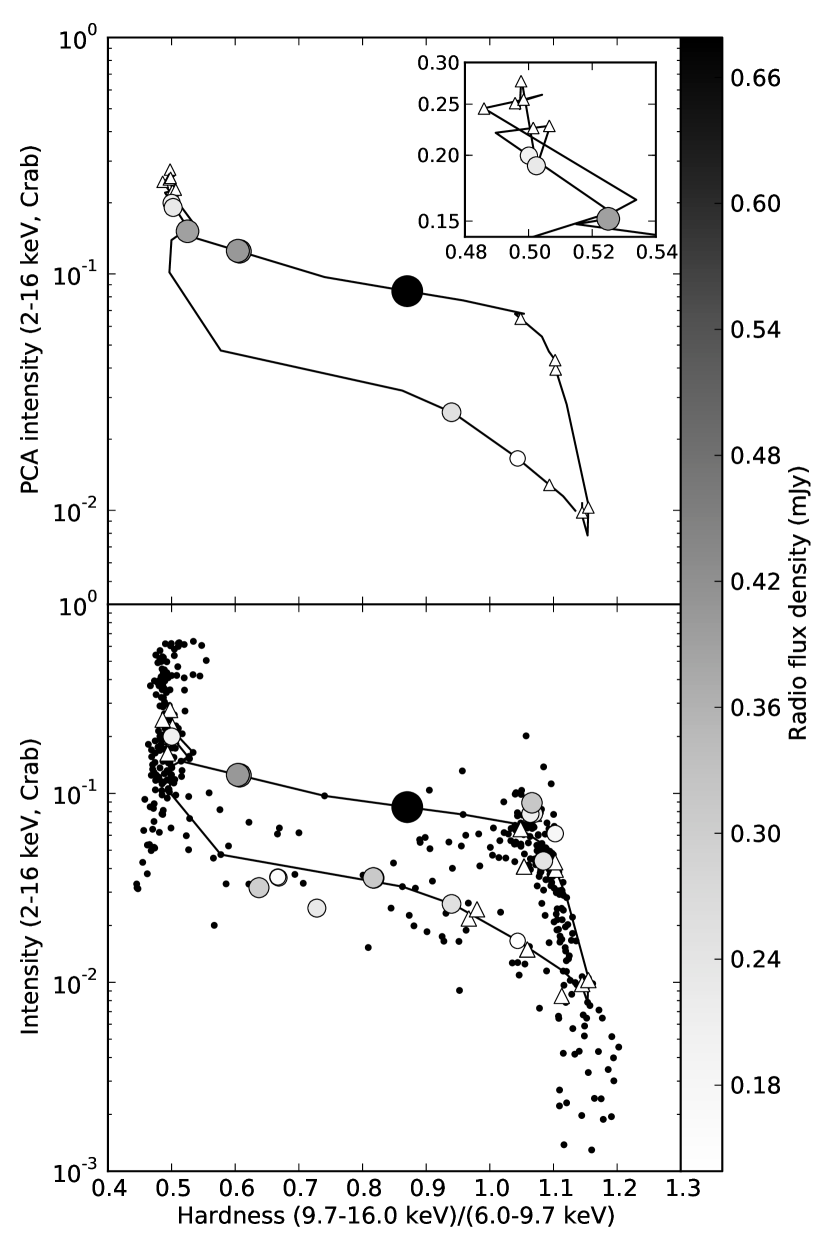
The hardness-intensity diagram (HID) is a diagnostic plot used extensively in interpreting the X-ray evolution of BH XRB outbursts (e.g. Fender et al., 2004a). Maitra & Bailyn (2004) found that the 2000 September outburst of Aql X-1 traced out a very similar hysteresis loop in a HID to the better-studied BH candidates. Fig. 3 shows the radio emission superposed on the HIDs for both the 2009 November outburst of Aql X-1 and previous outbursts, showing the relation between radio emission and the X-ray spectral state of the source.
4.1 The relation between X-ray state and radio emission
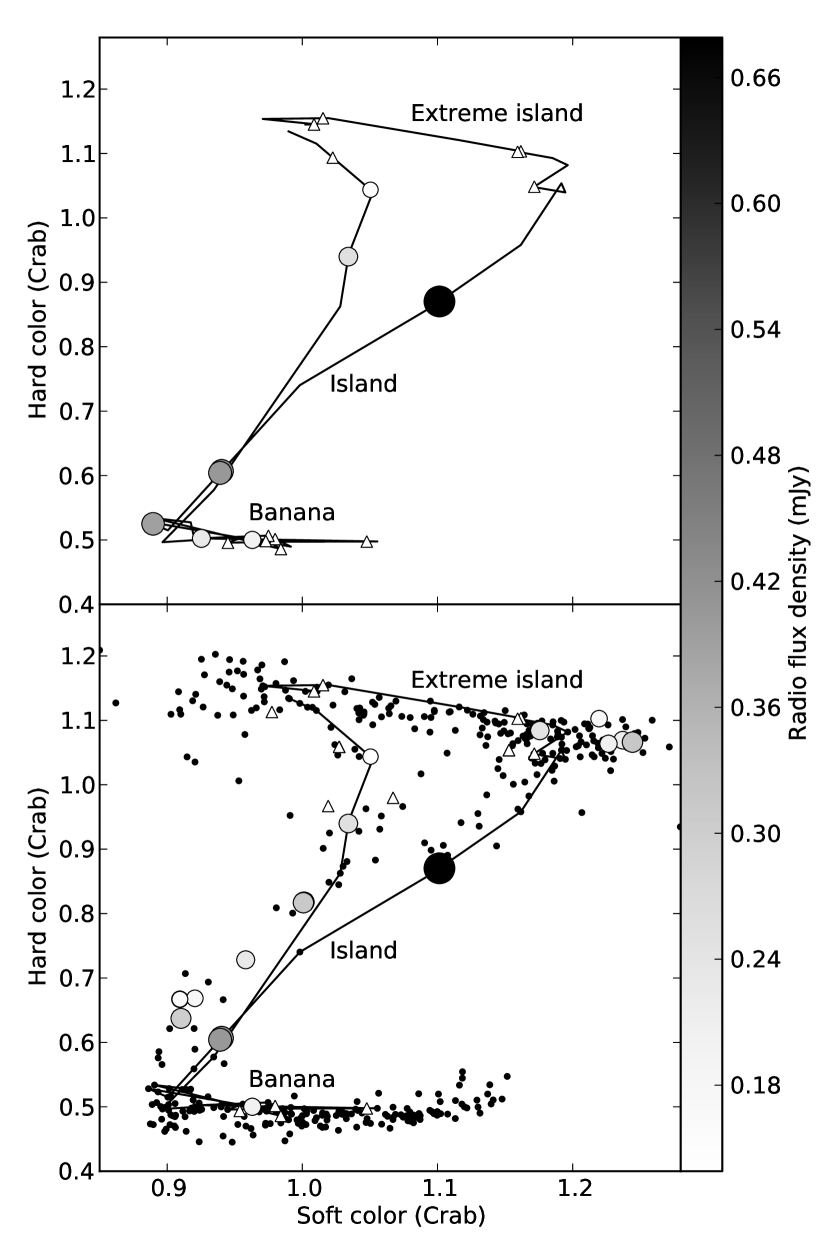
The radio emission is consistent with being triggered at X-ray state transitions, switching on as the source moves into the intermediate (island) state in the color-color diagram (CCD; Fig. 3), from either the hard (extreme island) or soft (banana) state. This pattern of triggering radio emission at state transitions is similar to the behavior seen in both the atoll source 4U 1728-34 (Migliari et al., 2003) and in BH XRB outbursts (Fender et al., 2004a). However, unlike in BH systems, we did not detect radio emission in the rising hard state (the right hand side of the HID), possibly due to insufficient sensitivity (our upper limits are close to the predicted values from the correlation of Migliari & Fender, 2006), nor did we detect optically-thin shocked ejecta after the transition to the soft state.
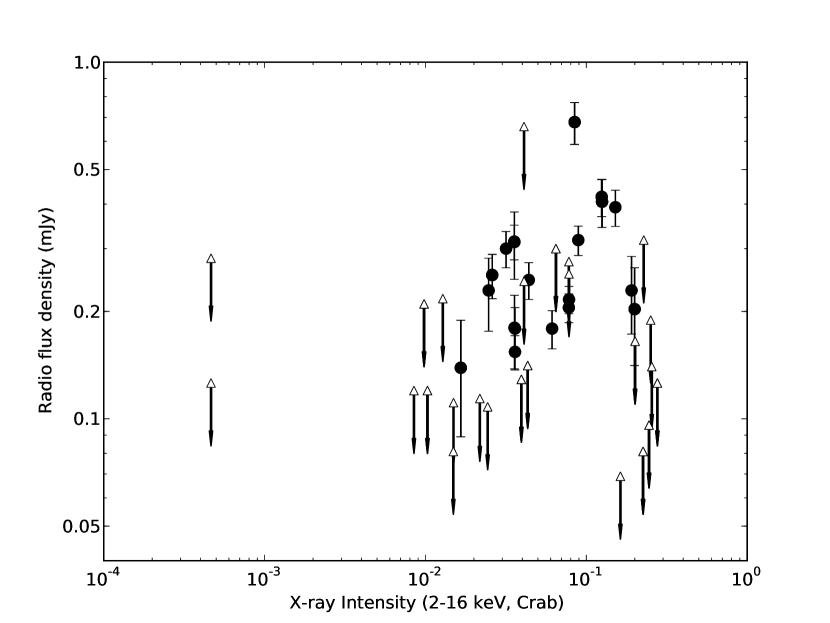
The radio emission appears quenched while the system is in a high-luminosity soft (banana) state (Fig. 4). Migliari et al. (2003) and Tudose et al. (2009a) also found evidence for the quenching of the jets in NS systems above a critical X-ray luminosity, albeit on the basis of relatively sparse observational data (but see Migliari et al., 2004, for counterexamples). From Figures 3 and 4, the critical luminosity for Aql X-1 appears to be Crab, corresponding to a 2–16 keV luminosity of erg s-1, i.e. for a neutron star accretor. While reminiscent of the drop in radio flux seen in BH systems at a few per cent of (Gallo et al., 2003), higher-sensitivity observations are required to accurately determine the critical luminosity.
4.2 The nature of the jets
The brightness temperature () of the unresolved VLBA source is K. The maximum VLA flux density of 0.68 mJy implies a source with AU. Even at the inverse Compton limit of K, the emission would arise on scales greater than the Roche lobe around the NS, which strongly suggests that the emitting material is flowing away from the system.
The two epochs with constraints on the radio spectrum are consistent with flat or slightly-inverted spectra, typically interpreted in BH XRBs as arising from partially self-absorbed compact jets (Blandford & Königl, 1979). Reduction of archival VLA data (Table 1 and Tudose et al., 2009a) showed that every dual-frequency detection of the source to date is consistent with a flat or inverted radio spectrum, albeit with fairly large error bars. Reducing the error bars by taking a weighted mean of all spectral indices taken outside the hard (extreme island) X-ray state (in which, by analogy with BH, a flat spectrum is expected) gives . Such a flat spectrum is also consistent with the lack of optically-thin ejecta in the VLBI observations, and with the recovery of the full integrated VLA flux with the VLBA and EVN. We thus find no evidence for transient, optically thin jet emission as seen in BH XRB outbursts.
If confirmed by future observations, the marginal EVN extension would imply a jet of size mas ( AU). If not, the VLBA beamsize of mas2 gives an upper limit on the physical size scale of the jets of AU at 8.4 GHz. Such a small size is consistent with the low flux density, when compared to the case of Cyg X-1 (Heinz, 2006).
Only two NS XRBs, Sco X-1 and Cir X-1, have previously been imaged on VLBI scales. Fomalont et al. (2001) detected resolved radio lobes in Sco X-1, which moved out from the central source at speeds of 0.3–0.6. Rather than being internal shocks within a jet, these were interpreted as the working surfaces where the jets impacted the surrounding environment. From the time delay between corresponding flaring events in the core and these hotspots, it was inferred that an unseen beam transferred energy between the core and the lobes at a velocity . Limits on the jet size in Cir X-1 were derived by Preston et al. (1983) and Phillips et al. (2007), and although scatter-broadened, it was speculated that a compact jet of size 35 mas ( AU) might be present in the system. While Sco X-1 is a Z-source, Cir X-1 shows characteristics of both atoll and Z-sources (Oosterbroek et al., 1995), and Aql X-1 is an atoll source, none of them show clear evidence for internal shocks propagating down the jets at relativistic speeds and giving rise to discrete radio knots, as seen in BH outbursts. While approximate mass scalings would suggest that optically-thin NS jets should be less bright than those in BH, they should be detectable, albeit on smaller scales. Thus the mechanism responsible for generating internal shocks (variations in the jet Lorentz factor are often invoked) is either less effective in NS XRBs than in their BH counterparts, or the shocks are less efficient emitters. Possible explanations include a less variable or more smoothly varying outflow speed (although NS jets can produce ultrarelativistic outflows; Fender et al., 2004b), a high sound speed (although with a maximum of , this appears unlikely if all NS jets are highly relativistic), or a high magnetic field to smooth out variations in the flow (possible, given the existing stellar field). More speculatively, should the discrete knots be ballistic ejecta launched from magnetic fields threading the ergosphere (Blandford & Znajek, 1977; Punsly & Coroniti, 1990), rather than internal shocks, this mechanism would not be present in NS systems. Disk fields (Blandford & Payne, 1982) would then be the best candidate for accelerating the NS and hard state BH jets, as suggested by Meier (2003).
Further sensitive, high-resolution radio observations of NS sources in outburst are required to confirm this lack of transient ejecta and ascertain whether this is indeed a fundamental difference between NS and BH jets. Similarities and differences between the two classes of source will constrain the role of the stellar surface and magnetic field and the depth of the potential well in accelerating relativistic jets from accreting compact objects.
5 Conclusions
We have obtained unprecedented radio coverage of an outburst of the NS XRB Aql X-1, demonstrating that the radio emission is consistent with being activated by both transitions from a hard state to a soft state and by the reverse transition at lower X-ray luminosity. Our data appear to confirm previous suggestions of quenched radio emission above a certain X-ray luminosity, corresponding to % of the Eddington luminosity. We have for the first time detected the source with VLBI, which together with the measured brightness temperature, radio spectra and integrated flux density observed by the VLA demonstrates that the radio emission in this source is consistent with the compact, partially self-absorbed steady jets seen in the hard states of BH XRBs. NSs thus appear equally capable of launching jets as BHs, but the absence of bright, optically thin, relativistically moving knots may suggest a fundamental difference in the jet formation process between NS and BH systems, possibly hinting at an additional role from the ergosphere.
References
- Altamirano et al. (2008) Altamirano, D., van der Klis, M., Méndez, M. and, Jonker, P. G., Klein-Wolt, M., & Lewin, W. H. G. 2008, ApJ, 685, 436
- Blandford & Königl (1979) Blandford, R. D., Königl, A. 1979, ApJ, 232, 34
- Blandford & Payne (1982) Blandford, R. D., & Payne, D. G. 1982, MNRAS, 199, 883
- Blandford & Znajek (1977) Blandford, R. D., & Znajek, R. L. 1977, MNRAS, 179, 433
- Chevalier & Ilovaisky (1991) Chevalier, C., & Ilovaisky, S. A. 1991, A&A, 251, L11
- Chevalier et al. (1999) Chevalier, C., Ilovaisky, S. A., Leisy, P., & Patat, F. 1999, A&A, 347, L51
- Dhawan et al. (2000) Dhawan, V., Mirabel, I. F., & Rodríguez, L. F. 2000, ApJ, 543, 373
- Fender & Kuulkers (2001) Fender, R. P., & Kuulkers, E. 2001, MNRAS, 324, 923
- Fender et al. (2004a) Fender, R. P., Belloni, T. M., & Gallo, E. 2004a, MNRAS, 355, 1105
- Fender et al. (2004b) Fender, R., Wu, K., Johnston, H., Tzioumis, T., Jonker, P., Spencer, R., & van der Klis, M. 2004b, Nature, 427, 222
- Fomalont et al. (2001) Fomalont, E. B., Geldzahler, B. J., & Bradshaw, C. F. 2001, ApJ, 558, 283
- Gallo et al. (2003) Gallo, E., Fender, R. P., & Pooley, G. G. 2003, MNRAS, 344, 60
- Greisen (2003) Greisen E. W. 2003, in Information Handling in Astronomy: Historical Vistas, ed. A. Heck (Dordrecht: Kluwer), 109
- Heinz (2006) Heinz, S. 2006, ApJ, 636, 316
- Jonker & Nelemans (2004) Jonker, P. G., & Nelemans, G. 2004, MNRAS, 354, 355
- Kaiser et al. (2000) Kaiser, C. R., Sunyaev, R., & Spruit, H. C. 2000, A&A, 356, 975
- Körding et al. (2006) Körding, E. G., Fender, R. P., & Migliari, S. 2006, MNRAS, 369, 1451
- Koyama et al. (1981) Koyama, K., et al. 1981, ApJ, 247, L27
- Linares et al. (2009) Linares, M., et al. 2009, The Astronomer’s Telegram, 2288
- Maccarone & Coppi (2003) Maccarone, T. J., & Coppi, P. S. 2003, MNRAS, 338, 189
- Maitra & Bailyn (2004) Maitra, D., & Bailyn, C. D. 2004, ApJ, 608, 444
- Markwardt et al. (2000) Markwardt, C. B., Swank, J. H., Marshall, F. E., & in ’t Zand, J. J. M. 2000, in ’Rossi2000: Astrophysics with the Rossi X-ray Timing Explorer’, E7
- Meier (2003) Meier, D. L. 2003, New Astronomy Reviews, 47, 667
- Migliari & Fender (2006) Migliari, S., & Fender, R. P. 2006, MNRAS, 366, 79
- Migliari et al. (2003) Migliari, S., Fender, R. P., Rupen, M., Jonker, P. G., Klein-Wolt, M., Hjellming, R. M., & van der Klis, M. 2003, MNRAS, 342, L67
- Migliari et al. (2004) Migliari, S., Fender, R. P., Rupen, M., Wachter, S., Jonker, P. G., Homan, J., & van der Klis, M. 2004, MNRAS, 351, 186
- Migliari et al. (2006) Migliari, S., Tomsick, J. A., Maccarone, T. J., Gallo, E., Fender, R. P., Nelemans, G., & Russell, D. M. 2006, ApJ, 643, L41
- Migliari et al. (2010) Migliari, S., et al. 2010, ApJ, 710, 117
- Oosterbroek et al. (1995) Oosterbroek, T., van der Klis, M., Kuulkers, E., van Paradijs, J., & Lewin, W. H. G. 1995, A&A, 297, 141
- Petrov et al. (2005) Petrov, L., Kovalev, Y. Y., Fomalont, E., & Gordon, D. 2005, AJ, 129, 1163
- Petrov et al. (2006) Petrov, L., Kovalev, Y. Y., Fomalont, E. B., & Gordon, D. 2006, AJ, 131, 1872
- Phillips et al. (2007) Phillips, C. J., et al. 2007, MNRAS, 380, L11
- Preston et al. (1983) Preston, R. A., Morabito, D. D., Wehrle, A. E., Jauncey, D. L., Batty, M. J., Haynes, R. F., Wright, A. E., & Nicolson, G. D. 1983, ApJ, 268, L23
- Punsly & Coroniti (1990) Punsly, B., & Coroniti, F. V. 1990, ApJ, 354, 583
- Reig et al. (2000) Reig, P., Méndez, M., van der Klis, M., & Ford, E. C. 2000, ApJ, 530, 916
- Shahbaz et al. (1998) Shahbaz, T., Thorstensen, J. R., Charles, P. A., & Sherman, N. D. 1998, MNRAS, 296, 1004
- Shepherd (1997) Shepherd M.C. 1997, in ASP Conf. Ser. Vol. 125, Astronomical Data Analysis Software and Systems VI., eds. G. Hunt and H.E. Payne (San Francisco: Astron. Soc. Pac.), 77
- Sivakoff et al. (2009) Sivakoff, G. R., Miller-Jones, J., Fox, O., Linares, M., Altamirano, D., & Russell, D. 2009, The Astronomer’s Telegram, 2302
- Stirling et al. (2001) Stirling, A. M., Spencer, R. E., de la Force, C. J., Garrett, M. A., Fender, R. P., & Ogley, R. N. 2001, MNRAS, 327, 1273
- Tudose et al. (2009a) Tudose, V., Fender, R. P., Linares, M., Maitra, D., & van der Klis, M. 2009a, MNRAS, 400, 2111
- Tudose et al. (2009b) Tudose, V., Paragi, Z., Miller-Jones, J., Garrett, M., Fender, R., Rushton, A., & Spencer, R. 2009b, The Astronomer’s Telegram, 2317
- Welsh et al. (2000) Welsh, W. F., Robinson, E. L., & Young, P., 2000, AJ, 120, 943
- Yu et al. (2003) Yu, W., Klein-Wolt, M., Fender, R., & van der Klis, M. 2003, ApJ, 589, L33
| Date | MJD | PCA | Hard | Soft | MJD | 8.4 GHz | 4.8 GHz | MJD | 8.4 GHz | 5.0 GHz | X-ray |
|---|---|---|---|---|---|---|---|---|---|---|---|
| PCA | flux | coloraaCount rate ratio (9.7–16.0 keV / 6.0–9.7 keV) | colorbbCount rate ratio (3.5–6.0 keV / 2.0–3.5 keV) | VLA | VLA flux | VLA flux | VLBA | VLBA flux | EVN flux | stateccEIS, IS and BS denote extreme island state, island state, and banana state, respectively, defined from RXTE observations within 2 d of the radio data. | |
| (day) | (mCrab) | (day) | (mJy) | (mJy) | (day) | (mJy) | (mJy) | ||||
| 2006 May 28 | 53883.57 | ||||||||||
| 2006 May 30 | 53885.36 | ||||||||||
| 2006 Aug 02 | 53949.41 | 53949.41 | IS | ||||||||
| 2006 Aug 03 | 53950.34 | 53950.21 | IS | ||||||||
| 2006 Aug 04 | 53951.45 | 53951.06 | IS | ||||||||
| 2006 Aug 07 | 53954.20 | 53954.38 | IS | ||||||||
| 2006 Aug 09 | 53955.97 | 53956.27 | IS | ||||||||
| 2006 Aug 11 | 53958.06 | 53958.34 | EIS | ||||||||
| 2006 Aug 18 | 53965.46 | 53965.28 | EIS | ||||||||
| 2006 Aug 21 | 53968.34 | ||||||||||
| 2006 Aug 23 | 53970.33 | ||||||||||
| 2006 Aug 28 | 53975.32 | ||||||||||
| 2006 Aug 31 | 53978.21 | ||||||||||
| 2007 May 22 | 54242.41 | 54242.59 | EIS | ||||||||
| 2007 Sep 28 | 54371.05 | ||||||||||
| 2007 Sep 30 | 54373.87 | ||||||||||
| 2007 Oct 02 | 54376.99 | 54375.99 | EIS | ||||||||
| 2007 Oct 06 | 54379.87 | 54379.17 | EIS | ||||||||
| 2007 Oct 07 | 54380.85 | ||||||||||
| 2007 Oct 19 | 54392.99 | ||||||||||
| 2009 Nov 05 | 55140.67 | 55140.12 | EIS | ||||||||
| 2009 Nov 06 | 55141.38 | 55141.19 | EIS | ||||||||
| 2009 Nov 07 | 55142.09 | EIS | |||||||||
| 2009 Nov 08 | 55143.07 | 55142.99 | EIS | ||||||||
| 2009 Nov 09 | 55144.12 | EIS | |||||||||
| 2009 Nov 09 | 55144.97 | 55144.97 | EIS | ||||||||
| 2009 Nov 11 | 55146.08 | 55146.09 | EIS | ||||||||
| 2009 Nov 12 | 55147.14 | EIS | |||||||||
| 2009 Nov 13 | 55148.25 | EIS | |||||||||
| 2009 Nov 14 | 55149.09 | 55149.08 | EIS | ||||||||
| 2009 Nov 15 | 55150.00 | EIS | |||||||||
| 2009 Nov 15 | 55150.28 | EIS | |||||||||
| 2009 Nov 16 | 55151.19 | IS | |||||||||
| 2009 Nov 17 | 55152.17 | 55152.07 | IS | ||||||||
| 2009 Nov 18 | 55153.08 | IS | |||||||||
| 2009 Nov 19 | 55154.60 | 55154.00 | 55154.94 | ddThe MJD of the EVN observation was 55154.70. | IS | ||||||
| 2009 Nov 20 | 55155.04 | 55155.81 | BS | ||||||||
| 2009 Nov 21 | 55156.09 | 55156.82 | BS | ||||||||
| 2009 Nov 22 | 55157.14 | 55157.12 | BS | ||||||||
| 2009 Nov 22 | 55157.85 | 55157.86 | BS | ||||||||
| 2009 Nov 23 | 55158.97 | BS | |||||||||
| 2009 Nov 24 | 55159.10 | BS | |||||||||
| 2009 Nov 25 | 55160.15 | BS | |||||||||
| 2009 Nov 26 | 55161.07 | 55161.06 | BS | ||||||||
| 2009 Nov 27 | 55162.05 | 55162.94 | BS | ||||||||
| 2009 Nov 28 | 55163.03 | BS | |||||||||
| 2009 Nov 28 | 55163.94 | 55163.94 | BS | ||||||||
| 2009 Nov 30 | 55165.12 | BS | |||||||||
| 2009 Dec 01 | 55166.10 | BS | |||||||||
| 2009 Dec 01 | 55166.88 | BS | |||||||||
| 2009 Dec 03 | 55168.06 | BS | |||||||||
| 2009 Dec 05 | 55170.22 | IS | |||||||||
| 2009 Dec 06 | 55171.07 | IS | |||||||||
| 2009 Dec 07 | 55172.05 | 55172.01 | IS | ||||||||
| 2009 Dec 08 | 55173.03 | 55173.09 | 55173.92 | EIS | |||||||
| 2009 Dec 09 | 55174.28 | EIS | |||||||||
| 2009 Dec 10 | 55175.06 | EIS | |||||||||
| 2009 Dec 13 | 55178.92 | EIS |