The Herschel Virgo Cluster Survey VI: The far-infrared view of M87††thanks: Herschel is an ESA space observatory with science instruments provided by European-led Principal Investigator consortia and with important participation from NASA.
The origin of the far-infrared emission from the nearby radio galaxy M87 remains a matter of debate. Some studies find evidence of a far-infrared excess due to thermal dust emission, whereas others propose that the far-infrared emission can be explained by synchrotron emission without the need for an additional dust emission component. We present Herschel PACS and SPIRE observations of M87, taken as part of the science demonstration phase observations of the Herschel Virgo Cluster Survey. We compare these data with a synchrotron model based on mid-infrared, far-infrared, submm and radio data from the literature to investigate the origin of the far-infrared emission. Both the integrated SED and the Herschel surface brightness maps are adequately explained by synchrotron emission. At odds with previous claims, we find no evidence of a diffuse dust component in M87, which is not unexpected in the harsh X-ray environment of this radio galaxy sitting at the core of the Virgo Cluster.
Key Words.:
Galaxies: individual: M87 – radiation mechanisms: thermal – radiation mechanisms: non-thermal – infrared: galaxies1 Introduction
At a distance of 16.7 Mpc (Mei et al. 2007), M87 is the dominant galaxy of the Virgo Cluster. It is one of the nearest radio galaxies and was the first extragalactic X-ray source to be identified. Because of its proximity, many interesting astrophysical phenomena can be studied in more detail in M87 than in other comparable objects (see e.g. Röser & Meisenheimer (1999) for an overview). Among its many remarkable features is the several billion solar mass supermassive black hole at its centre (Macchetto et al. 1997; Gebhardt & Thomas 2009) and the prominent jet extending from the nucleus, visible throughout the electromagnetic spectrum. The central regions of M87, in particular the structure of the jet, have been studied and compared intensively at radio, optical, and X-ray wavelengths (e.g. Biretta et al. 1991; Meisenheimer et al. 1996; Böhringer et al. 2001; Perlman et al. 2001; Sparks et al. 2004; Perlman & Wilson 2005; Kovalev et al. 2007; Simionescu et al. 2008; Werner et al. 2010).
Compared to the available information at these wavelengths, our knowledge of M87 at far-infrared (FIR) wavelengths is rather poor. A controversial issue is the origin of the FIR emission in M87, i.e., the question of whether the FIR emission is caused entirely by synchrotron emission or whether there is an additional contribution from dust associated with either the global interstellar medium or a nuclear dust component. This question is partly driven by the observation of faint dust features in deep optical images (Sparks et al. 1993; Ferrarese et al. 2006). Several papers on the FIR emission of M87 arrive at different conclusions. Perlman et al. (2007) present ground-based Subaru and Spitzer IRS spectra of the M87 nucleus and find evidence of an excess at wavelengths longer than 25 m, which they attribute to thermal emission from cool dust at a characteristic temperature of some 55 K. This claim is countered by Buson et al. (2009), who present a higher signal-to-noise IRS spectrum of the nucleus. After careful subtraction of a stellar emission template from the mid-infrared spectrum, these authors conclude that the nuclear spectrum can be fully accounted for by optically thin synchrotron emission and that there is little room for dust emission. On a larger scale, Xilouris et al. (2004) present ISOCAM imaging of M87 and argue that the mid-infrared flux can be attributed to a single synchrotron emission component. Shi et al. (2007) present Spitzer IRAC and MIPS imaging of M87 and find a slight excess in the FIR over a power-law interpolation. They attribute this excess emission to dust emission from the host galaxy. Finally, Tan et al. (2008) observed 1.3 mm continuum emission from the nucleus and jet of M87 and found that the measured fluxes are generally consistent with synchrotron emission, although they could not rule out a possible nuclear contribution from thermal dust emission.
The recently launched Herschel Space Observatory (Pilbratt et al. 2010) offers the possibility to study M87 at FIR wavelengths in more detail than has been possible to date. The PACS (Poglitsch et al. 2010) and SPIRE (Griffin et al. 2010) instruments combined can produce images over the wavelength range between 70 and 500 m with unprecedented sensitivity and superior resolution. In this Letter, we present PACS and SPIRE imaging of M87 at 100, 160, 250, 350, and 500 m, taken as part of the science demonstration phase (SDP) observations of the Herschel Virgo Cluster Survey (HeViCS111More details on HeViCS can be found on http://www.hevics.org.). We combine these observations with mid-infrared, FIR, submm, and radio data from the literature to investigate the level and the origin of the FIR emission in M87. In Sect. 2, we present the observations and data reduction, Sect. 3 describes the analysis of the data and in Sect. 4 we present our conclusions.
2 Observations and data reduction
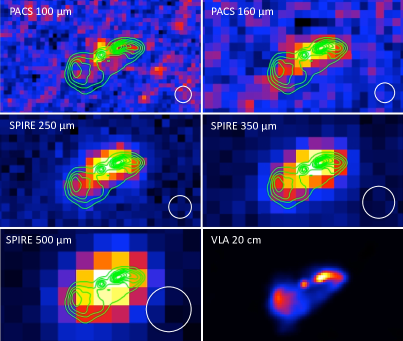
We observed M87 on 29 November 2009 with PACS and SPIRE as part of the HeViCS SDP observations. The HeViCS SDP field covers a deg2 field at the centre of the Virgo Cluster, roughly centred on M87. It was scanned with a 60″/s scanning speed in nomimal and orthogonal directions. Data were gathered simultaneously in the green and red PACS bands (100 and 160 m) and the three SPIRE bands (250, 350, and 500 m). The PACS and SPIRE data were reduced using HIPE, with reduction scripts based on the standard reduction pipelines. For more details of the HeViCS SDP data reduction, we refer to Davies et al. (2010). Figure 1 shows the Herschel images at the five PACS and SPIRE bands of the central regions of M87, which is clearly detected in all five bands.
3 Analysis

The most straightforward, first-order approach to investigating the origin of the FIR emission in M87 is to study its global spectral energy distribution (SED). Table 1 lists the Herschel fluxes of M87, together with ISOCAM, IRAS, MIPS, and SCUBA data gathered from the literature (Xilouris et al. 2004; Golombek et al. 1988; Shi et al. 2007; Haas et al. 2004). The top panel in Fig. 2 shows the SED in the infrared-submm-radio region between 15 m and 100 cm. Apart from the infrared-submm fluxes from Table 1, this plot shows GBT MUSTANG and VLA radio continuum fluxes from Cotton et al. (2009) and the most recent 5-year WMAP fluxes from Wright et al. (2009). The solid line is the best-fit power law for the ISOCAM, IRAS, MIPS, SCUBA, GBT, WMAP, and VLA data and has a slope ; the dotted line fits only the SCUBA, GBT, WMAP, and VLA data and has a slope .
The bottom panel in Fig. 2 shows the residual from the best-fit power law in the infrared-submm wavelength region; it is clear that the integrated Herschel fluxes are in full agreement with synchrotron radiation. The cyan line in this figure is a modified black-body fitted with K and . This temperature is the mean dust equilibrium temperature in the interstellar radiation field of M87, determined using the SKIRT radiative transfer code (Baes et al. 2003, 2005) and based on the photometry from Kormendy et al. (2009). The dust mass was adjusted to fit the upper limits of the residuals. It is clear that the SED of M87 is incompatible with dust masses higher than .
Although indicative, the analysis of the integrated SED does not definitely identify the origin of the FIR emission in M87. Approximating the global SED as a single power-law synchrotron model is indeeed an oversimplification of the complicated structure of M87. The bottom-right panel of Fig. 1 shows a high-resolution 20 cm image from the VLA FIRST survey (Becker et al. 1995; White et al. 1997), its contours being superimposed on the Herschel images. This 20 cm image identifies three distinct regions of significant synchrotron emission: the nucleus, the jet and associated lobes in the NW region, and the SE lobes. It is well-known that these different components have different spectral indices (e.g., Shi et al. 2007; Cotton et al. 2009) – detailed studies have shown that even within the jet, the spectral index can vary significantly (Biretta et al. 1991; Meisenheimer et al. 1996; Perlman et al. 2001). A spatially resolved analysis of the different regions of M87 is therefore a more powerful tool for investigating the origin of the FIR emission. Unfortunately, a full spatially resolved analysis of M87 using all Herschel bands is impractical. On the one hand, the PACS PSF is smeared significantly due to the rapid scan speed and the PACS images have a limited signal-to-noise ratio (hereafter S/N). The SPIRE images on the other hand have higher S/N, but the beam size is relatively large for a full spatially resolved analysis of the different components. The M87 nucleus, jet, and associated NW lobes are discernible in the three SPIRE bands, but the identification of faint emission in the SE lobes is difficult, particularly in the 500 m band. We therefore concentrated our efforts on the 250 m image, which provides the optimal compromise between S/N and spatial resolution.
Our analysis consisted of constructing a synchrotron model for the central regions of M87, based on the available ancillary images with sufficient field-of-view, resolution, and surface brightness sensitivity. We use the new 90 GHz radio continuum maps taken with the MUSTANG bolometer array presented by Cotton et al. (2009). These data have a resolution of 85 FWHM, hence closely match our Herschel data. The same authors also present archival VLA data at 15, 8.2, 4.9, 1.6, and 0.3 GHz of similar resolution, which were also used in our analysis. An image at 23 GHz was also available in the VLA archive, but it was not used in our analysis because it may be insensitive to extended structure because of a lack of short interferometer baselines. Finally, a Spitzer MIPS image at 24 m was extracted from the archive and reduced using the MIPS Data Analysis Tools (Gordon et al. 2005), as described in Young et al. (2009). As noted by Shi et al. (2007), a faint extended halo is visible in the 24 m image, which is probably caused by stellar emission and/or circumstellar dust. Because of the complexity of the image, we did not attempt to subtract this faint emission from the map; since the flux density in the central regions of M87 is strongly dominated by non-thermal emission from the nucleus, jet, and lobes, we are confident that this decision does not affect our results.
As a first step, we convolved the available images to the same resolution (85 FWHM), shifted them to the same astrometry (2″ pixel scale), and converted them to similar surface brightness units (MJy sr-1). The result is a data cube with seven points in the wavelength dimension covering an impressive wavelength range of nearly 5 orders of magnitude. Following the same strategy as Cotton et al. (2009), we fitted a second-order polynomial synchrotron model to each pixel of this data cube. The fits were performed with the MPFIT robust non-linear least squares curve fitting library in IDL (Markwardt 2009).
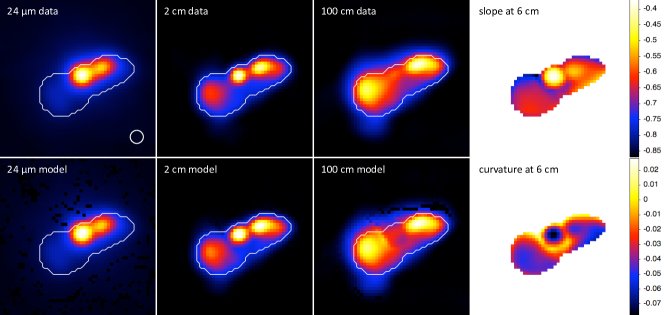
Figure 3 shows a comparison between the data and the resulting synchrotron models at 24 m, 2 cm, and 100 cm. The solid white line in these figures borders the spatial region where reliable surface brightnesses were available at all seven wavelengths. Outside this region, spectral fits were still made, but typically used fewer data points, e.g., because one of the radio images contained negative flux at the corresponding wavelengths. By inspecting the images on the top row, it is obvious that the synchrotron emission is not homogeneous in the different regions: the short wavelength radiation is dominated by the central source, whereas the jet and lobes dominate at the longer wavelengths. Comparing the top row panels with the corresponding bottom row panels, however, one can clearly see that, in spite of this different structure, our simple synchrotron model can reproduce the observed images very well over the entire wavelength range. The right-hand panels of Fig. 3 show the slope and the curvature of the synchrotron model at the reference wavelength of 6 cm. The slope varies from in the nuclear region to , and the curvature is modest ranging from slightly positive in the very faint regions to about in nucleus, jet, and lobes. These values are consistent with the values found by Cotton et al. (2009), who limited their fits to the radio regime between 3.3 mm and 100 cm.
| instrument | (m) | (Jy) | source |
|---|---|---|---|
| ISOCAM | 15 | Xilouris et al. (2004) | |
| MIPS | 24 | Shi et al. (2007) | |
| IRAS | 25 | Golombek et al. (1988) | |
| IRAS | 60 | Golombek et al. (1988) | |
| MIPS | 70 | Shi et al. (2007) | |
| IRAS | 100 | Golombek et al. (1988) | |
| PACS | 100 | 222We assume a conservative uncertainty in the PACS and SPIRE flux densities of 25%, which includes the 15% uncertainty in the absolute flux calibration (Poglitsch et al. 2010; Swinyard et al. 2010), uncertainties introduced by the map-making techniques, and the possible contamination of background objects. Colour corrections were applied, but they turned out to be very small (1.8% for the PACS 100 band and smaller than 1% for the remaining bands). | this paper |
| MIPS | 160 | Shi et al. (2007) | |
| PACS | 160 | 222We assume a conservative uncertainty in the PACS and SPIRE flux densities of 25%, which includes the 15% uncertainty in the absolute flux calibration (Poglitsch et al. 2010; Swinyard et al. 2010), uncertainties introduced by the map-making techniques, and the possible contamination of background objects. Colour corrections were applied, but they turned out to be very small (1.8% for the PACS 100 band and smaller than 1% for the remaining bands). | this paper |
| SPIRE | 250 | 222We assume a conservative uncertainty in the PACS and SPIRE flux densities of 25%, which includes the 15% uncertainty in the absolute flux calibration (Poglitsch et al. 2010; Swinyard et al. 2010), uncertainties introduced by the map-making techniques, and the possible contamination of background objects. Colour corrections were applied, but they turned out to be very small (1.8% for the PACS 100 band and smaller than 1% for the remaining bands). | this paper |
| SPIRE | 350 | 222We assume a conservative uncertainty in the PACS and SPIRE flux densities of 25%, which includes the 15% uncertainty in the absolute flux calibration (Poglitsch et al. 2010; Swinyard et al. 2010), uncertainties introduced by the map-making techniques, and the possible contamination of background objects. Colour corrections were applied, but they turned out to be very small (1.8% for the PACS 100 band and smaller than 1% for the remaining bands). | this paper |
| SCUBA | 450 | Haas et al. (2004) | |
| SPIRE | 500 | 222We assume a conservative uncertainty in the PACS and SPIRE flux densities of 25%, which includes the 15% uncertainty in the absolute flux calibration (Poglitsch et al. 2010; Swinyard et al. 2010), uncertainties introduced by the map-making techniques, and the possible contamination of background objects. Colour corrections were applied, but they turned out to be very small (1.8% for the PACS 100 band and smaller than 1% for the remaining bands). | this paper |
| SCUBA | 850 | Haas et al. (2004) |
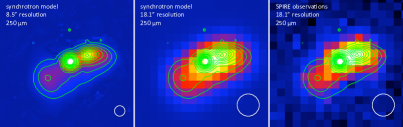
For the next step in our analysis, we used our synchrotron model to predict the emission of M87 at 250 m. The left panel of Fig. 4 shows the synchrotron model prediction at 250 m at the model resolution. By far the brightest peak of the model is located at the position of the nucleus; the jet is clearly visible as a second bright component, whereas the SE lobe is visible as an extended, low surface brightness region with a peak surface brightness that is almost five times fainter than the nucleus (23 MJy sr-1 versus 110 MJy sr-1). When we convolve this synchrotron model image with the SPIRE 250 m beam and rebin it to match the observed SPIRE image astrometry, the three different components corresponding to nucleus, jet, and SE lobes merge into a single extended structure with one elongated peak 4″ to the west of the nucleus. Comparing the central and right panels of Fig. 4, we see that the synchrotron model is capable of explaining the observed SPIRE 250 m image satisfactorily.
4 Conclusion
For both the integrated SED and the SPIRE 250 m map, we have found that synchrotron emission is an adequate explanation of the FIR emission. We do not detect a FIR excess that cannot be explained by the synchrotron model. In particular, we have no reason to invoke the presence of smooth dust emission associated with the galaxy interstellar medium, as advocated by Shi et al. (2007). For a dust temperature of 23 K, which is the expected equilibrium temperature in the interstellar radiation field of M87, we find an upper limit to the dust mass of . Our result agrees with the analysis of the nuclear emission by Buson et al. (2009). Clemens et al. (2010) discuss the lifetimes of interstellar dust grains in elliptical galaxies in the Virgo Cluster based on Herschel observations and find an upper limit to the amorphous silicate grain survival time of less than 46 million years. Given that M87 is a luminous X-ray source, the absence of a substantial dust component is not a surprise. A low dust content is also in agreement with the non-detection of cool molecular gas (Salomé & Combes 2008; Tan et al. 2008) and the non-detection of significant intrinsic absorption in the X-ray spectra of M87 (Böhringer et al. 2002). Our conclusion is that, seen from the FIR point of view, M87 is a passive object with a central radio source emitting synchrotron emission, without a substantial diffuse dust component.
Acknowledgements.
The National Radio Astronomy Observatory (NRAO) is operated by Associated Universities Inc, under cooperative agreement with the National Science Foundation.References
- Baes et al. (2003) Baes, M., et al. 2003, MNRAS, 343, 1081
- Baes et al. (2005) Baes, M., Dejonghe, H., & Davies, J. I. 2005, The Spectral Energy Distributions of Gas-Rich Galaxies: Confronting Models with Data, 761, 27
- Becker et al. (1995) Becker, R. H., White, R. L., & Helfand, D. J. 1995, ApJ, 450, 559
- Biretta et al. (1991) Biretta, J. A., Stern, C. P., & Harris, D. E. 1991, AJ, 101, 1632
- Böhringer et al. (2001) Böhringer, H., et al. 2001, A&A, 365, L181
- Böhringer et al. (2002) Böhringer, H., et al. 2002, A&A, 382, 804
- Buson et al. (2009) Buson, L., et al. 2009, ApJ, 705, 356
- Clemens et al. (2010) Clemens, M., et al. 2010, A&A, this issue
- Cotton et al. (2009) Cotton, W. D., et al. 2009, ApJ, 701, 1872
- Davies et al. (2010) Davies, J. I., et al. 2010, A&A, this issue
- Ferrarese et al. (2006) Ferrarese, L., et al. 2006, ApJS, 164, 334
- Gebhardt & Thomas (2009) Gebhardt, K., & Thomas, J. 2009, ApJ, 700, 1690
- Golombek et al. (1988) Golombek, D., Miley, G. K., & Neugebauer, G. 1988, AJ, 95, 26
- Gordon et al. (2005) Gordon, K. D., et al. 2005, PASP, 117, 503
- Griffin et al. (2010) Griffin, M., et al. 2010, A&A, this issue
- Haas et al. (2004) Haas, M., et al. 2004, A&A, 424, 531
- Kormendy et al. (2009) Kormendy, J., Fisher, D. B., Cornell, M. E., & Bender, R. 2009, ApJS, 182, 216
- Kovalev et al. (2007) Kovalev, Y. Y., et al. 2007, ApJ, 668, L27
- Macchetto et al. (1997) Macchetto, F., Marconi, A., Axon, D. J., Capetti, A., Sparks, W., & Crane, P. 1997, ApJ, 489, 579
- Markwardt (2009) Markwardt, C. B. 2009, ASP Conf. Ser., 411, 251
- Marshall et al. (2002) Marshall, H. L., et al. 2002, ApJ, 564, 683
- Mei et al. (2007) Mei, S., et al. 2007, ApJ, 655, 144
- Meisenheimer et al. (1996) Meisenheimer, K., Roeser, H.-J., & Schloetelburg, M. 1996, A&A, 307, 61
- Owen et al. (2000) Owen, F. N., Eilek, J. A., & Kassim, N. E. 2000, ApJ, 543, 611
- Perlman et al. (2001) Perlman, E. S., Biretta, J. A., Sparks, W. B., Macchetto, F. D., & Leahy, J. P. 2001, ApJ, 551, 206
- Perlman & Wilson (2005) Perlman, E. S., & Wilson, A. S. 2005, ApJ, 627, 140
- Perlman et al. (2007) Perlman, E. S., et al. 2007, ApJ, 663, 808
- Pilbratt et al. (2010) Pilbratt, G., et al. 2010, A&A, this issue
- Poglitsch et al. (2010) Poglitsch, A., et al. 2010, A&A, this issue
- Röser & Meisenheimer (1999) Röser, H.-J., & Meisenheimer, K. 1999, The Radio Galaxy Messier 87, 530,
- Salomé & Combes (2008) Salomé, P., & Combes, F. 2008, A&A, 489, 101
- Shi et al. (2007) Shi, Y., et al. 2007, ApJ, 655, 781
- Simionescu et al. (2008) Simionescu, A., et al. 2008, A&A, 482, 97
- Sparks et al. (1993) Sparks, W. B., Ford, H. C., & Kinney, A. L. 1993, ApJ, 413, 531
- Sparks et al. (2004) Sparks, W. B., et al. 2004, ApJ, 607, 294
- Swinyard et al. (2010) Swinyard B., Ade P., Baluteau J.-P., et al. 2010, A&A, this issue
- Tan et al. (2008) Tan, J. C., Beuther, H., Walter, F., & Blackman, E. G. 2008, ApJ, 689, 775
- Xilouris et al. (2004) Xilouris, E. M., et al. 2004, A&A, 416, 41
- Werner et al. (2010) Werner, N., et al. 2010, arXiv:1003.5334
- White et al. (1997) White, R. L., Becker, R. H., Helfand, D. J., & Gregg, M. D. 1997, ApJ, 475, 479
- Wright et al. (2009) Wright, E. L., et al. 2009, ApJS, 180, 283
- Young et al. (2009) Young, L. M., Bendo, G. J., & Lucero, D. M. 2009, AJ, 137, 3053