Statistical thermodynamics and weighted topology of radial networks
Abstract
We propose a method of characterizing radial networks based on a partition function associated with the structural triangulation of the network. The internal energy, Helmholtz free energy, and entropy derived from the partition function are used to group similar networks together and to interrogate the history of their development. We illustrate our methodology for a model for optimal transport in tree leaves.
pacs:
89.75.Hc, 89.75.Fb, 05.20.-yInterest in networks has expanded rapidly in recent years albert02 ; boccaletti06 ; dorogovtsev08 . In particular, there has been substantial interest in problems associated with modelling venation patterns corson10 ; clarke06 ; runions05 , optimizing supply networks katifori10 ; dodds10 , and determining final system shapes and sizes based on a simulated growth mechanisms xia07 .
The characteristics of a network are determined by the supply and demand mechanisms of the system. For example, a leaf is supplied with nutrients and sunlight as energy sources, and demand is created by the biological drive to keep the leaf cells alive and the leaf growing. For a river ending in a delta, the supply is the amount of rain falling, and demand is created by the pull of gravity, the amount of water dissipation, and the terrain of the delta.
The rules and parameters governing the supply and demand of a system are expected to be invariant over time scales beyond its lifespan. Hence, the same rules and parameters govern the creation and the extinction states of a system. What happens between these is affected by external factors. For example, a leaf may suffer under less than ideal weather conditions or a river may be affected by the construction of a dam.
An important question is whether systems can be grouped according to their shape and venation at a given state in their lifespan. Going a step further, one may ask whether interpretations of life history can be made by analyzing and comparing a state in the lifespan of a system to a comparable state of another system. We expect that the growth history of a system is encoded in the distribution of energy in its venation, i.e. the work done in building up the supply system. Due to external factors and the existing structure of the system, some parts of a venation system may have required more energy to build up than other parts.
In this paper, we introduce a method for measuring the energy distribution of the venation of a network based on a partition function calculated from its energy states, as represented by a structural triangulation. The partition function is used to calculate thermodynamic variables, which enable systems to be grouped together at their maturation state – the state when the system stops growing, as well as enabling the development of a network to be investigated. We illustrate our methodology by analyzing simulated tree leaves.
Topological invariants are used to characterize shapes and structures of geometrical objects. A prominent example is the Euler characteristic nakahara03 , a measure of the topological structure of a space that is invariant under deformations. For convex polytopes, for example, where , and are the numbers of vertices, edges and faces, respectively, of the polytope.
We will focus on planar radial networks with a single origin and without loops. Let the venation of the system consist of edges connecting vertices , with one vertex designated as the origin , which is associated with the first generation of the network, . Then, an edge always connects an th generation vertex, , to an th generation vertex, .
We define a triangular element as a set of three vertices, , such that the generational association is and . A triangular element is assigned the generation , which corresponds to the lowest generational number of its vertices. We emphasize that there is no intersection between triangular elements. The set of all triangular elements in a network is called the triangulation of that network. Although we have not proven so, the uniqueness of the triangulation of a network according to the foregoing prescription is a plausible working hypothesis.
Two venation networks and their triangulations are shown in Fig. 1. Each triangular element not only has an associated generation , but also an associated area . While the structure of a triangulation is unchanged by deformations of the network, the areas of the elements allow the original and transformed networks to be distinguished. Accordingly, we use the generation and area associated with the triangular elements as a measure of the energy distribution in a venation. In effect, we have a weighted topological description of the network based on its triangulation.
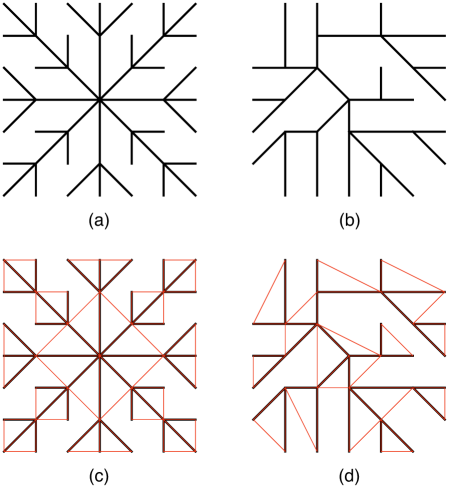
For increasing generation number , the system expends correspondingly more energy creating a vertex and element associated with . The system must move material from the supply source at the origin to the position of . A reasonable physical interpretation for is, therefore, an energy level of the system. If the energy unit of the system is , the energy is the work required to produce a unit at generation : . Building on this point of view, a natural interpretation of the area of an element is a measure of the material needed to assemble this element at generation . In general, if the material needed for an element of the system is , then , where is a proportionality constant. Without loss of generality, we take to be a positive integer, and set . This requires the coordinates of the vertices to be integer-valued as well, , such that the network is embedded in an integer lattice . This modification is not a requirement, but it allows us to interpret as the number of ‘particles’ with energy required to create the triangle element .
We are now able to define the partition function of the triangulation as
| (1) |
where and the inverse temperature. The factor originates from the fact that particles in the same generation are assigned to the same energy level . The partition functions for the networks in Fig. 1 are
| (2) | ||||
| (3) |
where and are the triangulations in Fig. 1(c) and 1(d), respectively.
The partition function is the sum over the microstates the system can occupy. These are identified in the network as ‘particles’ that have an associated history. To create a particle in element , the network had to occupy a specific state where work was done to create this particle. Accordingly, when we sum over all network system particles in (1), we are indeed summing over all microstates in its history with associated energy . Because energy levels depend on the generation of the triangle elements which, in turn, depend on the structure of the venation, the partition function in (1) can be considered not only as a statistical measure of the network, but also as a measure of the structure of the venation. Therefore, we expect two systems with similar partition functions to display similar venation structures.

The partition function enables us to calculate thermodynamic variables for the network. The internal energy is
| (4) |
Figure 2(a) shows that for all . In the first few generations (large ), the internal energies of the two networks are similar, but diverge as higher generations are included (decreasing ). The physical interpretation of this is that there has been more work done by the network system to create the venation of the asymmetric network in Fig. 1(b) than that of the symmetric network in Fig. 1(a). Thus, the structure of the asymmetric network displays a higher internal energy through more elements being in higher generations of the system than in the symmetric network. These qualitative trends can already be seen in the partition functions. In general, we expect that a network which displays a higher degree of venation symmetry than another network system to have the lower internal energy.
The entropy in the canonical ensemble, where we have set Boltzmann’s constant . As Fig. 2(b) shows, for all . To understand this result, we identify entropy with the energy dispersal in the network, rather than as a measure of structural ‘disorder’ of the venation. The energy in the symmetric network is more evenly distributed between the different generations than in the asymmetric network and, hence, has the higher entropy. Two limiting forms of the entropy are especially useful. As (), the entropy approaches the logarithm of the triangulated area associated with the first generation:
| (5) |
The other limit is (), where the entropy approaches the logarithm of the area of the entire triangulation:
| (6) |
Both of these limits can be obtained directly from the partition function; the interesting situation is when the entropy curves of different networks cross.
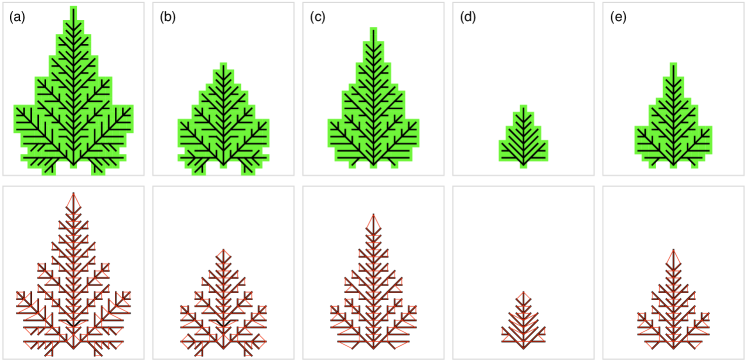
We consider now a model for leaf growth based on the notion of optimized transport. Supplying a leaf with water and nutrients has a cost. Minimizing that cost determines the shape of the leaf. We follow Xia xia07 in developing a model for the supply network of tree leaves that is parametrized by three quantities that characterize the cost function associated with extending the network. The transport cost is minimized when nutrients are moved in the same direction and maximized when moved in opposing directions. We eliminate the option of opposite flows in the transport network by setting the cost of sustaining such a flow to infinity. For all other flows, the parameter scales the extent to which the flow direction contributes to the total cost of sustaining the supply network. Another cost is associated with supply flowing through a network edge. The more matter that flows through an edge, the larger the cross-sectional area of that edge which requires more energy to sustain the pressure in the descendant supply network. The ‘thickness’ of a given edge is proportional to its weight, so the cost of maintaining an edge with a particular weight leads to a second parameter, . A third parameter, , is an efficiency coefficient for photosynthesis.
Using this model of leaf growth, we have simulated the growth of five tree leaves, which are shown in Fig. 3, together with their parameters in the cost function. The corresponding thermodynamic functions are shown in Fig. 4. The thermodynamic profiles of the tree leaves have two regimes that are of particular interest. The high energy regime () can be associated with the late stage of the leaf development process, while the low energy regime ()with the early stage of development.

The internal energy profiles show that, in the early stages of growth (), similar work has been done to ‘build’ all five leaves. In the later stages of development, the amount of work for leaf (d) becomes the lowest, which agrees with intuitive expectations, since this leaf is the smallest in the sample. The entropy and internal energies of leaves (a) and (b) are essentially indistinguishable during the early stages of growth, as are those of leaves (c) and (e). However, discernible differences in these quantities appear at later stages. Leaf (d) is different from all other leaves because of its size, and this is also apparent from its thermodynamic functions. The entropy of leaf (d), in particular, shows a qualitatively different profile from all other leaves, which is consistent with our earlier interpretation of entropy as the distribution of energy between the different generations in a network.
The free energy profiles allow us to classify the sample leaves into two main groups: and . This grouping is confirmed by the low-energy limit () of the entropy profiles of the tree leaves, where the entropies of the tree leaves correspond to the areas of their triangulations in the first generation, as noted in (5). For leaves with the same initial entropy, differences arise when later generations of the triangulation are included. This is due to differences in the optimization parameters used for the simulations.
We have described a method for analyzing networks based on a triangulation that associates an energy with each generation of the network. This enables a partition function to be constructed from which standard thermodynamic functions can be directly computed. The interpretation of these functions for networks provides a powerful classification scheme. The comparison of the internal energy, entropy, and Helmholtz free energy for several simulated leaves, all of which grow by the same mechanism, but with differently parametrized cost functions, illustrates how our methodology is able to discriminate between networks that show subtle structural differences. Our method differs from other thermodynamic formulations of networks bianconi08 ; bianconi09 in that our method characterizes individual networks through their triangulation, rather than requiring an ensemble of networks.
Perhaps the most far-reaching aspect of our analysis is that we are able to study the history of a family of networks, especially where the early stages of development are similar, but then deviate at some later stage, either from an intrinsic mechanism, as shown here, or from an external influence. Hence, our method is eminently suitable for examining biological networks, where the entire developmental history, rather than simply the fully-developed network, has fundamental importance.
R.-K. S. is grateful for the support of Placental Analytics LLC.
References
- (1) R. Albert and A.-L. Barabási, Rev. Mod. Phys. 74, 47 (2002).
- (2) S. Boccaletti, V. Latora, Y. Moreno, M. Chavez, and D. U. Hwang, Phys. Rep. 424, 175 (2006).
- (3) S. N. Dorogovtsev, A. Goltsev, and J. F. F. Mendes, Rev. Mod. Phys. 80, 1275 (2008).
- (4) F. Corson, Phys. Rev. Lett. 104, 048703 (2010).
- (5) J. Clarke, S. Barman, P. Remagnino, K. Bailey, D. Kirkup, S. Mayo and P. Wilkin, in Advances in Visual Computing (Springer, Berlin, 2006), pp. 427-436.
- (6) A. Runions, M. Fuhrer, B. Lane, P. Feder, A. Rolland-Lagan, P. Prusinkiewicz, in International Conference on Computer Graphics and Interactive Techniques, (ACM, New York, 2005), pp. 702-711.
- (7) E. Katifori, G. J. Szöllősi, and M. O. Magnasco, Phys. Rev. Lett. 104, 048704 (2010).
- (8) P. S. Dodds, Phys. Rev. Lett. 104, 048702 (2010).
- (9) Q. Xia, ESAIM Control Optim. Calc. Var. 13, 359 (2007).
- (10) M. Nakahara, Geometry, Topology and Physics (IOP Publishing Ltd., Bristol, UK, 2003).
- (11) G. Bianconi, EPL 81, 28005 (2008).
- (12) G. Bianconi, Phys. Rev. E 79, 036114 (2009).