Electron-Hole Asymmetry in Superconductivity of Pnictides Originated from the Observed Rigid Chemical Potential Shift
Abstract
We have performed a systematic photoemission study of the chemical potential shift as a function of carrier doping in a pnictide system based on BaFe2As2. The experimentally determined chemical potential shift is consistent with the prediction of a rigid band shift picture by the renormalized first-principle band calculations. This leads to an electron-hole asymmetry (EHA) in the Fermi surface (FS) nesting condition due to different effective masses for different FS sheets, which can be calculated from the Lindhard function of susceptibility. This built-in EHA from the band structure, which matches well with observed asymmetric superconducting domes in the phase diagram, strongly supports FS near-nesting driven superconductivity in the iron pnictides.
pacs:
74.70.Pq, 71.30.+h, 79.60.-iEven though the detail of the pairing mechanism in the recently discovered iron-based superconductors is still under intense debate, several theoretical investigations Mazin ; Kuroki ; Wang ; Seo ; Cvetkovic and experimental observations Ding ; Chris ; RichardP ; Terashima ; Sekiba strongly suggest the importance of inelastic inter-band scattering between hole and electron Fermi surface (FS) pockets connected the antiferromagnetic (AF) wave vector. Within this framework, the pairing strength depends on near- or quasi-nesting, here defined as a large enhancement of the spin susceptibility at a well defined wave vector Cvetkovic . The near-nesting conditions depend on the shape and size of the various FS pockets, which are tuned by the position of the chemical potential. The evolution of the chemical potential with carrier concentration is thus a key issue to understand the evolution of FS near-nesting and superconductivity in these materials.
The 122-structural phase of BaFe2As2 is particularly suitable for a systematic study of the chemical potential shift since it can be doped either by electrons or holes following Fe2+ Co3+ or Ba2+ K+ partial substitutions, respectively. Interestingly, the electron- and hole-doped sides of the phase diagram show some noticeable differences. For example, while the maximum value for the hole-doped side reaches 37 K at ambient pressure, it tops around 25 K for the electron-doped systems. Similarly, the superconducting dome extends to much higher doping in the hole-doped case, with an optimal concentration of around 0.2 hole/Fe against 0.08 electron/Fe for the electron-doped side.
Angle-resolved photoemission spectroscopy (ARPES) is a powerful tool to access directly the electronic structure with respect to the chemical potential. Our previous ARPES studies have already revealed strong variations in the pairing strengths associated with the various FS sheets in the electron-doped compounds Terashima as compared to the hole-doped ones Ding ; Nakayama , as well as the deterioration of the near-nesting conditions in highly overdoped samples for which vanishes or is significantly suppressed Sekiba ; Sato . Although near-nesting was naturally proposed to explain these anomalies, this concept has not been linked to the origin of the electron-hole asymmetry (EHA) and up to date there is still no systematic investigation of the impact of the chemical potential shift on the band structure throughout the whole phase diagram.
In this letter, we present a systematic ARPES study of the chemical potential as a function of carrier doping in the 122-pnictides. With doping, the chemical potential moves smoothly with respect to the low-energy valence states, in agreement with our local density approximation (LDA) calculations. However, we observed anomalously larger (smaller) core level shift than the valence band shift on the hole (electron)-doped side for the relatively undisturbed As 3 core levels, possibly due to the screening effect which increases (decreases) the core level shifts upon hole (electron) doping. Based on a rigid band shift approximation justified by our experimental results, we computed the doping dependence of the Lindhard spin susceptibility at the AF wave vector, and found that the Lindhard function itself is asymmetric as a function of doping, in a similar fashion as the asymmetry between the hole and electron superconducting domes. This strongly supports FS-near-nesting-enhanced superconductivity in the pnictides.
The high-quality single crystals of the 122 series used in this study were grown by the flux method Chen . Low-energy electron diffraction on mirror-like cleaved surfaces show a sharp 1 x 1 pattern in the non-magnetic phase. High-resolution (4-20 meV) ARPES measurements of the low-energy electronic structure were performed in the photoemission laboratory of Tohoku University using a microwave-driven Helium source ( = 21.218 eV) and core level studies were done at the Synchrotron Radiation Center and the Advanced Light Source in USA, as well as at the Photon Factory in Japan, using various photon energies. Our experiments have been performed using high-efficiency VG-Scienta SES-100, SES-2002 and R4000 electron analyzers. Samples were cleaved in situ and measured at 7-40 K in a vacuum better than 1 x 10⁻¹⁰ torr. The samples have been found to be very stable and without degradation for the typical measurement period of 20 hours.
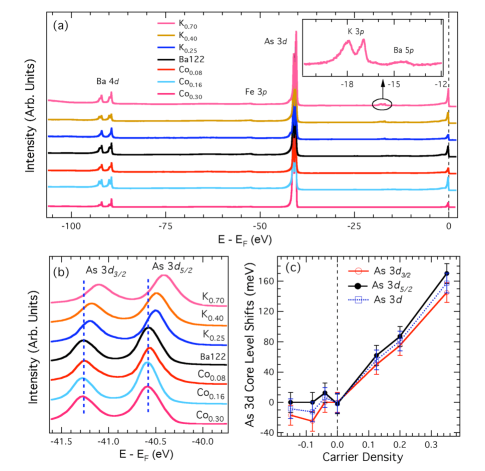
Photoemission allows measurement of the core level states relative to the chemical potential. It has been used widely in the past to study the chemical potential shift in high- cuprates Yagi ; Harima ; Golden . Fig. 1(a) shows a comparison of the core levels in the 0-110 eV binding energy range of 7 samples distributed in the electron-doped and hole-doped sides of the phase diagram. These samples are BaFe1.70Co0.30As2 ( = 0 K), BaFe1.84Co0.16As2 ( = 20 K), BaFe1.92Co0.08As2 ( = 0 K), Ba2Fe2As2 ( = 0 K), Ba0.75K0.25Fe2As2 ( = 26 K), Ba0.60K0.40Fe2As2 ( = 37 K), and Ba0.30K0.70Fe2As2 ( = 22 K). For simplicity, here after we call them Co0.30, Co0.16, Co0.08, Ba122, K0.25, K0.40 and K0.70, respectively. From low to high binding energies, we observed the Fe 3 (around the Fermi level), Ba 5 (14.5 eV), K 3 (18 eV), As 3 ( 40.4 and 41.3 eV) and Ba 4 ( 89.5 and 92 eV) states, respectively. In particular, the As 3 peaks are very strong in all compounds regardless of Co and K doping. Based on a previous photoemission study Golden1 that indicates that the As atoms in BaFe2As2 are not perturbed significantly at the cleaved surface, we used the As 3 core levels to investigate the doping dependence of the chemical potential. In Fig. 1(b), we show a zoom of the As 3 core levels of all compounds. The position of the peaks moves towards the lower binding energies as K concentration increases. In contrast, the peak positions are almost unaffected by Co-doping. We plot in Fig. 1(c) the shift of the As 3 and As 3 levels as a function of carrier density, which is half of the value x for both K and Co dopings. The blue dashed line in Fig. 1(c) gives the average of the As 3 peaks as a function of doping.
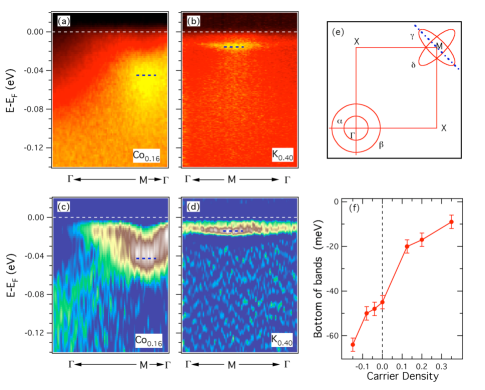
An alternative and more direct determination of the chemical potential shift is obtained by looking at the band dispersion near the Fermi level (). In Figs. 2(a) and (b), we present ARPES intensity plots of the Co0.16 and K0.40 samples along a cut passing through M as indicated in Fig. 2(e). The corresponding second derivative intensity plots are displayed in Figs. 2(c)-(d). The blue dashed lines are guides to the eye indicating the bottom of the upper electron band (the band as defined in Ref. Hong1, ). The bottom of this electron band at the M point moves down from as the signed concentration decreases (more electrons), which is what we expect from simple band filling. In particular, this behavior supports the assumption that the Fe Co substitution electron-dope the Fe layer, in contrast to a recent density functional theory calculation suggesting that Co and Ni only act as scattering centers in the Fe planes wadati . It is also consistent with the observation of a downshift of the -centered holelike bands in the Co-doped side Sekiba . Fig. 2(f) summarizes our results of the seven differently doped samples and gives the position of the bottom of the electron band as a function of the carrier density.
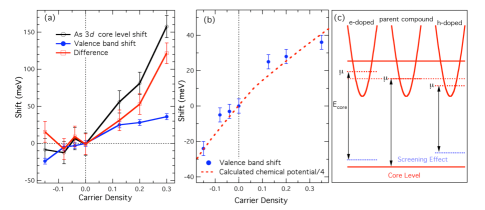
At this point, it is instructive to compare LDA calculations to the core level shifts and the shift of the bottom of the electron band, which corresponds to the chemical potential shift in a rigid band picture. The results are summarized in Fig. 3. It is clear from Fig. 3(a) that the core level shift is not the same as the shift of the valence band, and the difference between them are larger on the hole-doped side, which will be discussed below. Interestingly, the theoretically calculated chemical potential shift is very much consistent with the observed valence band shift when theoretical values are divided by 4 as shown in Fig. 3(b), which is understood in terms of the band renormalization reported in previous ARPES studies Hong1 ; Terashima ; Sekiba ; Sato . This indicates that the shift of the valence band corresponds to the chemical potential shift, and consequently, the rigid band picture derived from the renormalized band structure is valid.
The core level shift can be understood as follows. The core level shift is related to the chemical potential shift by the relation:
where is the change in valency, is a constant, is a shift due to change in the Madelung potential, and is the change in the core-carrier screening Hufner . Doping is not expected to change the As valency. This implies that the term can be neglected. Therefore, the difference between the core level and the chemical potential shift represented in Fig. 3(a) by the red line is only related to and . It is known that the screening term is proportional to the mobile carrier concentration, thus one expects that it has the same sign on the electron- and hole-doped sides and increases with doping. Such doping dependence of the screening term, as indicated in Fig. 3(c), will increase (reduce) the core level shift caused by the chemical potential shift on the hole (electron)-doped side. This is consistent with our observation of different behaviors of the core level shift on hole- and electron-doped sides. We note that the change of the Madelung term may not be same on hole- and electron-doped sides, which can further enhance the difference of the core level shift on the two sides.
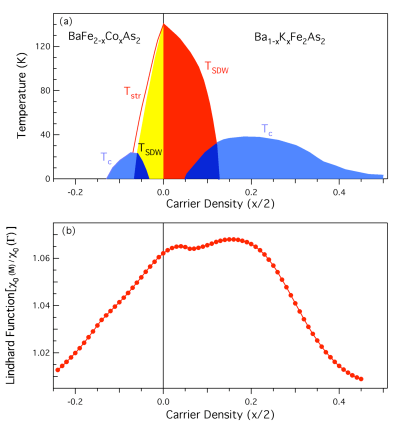
The above analysis suggests that a rigid band picture constitutes a good first approximation of the evolution of the chemical potential in the 122 family of iron-pnictides. We now ask a simple but fundamental question: is FS near-nesting able to explain the electron-hole asymmetry of the superconducting domes shown in the phase diagram of the 122-pnictides of Fig. 4(a)? To answer this question, it is necessary to compute the spin susceptibility. It is especially important to understand how the susceptibility evolves at the near-nesting (or AF) wave vector. We use the band structure calculated by LDA to compute the doping dependence of the Lindhard spin susceptibility at the near-nesting wave vector Xu_LDA ; Wang_LDA . We limit our calculations to the elastic component of the spin susceptibility. The results are displayed in Fig. 4(b). Interestingly, the hole- and electron-doped sides exhibit a strong asymmetry: while the Lindhard function decreases monotonically on the electron-doped side (with a small shoulder around 0.12), it keeps a high value for a wide hole doping range before starting to decrease. Remarkably, the maximum value of the calculated susceptibility is obtained near the experimental optimal hole doping, and the Lindhard function using the FS nesting wave vector tracks the superconducting transition qualitatively well. It is important to note that such an asymmetry in the Lindhard susceptibility would lead to a higher dielectric function and consequently to a larger screening effect on the hole-doped side. This is qualitatively consistent with the observed larger difference between the core level shift and the chemical potential shift on the hole-doped side shown in Fig. 3(a). We caution that the non-magnetic LDA calculations are no longer valid in the spin density wave (SDW) state because the band structure undergoes unconventional band folding that leads to the formation of Dirac cones Richard .
The basic reason for electron-hole asymmetry in the calculated Lindhard function is as follows. The effective masses of the holelike bands, especially the band, are larger than that of the electronlike bands at the M point, as observed by ARPES Hong1 and quantum oscillation experiments dHvA . To satisfy the Luttinger theorem, their top of band at zero doping must thus be closer to than the bottom of the electron bands. Indeed, even for optimally hole-doped samples, the top of the band is located only 25 meV above RichardP . As a consequence, the holelike bands sink below with electron doping much faster than the bottom of the electron bands are pushed above with hole doping. Therefore, the FS near-nesting conditions are more robust in the hole-doped case. The built-in asymmetry regarding the FS near-nesting condition on the electron- and hole-doped sides offer a simple but powerful clue that the FS near-nesting with the AF wave vector triggers superconductivity in the pnictides.
In conclusion, we have presented the doping dependence of the chemical potential in the 122 family of iron-pnictides. As a first approximation, our results are consistent with a rigid band shift and with renormalized LDA calculations. The doping dependence of the As 3 core levels does not follow that of the chemical potential, suggesting a non-negligible screening effect. Within the rigid band shift approximation, the calculated Lindhard function at the FS-nesting wave vector based on the LDA band structure reveals an electron-hole asymmetry in the iron pnictides, which matches well with the observed electron-hole asymmetry of the superconducting domes in the phase diagram. Our findings reveal the importance of FS near-nesting in the pairing mechanism of the iron-based superconductors.
This work was supported by grants of US DMR-0800641, DMR-0704545, US DOE DE-SC0002554, and China NSF. The Tohoku group acknowledge support from JSPS, JST-TRIP, JST-CREST and MEXT of Japan. This work is based upon research conducted at the Synchrotron Radiation Center supported by NSF DMR-0537588, the Advanced Light Source supported by DOE No. De-AC02-05CH11231 and at KEK-PF under the approval of Photon Factory Program Advisory Committee Proposal No. 2009S2-005 at the Institute of Material Structure Science, KEK.
References
- (1) I. I. Mazin et al., Phys. Rev. Lett. 101, 057003 (2008).
- (2) K. Kuroki et al., Phys. Rev. Lett. 101, 087004 (2008).
- (3) F. Wang et al., Phys. Rev. Lett. 102, 047005 (2009).
- (4) K. Seo et al., Phys. Rev. Lett. 101, 206404 (2008).
- (5) V. Cvetkovic et al., Europhys. Lett. 85, 37002 (2009).
- (6) H. Ding et al., Europhys. Lett. 83, 47001 (2008).
- (7) A. D. Christianson et al., Nature (London) 456, 930 (2008).
- (8) Y. Sekiba et al., New J. Phys. 11, 025020 (2009).
- (9) K. Terashima et al., P. Natl. Acad. Sci., USA 106, 7330 (2009).
- (10) P. Richard et al., Phys. Rev. Lett. 102, 047003 (2009).
- (11) K. Nakayama et al., Europhys. Lett. 85, 67002 (2009).
- (12) T. Sato et al., Phys. Rev. Lett. 103, 047002 (2009).
- (13) G. F. Chen et al., Phys. Rev. B 78, 224512 (2008).
- (14) K. Maiti et al., Phys. Rev. B 80, 165132 (2009).
- (15) H. Yagi et al., Phys. Rev. B 73, 172503 (2006).
- (16) N. Harima et al., Phys. Rev. B 67, 172501 (2003).
- (17) S. de Jong et al., Phys. Rev. B 79, 115125 (2009).
- (18) H. Ding et al., arXiv:0812.0534.
- (19) H. Wadati et al., arXiv:1003.2663.
- (20) S. Hüfner, Photoelectron Spectroscopy (Springer-Verlag, Berlin, 1995).
- (21) M. Rotter et al., Angew. Chem. Int. Ed. 47, 7947 (2008).
- (22) D. K. Pratt et al., Phys. Rev. Lett. 103, 087001 (2009).
- (23) G. Xu et al., Europhys. Lett. 84, 67015 (2008).
- (24) G. T. Wang et al., Phys. Rev. Lett. 104, 047002 (2010).
- (25) P. Richard et al., Phys. Rev. Lett. 104, 137001 (2010).
- (26) J. G. Analytis et al., arXiv:1002.1304.