Radio Polarimetry of 3C 119, 3C 318, and 3C 343 at milliarcsecond resolution
Abstract
Aims. We report new Very Long Baseline Array (VLBA) polarimetric observations of the Compact Steep-Spectrum (CSS) sources 3C 119, 3C 318, and 3C 343 at 5 and 8.4 GHz.
Methods. By using multifrequency VLBA observations we have derived milliarcsecond-resolution images of the total intensity, polarisation, and rotation measure () distributions.
Results. The CSS source 3C 119, associated with a possible quasar, has source rest-frame values up to 10200 rad m-2 in a region which coincides with a change in the direction of the inner jet. This component is located 325 pc from the core, which is variable and has a peaked radio spectrum. In the case of 3C 318, associated with a galaxy, a rest-frame of 3030 rad m-2 has been estimated for the brightest component which contributes almost all of the polarised emission. Further, two more extended components have been detected, clearly showing “wiggles” in the jet towards the southern side of the source. The CSS source 3C 343 contains two peaks of emission and a curved jet embedded in more diffuse emission. It exhibits complex field directions near the emission peaks, which indicate rest-frame values in excess of 6000 rad m-2. The locations of the cores in 3C 318 and 3C 343 are not clear.
Conclusions. The available data on mas-scale rest-frame estimates for CSS sources show that these have a wide range of values extending up to 40000 rad m-2 in the central region of OQ172, and could be located at projected distances from the core of up to 1600 pc, as in 3C 43 where this feature has a rest-frame of 14000 rad m-2. estimates for cores in core-dominated radio sources indicate that in addition to responding to an overall density gradient of the magneto-ionic medium, geometry, orientation and modes of fuelling may also play a significant role. In addition to these effects, the high values of in CSS sources are possibly due to dense clouds of gas interacting with the radio jets. The observed distortions in the radio structures of many CSS sources are consistent with this interpretation.
Key Words.:
polarisation – galaxies: quasars: individual: 3C 119, 3C 318, and 3C 343 – galaxies: jets – radio continuum: galaxies1 Introduction
The number of Compact Steep-Spectrum (CSS) sources with detailed polarimetric information available at milliarcsecond resolution is still small. Polarised radio emission from CSS radio galaxies is either very weak or below the detection limits at centimetre wavelengths. In contrast, CSS quasars show linear polarisation percentages of up to 10% above 1 GHz (Rossetti et al. 2008, and references therein). We have conducted a series of observations of CSS sources having significantly polarised emission and high values of rotation measure (RM) using the Very Long Baseline Array (VLBA).
CSS objects are young radio sources, with ages yr. They have linear sizes kpc 111 and steep high-frequency radio spectra (; ). Being sub-galactic in size, CSS sources reside deep within their host galaxies. Therefore, Faraday rotation effects are to be expected when their polarised synchrotron emission is observed through the host galaxy magneto-ionic interstellar medium (ISM). The comparison of polarised emission over a range of wavelengths is an important diagnostic of the physical conditions within and around these compact radio sources (see Cotton et al. 2003c for an overview).
Existing sub-arcsec polarimetry has provided evidence in favour of the interaction of components of CSSs with dense clouds of gas, as seen for example in the CSS quasar 3C 147 (Junor et al. 1999).
Results for the first two CSS quasars observed in our on-going program, B$0548+165$ and B$1524-136$, are available in Mantovani et al. (2002), while those for 3C 43 (B) are to be found in Mantovani et al. (2003). More recently, the results for 3C 147 (B$0538+498$) have been presented by Rossetti et al. (2009). These sources have all been imaged with milliarcsecond resolution by means of full-Stokes VLBA observations.
In this paper, we report on multi-frequency VLBA, plus a single Very Large Array (VLA) antenna, polarisation observations at 5 and 8.4 GHz for 3C 119 (B$0429+415$), 3C 318 (B$1517+204$), and 3C 343 (B$1634+628$).
2 Observations and data reduction
Polarimetric observations of 3C 119, 3C 318, and 3C 343 using the VLBA and one VLA antenna were carried out at 5 and 8.4 GHz as detailed in Table 1. The data were recorded in both right- and left-circular polarisation in four 8-MHz bands. At 5 GHz these bands were spread across the available bandwidth of MHz, allowing us to obtain truly simultaneous, independent, polarisation images. Only two of the four sub-bands could make use of the VLA antenna in the array due to limitations in the available VLA 5 GHz system. In order to increase the sensitivity to polarised emission at 8.4 GHz, we chose to use contiguous IFs for this band.
| Sources | Obs. Date | Duration | Fringe Finder | Polarisation Calibrators | |
|---|---|---|---|---|---|
| 3C 119 | 05 Dec 2001 | 12 hr | DA 193 | 3C 84 3C 138, DA 193 | |
| 3C 318 | 29 Sept 2001 | 12 hr | OQ 208 | 3C 279, 3C 380 | |
| 3C 343 | 25 Oct 2001 | 12 hr | OQ 208 | 3C 345, 3C 380 | |
| IFs | MHz | Bandwidth | Array | ||
| IF1 | 4619 | 16 MHz | VLBA+VLA1 | ||
| IF2 | 4657 | 16 MHz | VLBA | ||
| IF3 | 4854 | 16 MHz | VLBA+VLA1 | ||
| IF4 | 5094 | 16 MHz | VLBA | ||
| IF1–4 | 8421 | 64 MHz | VLBA+VLA1 |
The data were correlated with the National Radio Astronomy Observatory (NRAO) VLBA processor at Socorro and calibrated, imaged and analysed using the AIPS package. The flux density and polarisation calibrations were done following the procedure described in Rossetti et al. (2009) for the source 3C 147 observed using the same system setup. The flux density calibration uncertainty is . The compact polarised sources DA 193, 3C 345, and 3C 380 were used to determine the instrumental polarisation (“D-term”) using the AIPS task PCAL. The solution showed that the instrumental polarisation was typically of order .
3 Results
3.1 3C 119
At different times, the optical identification for the radio source 3C 119 has been called both a galaxy and a quasar, as noted by Fanti et al. (1990) who classified it as a quasar. Its light is dominated by its nucleus, a morphology more typical of CSS quasars (de Vries et al. 1997). It has a reasonably broad H profile and we presently classify it as a possible quasar. It has and (Eracleous & Halpern 1994), so that 1 mas corresponds to 8.086 pc. A MERLIN polarimetric image of 3C 119 at 5 GHz was obtained by Lüdke et al. (1998) who studied a sample of CSS sources. At their resolution, it appears barely resolved. Lüdke et al. pointed out that it shows extremely rapid depolarisation between 8.4 and 5 GHz. This was recently confirmed by Mantovani et al. (2009) who detected polarised emission of 8.8 and 5.9 % at 10.45 and 8.35 GHz respectively, whereas at 4.85 GHz the polarisation was below the detection limit (110 mJy, corresponding to about 2.7%) of their Effelsberg 100-m telescope observations.
The first VLBI images of 3C 119 with resolutions mas were made by Fanti et al. (1986) at 18 and 6 cm. They found at least four components embedded in a complex, spiral, filamentary structure suggesting that the low brightness emission was distributed in filaments surrounding the brighter components. Global VLBI observations at 18 cm were also made by Nan et al. (1991a). These observations, combined with MERLIN data taken at the same time, confirmed the existence of the four components found by Fanti et al. (1986). These were labelled A, B, C, and D, by Nan et al. (1991a) and we adopt the same nomenclature here. A further three, extended components of low surface brightness, E, F and G, were also found by Nan et al. (1991a). Together, these components account for 90% of the total flux density of the source.
VLBI polarimetry of 3C 119 was first made by Nan et al. (1999) using the VLBA at three widely-separated frequencies in the 8.4 GHz band. The brightest jet component they found, component C, shows a smooth rotation measure gradient of 2300 rad m-2 mas-1 which suggests a collision between the VLBI jet and a dense interstellar cloud.
3C 119 is included in the MOJAVE (Monitoring Of Jets in Active galactic nuclei with VLBA Experiments; Lister et al. 2009) monitoring project at 15.4 GHz. Four images from 2002, 2006, 2008 and 2009 are available in their data archive. At this frequency, components A, B, and C are detected while the low brightness emission detected by Nan et al. (1991a), is completely resolved out.
Our total intensity image of 3C 119 at 4.8 GHz made using all four C-band IFs, and the image at 8.4 GHz, are presented in Fig. 1. The source exhibits a core-jet structure with four of the seven components, (A–D), being detected. The three brightest components are not aligned, but lie along a jet showing “wiggles”. Components B and C are surrounded by a “halo” of spots, reminiscent of the low brightness emission in which the jet itself is embedded.
Component A is almost point-like in the available VLBI images. Using flux density estimates for it made at almost the same epoch for frequencies from 1.6 to 15.4 GHz, we find a spectrum (see Fig. 2) typical of a Giga-Peaked Spectrum (GPS) source, with a peak flux density around 5 GHz. In Fig. 2, the flux density measurements at frequencies 4.5 GHz were taken over a narrow range of dates. The measurement at 1.6 GHz (Nan et al. 1991a) was adopted assuming negligible temporal variability at that frequency. Component A is not detected at 50 cm (Nan et al. 1991b), with an upper limit of 40 mJy, consistent with its inverted spectrum at low frequencies. We note that the flux density at 8.4 GHz for this component dropped from 117 to 70 mJy between December 1994 (Nan et al. 1999) and December 2001 (present work). Moreover, considering the observations made by MOJAVE at 15.4 GHz, the flux densities rose from 45 mJy in October 2002 to 116 mJy in March 2006, 149 mJy in May 2008, and 173 mJy in July 2009. Clearly, we are dealing here with a variable GPS source. Variability in a small fraction of GPS sources has been pointed out by Jauncey et al. (2003). Therefore, component A is almost certainly the core of 3C 119.


Mantovani et al. (2009) found total flux densities for 3C 119 of 4722 and 2677 mJy at 4.8 and 8.4 GHz respectively from their Effelsberg 100-m observations. The total flux density in our 4.8 GHz combined-IF image is 2838 mJy. At 8.4 GHz we obtain 1531 mJy. The peak flux density is located in component C, being 987 and 660 mJy at 4.8 and 8.4 GHz respectively.


| Comp. A | ||||||||
| IFs | Stot | Speak | rms() | Spol | rms() | EVPA | ||
| MHz | mJy | mJy/b | mJy/b | mJy | mJy/b | % | deg | |
| IF1 | 4619 | 93.7 | 93.2 | 0.7 | 0.6 | 0.11 | 0.6 | |
| IF2 | 4657 | 92.0 | 92.0 | 0.6 | 0.9 | 0.11 | 1 | 0 |
| IF3 | 4854 | 95.0 | 89.4 | 0.6 | 0.6 | 0.12 | 0.6 | |
| IF4 | 5094 | 90.5 | 90.5 | 0.6 | 0.7 | 0.13 | 0.7 | |
| IF1–4 | 8409 | 70.0 | 69.4 | 0.1 | 0.1 | |||
| Comp.B | ||||||||
| IF1 | 4619 | 251.3 | 216.3 | 0.7 | 1.7 | 0.11 | 0.7 | 73 |
| IF2 | 4657 | 267.2 | 207.1 | 0.6 | 1.4 | 0.11 | 0.5 | 62 |
| IF3 | 4854 | 272.0 | 211.2 | 0.6 | 1.8 | 0.12 | 0.7 | 59 |
| IF4 | 5094 | 273.8 | 199.2 | 0.6 | 1.6 | 0.13 | 0.6 | 44 |
| IF1–4 | 8409 | 155.6 | 134.2 | 0.1 | 0.8 | 0.09 | 0.5 | –77 |
| Comp.C | ||||||||
| IF1 | 4619 | 1831.4 | 1255.7 | 0.7 | 19.6 | 0.11 | 1.1 | 105 |
| IF2 | 4657 | 1827.6 | 1204.3 | 0.6 | 24.2 | 0.11 | 1.3 | 92 |
| IF3 | 4854 | 1819.7 | 1229.1 | 0.6 | 24.3 | 0.12 | 1.3 | 62 |
| IF4 | 5094 | 1800.8 | 1157.2 | 0.6 | 22.1 | 0.13 | 1.2 | 40 |
| IF1–4 | 8409 | 1121.4 | 806.2 | 0.1 | 161.1 | 0.09 | 14.4 | 61 |
3.1.1 Polarised emission from the inner jet of 3C 119
In order to compare the 5 and 8.4 GHz results, the images of 3C 119 have been convolved to a resolution of 3.0 2.0 mas2 at 0°. We detect polarised emission along the jet structure. However, components A and D show no, or at best marginal, polarised emission above our detection limits at both 4.8 or 8.4 GHz. At C-band we have imaged the jet for each of the four individual IFs.
Fig. 3 shows the total-intensity and polarisation structure of the jet at C-band for the four individual IFs, while Fig. 4 shows the jet structure at X-band. The parameters derived from these images are listed in Table 2. Flux densities were determined using the AIPS task IMEAN on the same region of the P and I images. In Table 2, the total and peak flux densities, S, the rms noises, the polarised integrated flux densities, Spol and its rms noise, the percentage polarisation, , and the electric vector position angle (EVPA), , are listed for the four C-band IFs and X-band. For the core component A, which appears unresolved, we have listed the values at the pixel of maximum total intensity.
Plots of against wavelength squared for components B and C are shown in Fig. 5. These were derived as follows. The median values and associated errors were computed for a box of five-by-five pixels around the peaks of polarised emission. At 15.4 GHz the EVPA for both components was derived from the image made available by the MOJAVE archive from observations taken in 2002. These values have an accuracy of better than 5° (Lister & Homan 2005).
Both components show high values for the rotation measure. We derive RM = 884 rad m-2 (3618 rad m-2 in the source rest frame) for component B, whereas component C yields RM = 1373 rad m-2 (5620 rad m-2 in the source rest frame). We note that the EVPAs reported by Nan et al. (1999) for component C at the three sub-bands of their VLBA X-band observations are well aligned with the linear fit in Fig. 5. They did not detect polarised emission in the region close to the peak of emission for component B, in contrast to our more sensitive observations. Polarised emission was detected by both sets of observations for the region immediately to the south-west of compact component B, where almost the same values were found for the EVPAs.


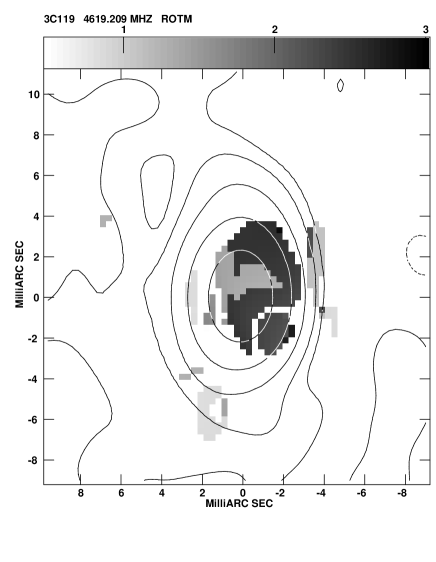

We have also plotted the distribution of RM around the emission peak in component C (Fig. 6). These plots were produced using the AIPS task RM which requires EVPAs for up to four frequencies to compute the RM values. In this case we have selected frequencies of 4619, 4854, 5094, and 8421 MHz for which we have images available. Fig. 6 shows that in a small area close to the peak of polarised emission there are values about 1400 rad m-2 (see Fig. 5). This area is surrounded by a region with much higher RMs lying in the range 2300 to 2500 rad m-2 (9400-10200 rad m-2 in the source rest frame). This region coincides with a change in the direction of the inner jet of 3C 119. The value of RM reported for the integrated emission of 3C 119 by Mantovani et al. (2009) is 1928 rad m-2. Clearly, C is the dominant component, strongly influencing the polarimetric parameters of the source.
Fig. 6 (left) shows in grey-scale the RM distribution for 3C 119 derived from the four frequencies (4619, 4854, 5094, and 8421 MHz) overlaid on the total-intensity contour image, while the panel on the right shows the RM contours. No redshift corrections have been applied, so the RMs in the rest frame of the source will be higher by a factor of .
3.2 3C 318
3C 318 is a radio galaxy at a red-shift of 1.574 (1 mas = 8.554 pc). Single-dish observations of the object were recently made by Mantovani et al. (2009) who measured flux densities of 764 mJy at 4.8 GHz and 417 mJy at 8.4 GHz. The source is 3.4% and 6.6% polarised at 4.8 and 8.4 GHz respectively. At lower frequencies the polarisation drops below the detection limit of these Effelsberg observations. The RM derived by Mantovani et al. is 498 rad m-2. Using the measurements of Tabara & Inoue (1980) yields an RM of 342 rad m-2. A similar value for the brightest component (420 rad m-2) is reported by Taylor et al. (1992) from VLA observations with angular resolution of 0.4. Taylor et al. found a polarisation percentage of 10% at 8.4 GHz.
A higher resolution L-band image of 3C 318 was made by Spencer et al. (1991) using combined MERLIN and EVN observations at a resolution of 3533 mas2. The component B detected by Akujor et al. (1991) with MERLIN at 5 GHz was resolved out, while the two northern components show considerable structure and bright peaks. The total flux density detected by Akujor et al. (1991) was 543 mJy. Akujor & Garrington (1995) made polarimetric observations of 3C 318 at 8.4 GHz with the VLA, and detected polarised emission (10%) mainly from the two northern components. VLA observations were also made by van Breugel et al. (1992) at 15 and 22 GHz. They found the northern region, in which the two component are merged, to be 17% polarised. Further polarimetric observations were made by Lüdke et al. (1998) with MERLIN who found the brightest component to be 3.6% polarised at 5 GHz. In this image, 3C 318 shows a core-jet structure on one side and a lobe on the other. It is suggested that component K2 (Spencer et al. 1991) might be the core, although it appears resolved and does not have a flat spectrum.
3C 318 appears to be heavily resolved by our 4.8 GHz VLBA observations. Fringes were not detected at 8.4 GHz. Our 5 GHz image was made using the full bandwidth and, in order to compare with previous VLBI observations, with a convolution beam of 3533 mas2 in PA 46∘ (Spencer et al. 1991). 3C 318 appears elongated in roughly the North-South direction, with the southern side showing a “wiggling” structure (Fig. 7). We follow the nomenclature of Spencer et al. (1991) who found four components named K1, K2, K3, and A. About 61% of the flux density found by Lüdke et al. (1998) is recovered here. The source parameters derived from our image are summarised in Table 3, the flux density values having been obtained using the AIPS task TVSTAT.

In our image, we find two other extended components, which we designate K4 and K5. These were not detected by the less sensitive observations of Spencer et al. (1991).
| Comp. | Stot | Speak | Spol | EVPA | |
|---|---|---|---|---|---|
| mJy | mJy | mJy | % | deg | |
| K1 | 35.2 | 16.4 | 0.8 | 2.2 | 725 |
| K2 | 228.4 | 122.2 | 8.0 | 3.5 | 695 |
| K3 | 47.9 | 9.8 | |||
| K3 | 47.9 | 9.8 | |||
| K4 | 15.0 | 5.9 | |||
| K5 | 34.7 | 9.9 | |||
| A | 107.5 | 16.8 |
The brightest component, K2, is responsible for almost all of the polarised emission from 3C 318, and the magnetic field orientation appears almost constant over the region. A similar behaviour, but with different position angles, is presented by all available polarimetric images. Thus, we can derive the values of the rotation measure from these interferometric observations made at different frequencies. Values of the EVPA are taken from Lüdke et al. (1998) at 4996 MHz, Akujor & Garrington (1995) at 8414 MHz, Taylor et al. (1992) at 8515 MHz, and van Breugel et al. (1992) at 15 GHz, as well as from the present work, and are plotted in Fig. 8. EVPA accuracies for these observations were not given, and values of have been assumed for both MERLIN and VLA EVPA determinations. The RM computed is 457 rad m-2, not far from the values of 420 rad m-2 derived by Taylor et al. (1992), and 498 rad m-2 derived by Mantovani et al. (2009). Again we are dealing with a CSS showing a very high RM of 3030 rad m-2 in the source rest frame at sub-arcsecond resolution.

3.3 3C 343
3C 343 is associated with a quasar at =0.988 (1 mas = 8.017 pc). From their single dish observations, Mantovani et al. (2009) reported the detection of polarised flux density for this source only at 10.45 GHz at a level of 1.4%. A low level of polarised emission (0.8%) was also reported by Lüdke et al. (1998) from their MERLIN observations at 5 GHz in which the source appears barely resolved with a total flux density of 1434 mJy. Polarised emission is detected only in its eastern extension. Previous VLBI observations were made by Fanti et al. (1985) and Nan et al. (1991b) at 1.6 GHz and 608 MHz respectively. The mas structure of the source is quite peculiar, resembling a ‘fried egg’.
Our total-intensity VLBA images of 3C 343 for the different C-band IFs are shown in Fig. 9, while the VLBA image at 8.4 GHz is shown in Fig. 10. The wide-band 5 GHz VLBA system allowed us to use four 8 MHz IF channels well separated in frequency. Only C-band IFs 1 and 3 contain data from the VLA antenna which was included in the observing array. Two bright, compact components, A and B, are surrounded by weak, diffuse emission. The two images made from data including the VLA antenna show the diffuse emission, while the two images lacking baselines to the VLA antenna show the two prominent components, A and B, and the ridge of emission which resembles a curved radio jet. Both A and B have steep spectral indices between 4.8 and 8.4 GHz. The flux densities for these components have been obtained with the AIPS task JMFIT, and component A (the eastern one) has 1.6 (1.3 using the peak flux densities), while component B has 1.2 (0.8 using the peak flux densities). Polarised emission is found from both of these components and along the emission region between them. This all suggests it to be unlikely that either A or B is the core of 3C 343.
From the 8.4 GHz image, we note that a new compact component is clearly visible directly to the east of component A. This feature, which we label C in Fig.10, is well separated from the brighter component A. Using the AIPS task JMFIT, we obtain total and peak flux densities of 7.7 and 3.5 mJy respectively for Component C. It is not seen on any of the C-band images of the same resolution, including that made by combining all four IFs, which means a 3 upper limit peak flux density of 1 mJy. This indicates an inverted spectrum for C between 4.8 and 8 GHz, making it a candidate for being the core of 3C 343. Moreover, component C is situated nicely on the curved track of the jet as seen in Figs. 9 b and d.
The parameters for components A and B are summarised in Table 4. The component peak and total flux densities, along with their deconvolved angular dimensions, have been obtained using the AIPS task JMFIT. The degree of polarisation has been estimated close to the peaks of emission in A and B. However, there appears to be large changes in the EVPAs close to the peaks of emission. Therefore, we have not quoted a single value in Table 4 but refer the reader to the distributions of EVPAs in Fig. 9.
| Comp. A | |||||||||||
| IFs | Stot | Speak | rms() | Spol | rms() | maj.ax | min.ax. | PA | EVPA | ||
| MHz | mJy | mJy/b | mJy/b | mJy | mJy/b | mas | mas | deg | % | deg | |
| IF1 | 4619 | 102.1 | 30.3 | 0.4 | 3.7 | 0.2 | 16.8 | 8.4 | 108 | 3.6 | see Fig. 9 |
| IF2 | 4657 | 80.0 | 33.3 | 0.6 | 2.6 | 0.2 | 12.5 | 6.5 | 112 | 3.2 | see Fig. 9 |
| IF3 | 4854 | 80.3 | 33.5 | 0.3 | 4.8 | 0.2 | 11.9 | 7.1 | 113 | 6.0 | see Fig. 9 |
| IF4 | 5094 | 54.7 | 36.0 | 0.4 | 2.6 | 0.2 | 6.5 | 5.0 | 131 | 4.7 | see Fig. 9 |
| IF1–4 | 8409 | 33.0 | 16.3 | 0.2 | 1.6 | 0.1 | 8.7 | 7.5 | 105 | 4.8 | |
| Comp.B | |||||||||||
| IF1 | 4619 | 470.5 | 77.2 | 0.4 | 2.7 | 0.2 | 19.4 | 16.7 | 117 | 0.6 | see Fig. 9 |
| IF2 | 4657 | 305.2 | 69.3 | 0.6 | 3.6 | 0.2 | 16.6 | 13.1 | 128 | 1.2 | see Fig. 9 |
| IF3 | 4854 | 391.9 | 80.6 | 0.3 | 4.3 | 0.2 | 16.8 | 14.7 | 149 | 1.1 | see Fig. 9 |
| IF4 | 5094 | 208.8 | 68.5 | 0.4 | 3.2 | 0.2 | 12.5 | 10.4 | 131 | 1.5 | see Fig. 9 |
| IF1–4 | 8409 | 198.7 | 51.4 | 0.2 | 5.9 | 0.1 | 15.8 | 11.8 | 5 | 3.0 | –46 |
The total flux density detected in a combined C-band image is 1274 mJy, about 89% of the flux density detected by MERLIN (Lüdke et al. 1998) and 85% of the flux density detected with the Effelsberg 100-m telescope by Mantovani et al. (2009). The polarisation percentage is estimated to be 0.96%, close to the value of 0.8% measured with MERLIN (Lüdke et al. 1998).


The total flux density detected in the VLBA image at 8.4 GHz (Fig. 10) is 553 mJy, 69% of the flux density detected by Mantovani et al. (2009). The polarised emission detected is of 7.2 mJy, corresponding to 1.3%. The percentage polarisation drops by a factor of 0.73 between 8.4 and 4.8 GHz.

| Name | Alt. Name | z | Id. | m | DP | Notes | Ref. | |
|---|---|---|---|---|---|---|---|---|
| (%) | (rad m-2) | |||||||
| 3C 43 | B0127+233 | 1.459 | Q | 0.4 | 14236 | E, 1600 pc from core | 1 | |
| 3C 119a | B0429+415 | 1.023 | Q? | 14.4 | 0.085.0/8.4 | 10200 | C, 325 pc from core | 2 |
| 3C 138 | B0518+165 | 0.759 | Q | 3.6 | 5287 | B1, 40 pc from core | 3 | |
| 3C 147 | B0538+498 | 0.545 | Q | 6.6 | 4872 | BN, 37 pc from core A0 | 4 | |
| 4C 16.14b | B0548+165 | 0.474 | Q | 6.2 | 0.264.6/8.4 | 4275 | 5C, 540 pc from core | 5 |
| 3C 216 | B0906+430 | 0.670 | Q | 30.0 | 0.974.8/8.4 | 2200 | Arc, 1050 pc from core | 6 |
| 3C 286c | B1328+307 | 0.849 | Q | 11.0 | Core unclear | 7,12 | ||
| 3C 287d | B1328+254 | 1.055 | Q | 4.6 | 0 | Based on only 8.15 and 8.54 GHz | 8 | |
| OQ 172e | B1442+101 | 3.529 | Q | 2.7 | 40000 | Within 20 pc from core | 9,11 | |
| 3C 309.1 | B1458+718 | 0.905 | Q | 1.5 | 0.108.4/15 | 1633 | Core RM between 8.4 and 15 GHz | 10 |
| 3C 318 | B1517+204 | 1.574 | NG | 3.5 | 3030 | K2, Core unclear | 2 | |
| OR140f | B1524136 | 1.687 | Q | 30.2 | 14.6-5.1/8.4 | 10000 | C, 810 pc from core F | 5 |
| 3C 343g | B1634+628 | 0.988 | Q | 4.8 | 0.914.6-5.1/8.4 | 6000 | core unclear | 2 |
| 3C 454 | B2249+185 | 1.757 | Q | 10.9 | 5334 | B, 300 pc from possible core | 1 |
We detect polarised emission at all five observing frequencies. However, due to the low level of polarisation, and to the lower sensitivity of the observations without the VLA antenna, mapping the RM distribution of 3C 343 is more difficult. It is clear from Fig. 9 that there could be changes by up to 90∘ in the orientation of the EVPAs close to the peaks of emission in components A and B. Also, significant polarisation is not always detected from the same physical region of a component, possibly due to a combination of both varying sensitivity in the different IFs and varying RM across the source. These aspects have made it difficult to construct a reliable RM map. However, changes in the EVPAs between two neighbouring IFs, say IF2 and IF3, by more than 30∘ in some regions indicate RM values larger than 1500 rad m-2 in the observer’s frame. While more sensitive observations are required to make a reliable RM map, a preliminary one using the present data seems to indicate similarly high values of RM.
4 Discussion
4.1 Comments on the three sources
The three CSSs we present here have mutually very different structures when imaged with mas resolution. 3C 119, which is associated with a possible quasar, has a complex shape when observed at low resolution, but has strong core-jet structure on resolutions of a few mas. We suggest that Component A, which shows a convex spectrum, flux density variability, and either no, or at best marginal, polarisation above the detection limits, is the core. The jet exhibits “wiggles”. From published images at sub-mas resolution, 3C 119 appears to maintain its collimation while presenting an overall spiral-like shape. Two bright, polarised blobs are seen along the jet. The brighter of these has a high rotation measure and strong depolarisation between 8.4 and 5 GHz, which we interpret as an indication of strong interaction between the jet and a cloud in the ISM, possibly a dense narrow-line region (NLR) cloud. Although this interaction does not disrupt the jet, the jet does seem to change direction. The jet could also be bent close to our line of sight and exhibit apparent superluminal speed. We do not detect a counter-jet. The apparent speed of the two bright blobs (components B and C) along the approaching jet is likely to be measured by the MOJAVE monitoring project, and this could possibly put constraints on the orientation of the ejection axis.
3C 318 has an elongated jet, with “wiggles” along its southern part. It is associated with a galaxy. Although the cores in quasars are often at the end of the jet, this need not be the case for a galaxy. From the present observations we are unable to identify the exact core. Component K2, suggested by Spencer et al. (1991) to be the core, has a steep spectrum () and shows a percentage polarisation of 3.4% at 4.8 GHz. It also has a high rotation measure, often seen in jets in CSS sources. This component is unlikely to be the radio core.
Among the three sources observed, 3C 343, which is associated with a quasar, presents the most unusual structure. The two brightest polarised components are embedded in a diffuse region of weak emission. It is unlikely that either is the core of the source. We suggest the component clearly visible to the east of component A in the X-band image, instead, as the possible core candidate. The C-band images without the VLA antenna do not detect the extended diffuse emission but show the two prominent components, A and B, and a ridge of emission which resembles a strongly curved jet.
The structures of all three CSS sources discussed in this paper show large deviations from a collinear structure indicating interactions of the jets with clouds in the interstellar medium of the host galaxy. Although two of the sources, 3C 119 and 3C 343, are associated with quasars, their cores are either weak or undetected, suggesting that projection effects due to a small angle of inclination may not be important. However, jets may be bent towards the line of sight after collisions with clouds. Systematic monitoring of the knots or peaks of emission may help to clarify whether this is indeed the case. The detection of high RMs towards the components in the radio jet/structure in both 3C 119 and 3C 343, as well as in 3C 318, supports the possibility of interaction of the jets with dense clouds. For an electron density of 103 cm-3, which is a reasonable estimate for the NLR clouds (e.g. Osterbrock 1989; Peterson 1997), and cloud sizes of 20 to 100 pc, the highest value of RM for 3C 119 yields magnetic field strengths in the range of 0.1 to 0.6 G. The lower value of the cloud size has been taken to roughly correspond to the size of the radio components. The corresponding values of field strength for 3C 318 and 3C 343 are in the range of 0.040.2 and 0.070.4 G respectively. These values are similar to those of, for example, Zavala & Taylor (2002). For a less dense medium with a thermal electron density of 1 cm-3 and a screen thickness of 1 kpc, as adopted by Mantovani et al. (2002), the magnetic field strenghts are in the range of 3.7 to 12.6 G. These are similar to those estimated by Mantovani et al. (2002) for the CSS quasars B0548+165 and B1524136, which also have high values of RM and bends in their radio structures.
4.2 A Discussion of CSS quasars
To date, few CSSs have been imaged with polarimetric VLBI observations. Most of those that have are quasars. At present, 12 out of 24 quasars in the list of CSSs from the 3C and PW catalogues (Fanti et al. 1990) have published polarimetric VLBI data. Almost all of these show core-jet structures. Polarised emission is detected along the jets. Cores are usually weak and polarisation is not detected, in contrast to flat spectrum quasars. CSSs for which mas-scale values of RM have been derived are even rarer. Table 5 summarises parameters derived from existing observations. Except for the cases of 3C 287, whose low RM has been estimated from only two nearby frequencies, and 3C 286, which possibly has a low RM given its low integrated value but whose RM has not been determined with mas resolution, the remaining 12 sources have absolute rest-frame values of RM ranging from 1600 to 4104 rad m-2. In the case of OQ172, which also exhibits the highest RM, the region of high RM is close to the core with the highest values occurring within 20 pc of the peak of emission in the core. This is also the case for the quasar 3C 309.1, which has a prominent radio core, with the region of highest RM being situated in the vicinity of the radio core. For the remaining sources, the component of highest RM is distinct from the core, wherever a radio core could be identified. The distance from the core to the component with the highest RM varies from 37 to 1600 pc, with a median separation of 400 pc. The regions of high RM are clearly in the NLR of the host galaxy.
The fractional polarisation usually tends to decrease with decreasing frequency. For the sources listed in Table 5, the components with the highest RM in 3C 119 and 3C 309.1 are strongly depolarised with DP values of 0.1 or less (beetween 5.0 and 8.4 GHz and 8.4 and 15 GHz respectively), while those in 3C 216 and OR140 (B1524136) exhibit hardly any depolarisation. While a high RM without depolarisation could be due to an external screen, a high RM along with depolarisation could be caused by unresolved structures in the screen and/or thermal plasma mixed with the radio-emitting material. Several examples of high RM with little or no significant depolarisation suggests that the RM is due to a foreground Faraday screen, with the NLR contributing to the observed RM. In all cases examined, a law is closely followed over the observed frequency range. The jets are often distorted and this is interpreted in terms of jet-cloud interactions, although projection effects can also affect the observed structure if the jet is bent close to the line of sight. In many core-jet CSS quasars, high integrated Faraday rotation occurs where bends in the jet are found, suggesting that jet-cloud interactions play a significant role in the observed high RMs of these components. For example, amongst the 10 sources in Table 5 where a core or possible core has been identified, the highest values of RM occur at distances from the core ranging from 20 pc for OQ 172 to 1600 pc for 3C 43, excluding 3C 309.1 where the highest value is for the core. The median value of the separation of the region of highest RM from the core is 300 pc. The axes of radio emission in these sources bend significantly after the region of highest RM. The PA of the latter differs from the axis defined by the core and the region of highest RM by 20 to 90∘, the more extreme cases being 3C 43, 3C 119, 4C 16.14 and 3C 216. In the case of OQ 172, the region of highest RM is within 20 pc of the nucleus, and the jet shows a large deviation very close to the nucleus.
4.3 Comparison with pc-scale RMs in other AGNs
With the exception of a few radio galaxies having either strong cores or jets, such as 3C 111, 3C 120 and M87, most of the pc-scale RM estimates for other AGNs have been made for either core-dominated quasars or BL Lac objects. Early measurements with subarcsec resolution using the VLA indicated low core RMs at long wavelengths, with the RMs increasing at shorter wavelengths as one probes deeper into the radio core (e.g. Saikia et al. 1998, and references therein). Subsequent mas-resolution observations with the VLBA have revealed a wealth of information on core RMs (e.g. Zavala & Taylor 2002, 2003, 2004, and references therein; O’Sullivan & Gabuzda 2009, and references therein). A systematic study of the mas-scale RM properties of 40 quasars, radio galaxies and BL Lac objects by Zavala & Taylor (2003, 2004) has shown that the rest-frame core RM for quasars ranges up to 104 rad m-2 with a median value of 1860 rad m-2 within 10 pc of the core. For BL Lac objects, their core RM values are usually within 1000 rad m-2 with a median value of 440 rad m-2. The RMs of pc-scale jets decreases rapidly, the median values of the rest-frame RM for the jets being 460 and 260 rad m-2 for quasars and BL Lacs respectively (Zavala & Taylor 2004). The few radio galaxies that have been studied exhibit evidence of moderate to high values of RM. For example, the core of 3C 111 is not significantly polarised, while the jet exhibits an RM of 750 rad m-2 3 mas (2.8 pc) east of the core, decreasing further to 200 rad m-2 5 mas (4.7 pc) east of the core. For 3C 120, while Zavala & Taylor (2002, 2003) estimate a core RM of 2080 rad m-2, decreasing to 100 rad m-2 about 1 pc from the core, Gómez et al. (2008) find a localised region of high RM 3 to 4 mas (22.6 pc) from the core with a peak RM of 6000 rad m-2. The RM values for M87 could be determined from 18 to 27 mas (1.5 to 2 pc) west of the core, and the values varied from 5000 to 104 rad m-2 (Zavala & Taylor 2002, 2003). It should be noted that M87 is in a cooling core cluster and RM values as high as 8000 rad m-2 have been seen towards the 2-kpc radio lobes (Owen, Eilek & Keel 1990).
In comparison, the median value of RM for the CSS sources listed in Table 5 is 5000 rad m-2, and values larger than 10000 rad m-2 are seen to occur at distances from the core ranging from 300 to 1600 pc. This is quite unlike the regions of RM discussed earlier, almost all of which are very close to the radio core. This suggests that in the case of CSS objects, the jets are often interacting with dense clouds of gas in the circumnuclear region of the host galaxy.
4.4 Environmental vs orientation effects
For quite some time it has been apparent that the degree of core polarisation correlates with AGN classification. From sub-arcsec scale measurements with the VLA it was pointed out quite early on that quasar cores tend to be more polarised than galaxy cores (Saikia, Swarup & Kodali 1985; Saikia, Singal & Cornwell 1987). Milliarcsec-scale polarisation measurements also showed a similar trend, with the cores in BL Lac objects being slightly more polarised than the quasar cores (Cawthorne et al. 1993). Gabuzda et al. (1992) also presented results which showed that the cores of BL Lacs are more polarised than quasars, which was also seen in a larger sample of AGNs by Pollack et al. (2003). From arcsec-scale polarisation data, Saikia (1999) showed that BL Lac objects and core-dominated quasars had higher levels of core polarisation than lobe-dominated quasars and radio galaxies, and suggested that this might be due to an orientation effect. Here, the low polarisation of the cores of radio galaxies, and perhaps the lobe-dominated quasars as well, were attributed to depolarisation by the obscuring torus. However, the observed degree of polarisation could also reflect the contribution of a small-scale jet, which could be more strongly polarised and contribute more significantly at smaller angles to the line of sight.
Taylor (2000) suggested that the RM values for BL Lac objects could be smaller than those of quasars, because their jets are believed to be inclined at smaller angles to the line of sight. This could arise if the relativistic jets cleared out the magneto-ionic material responsible for the Faraday rotation. Similar ideas were suggested by Saikia et al. (1998) to explain the low RM values for quasar cores determined from long-wavelength polarimetric observations with arcsec resolution. Although individual RM values in BL Lac objects are known to exceed thousands of rad m-2, the median value of rest-frame RM for quasars is larger than that for the BL Lac objects by a factor of 4, consistent with the expectation of Taylor (2000). It appears that for quasars the long-wavelength measurements probe the outer regions of the nuclear jets on scales of tens of pc yielding low RM values as these are seen through regions which have been at least partially cleared of the magneto-ionic medium by the relativistic jets. Shorter wavelength observations with mas resolution probe deeper into the base of the jet, and yield high RMs indicating denser gas and/or higher magnetic fields than on the larger scales. It is relevant to note that O’Sullivan & Gabuzda (2009) find the core RM to systematically increase with frequency, this being well described by a power-law, providing information on the power-law fall off of electron density and/or magnetic field with distance from the nucleus. In the scheme where orientation effects play a role, the cores of radio galaxies and any emission in their immediate vicinity would be expected to have high values of RM due to the effects of the obscuring torus.
An interesting aspect of our understanding of extragalactic radio sources is that there are significant differences in the host galaxy and emission line properties of Fanaroff-Riley class I and II sources (Fanaroff & Riley 1974) which may be related to the fuelling mechanism. While a significant fraction of high-luminosity radio sources show peculiar optical morphologies and high-excitation emission lines, reminiscent of gas-rich galaxy mergers, the low-luminosity radio sources do not share the same optical properties and have weak, low-excitation emission lines (Heckman et al. 1986; Baum, Heckman & van Breugel 1992; Baum, Zirbel & O’Dea 1995). Hubble Space Telescope observations show that the low-power radio sources lack evidence of an obscuring torus and significant emission from a classical accretion disc (Chiaberge, Capetti & Celotti 1999), and may be fuelled by quasi-spherical Bondi accretion of circum-galactic gas rather than gas-rich galaxy mergers (Hardcastle, Evans & Croston 2007). The finding by Baldi & Capetti (2008) that high-excitation radio galaxies almost always show evidence of star formation, unlike their low-luminosity counterparts, is consistent with this trend. In our case, BL Lac objects are usually hosted by galaxies with low-excitation emission lines, while quasars are hosted in galaxies with high-excitation emission lines. This difference is also likely to affect the observed RMs of BL Lac objects and quasars, with the former expected to have smaller values.
For CSS sources, although orientation is also expected to play a role (e.g. Saikia et al. 1995), the cores are either weak or not clearly identified making it impossible to either determine their RMs or put good limits on their degrees of polarisation. Amongst the sources listed in Table 5, the cores are strong enough for their RMs to be estimated in 3C 309.1 and OQ172, the values being 1600 and 40000 rad m-2 respectively. While 3C 309.1 exhibits a large misalignment between the mas-scale and arcsec-scale structures, the jet in OQ 172 bends sharply west of the nucleus and the RM of the jet falls to less than 100 rad m-2 only 10 mas (74 pc) from the nucleus (Udomprasert et al. 1997). Although the high values of RM may be partly due to probing close to the nuclear region, the large bends in these sources suggests that collisions with dense clouds of gas are also a significant factor. For the remaining CSS objects, where the regions of large RM occur at distances well separated from the nucleus, these large values are likely to be due to interactions of the jets with dense clouds of gas, some of which may also be fuelling the AGN activity.
5 Summary and conclusions
We have presented multi-frequency VLBA polarisation observations of three CSS sources, namely 3C 119, 3C 318 and 3C 343 to estimate their RM values. The radio source 3C 119 is associated with a possible quasar, and its in the source rest frame has been found to be as high as 10200 rad m-2 in a region which coincides with a change in direction of the inner jet. This component is located at a projected distance of 325 pc from the core, which is almost point-like, variable, has a peaked radio spectrum and is at best marginally polarised. 3C 318 is associated with a radio galaxy and its rest frame RM has been found to reach a maximum of 3030 rad m-2 for the brightest component which contributes almost all of the polarised emission. These observations are more sensitive than those of Spencer et al. (1991) and have detected two more extended components, which trace “wiggles” in the jet towards the southern side of the source. Of the three, the CSS source 3C 343 has perhaps the most complex structure. It contains two peaks of emission and a curved jet embedded in more diffuse emission. It exhibits complex field directions near the peaks of emission, which indicate rest frame values in excess of 4000 rad m-2. The varying sensitivity for the different frequencies and the complex field patterns near the peaks of emission make it difficult to construct a reliable RM image for this source.
We have compiled the available data on mas-scale estimates for CSS sources. These show a wide range of values with indications of a low RM for 3C 287 which needs to be confirmed from observations with a larger number of frequencies, to values as high as 40000 rad m-2 in the central region of OQ172 (Udomprasert et al. 1997). The components with high RM can also occur at considerable distances from the core, e.g. in 3C 43 where the component with an RM of 14000 rad m-2 is located at a projected distance of 1600 pc (Cotton et al. 2003a). RM estimates for flat-spectrum cores in largely core-dominated radio sources appear to increase with frequency (see O’Sullivan & Gabuzda 2009), suggesting that as one probes deeper into the core or unresolved base of the jet, one samples regions of higher density and/or magnetic field in the magneto-ionic medium. On larger scales, the jet RMs tend to be low as these objects are observed along a line of sight where the magneto-ionic medium may have been swept out by the relativistic jets (e.g. Saikia et al. 1998; Taylor 2000; Zavala & Taylor 2004). The CSS objects for which RM values have been estimated are almost entirely quasars. While the effects of an overall density gradient in the magneto-ionic medium, along with effects of geometry, orientation and modes of fuelling of the AGN , are likely to play a significant role, the high values in many of these CSS sources appear to be due to dense clouds of gas interacting with the radio jets. Usually, they also exhibit large structural bends and distortions, consistent with the possibility of jet-cloud interactions in the interstellar medium of the host galaxy. Some of these gas clouds may also be responsible for fuelling the AGN activity.
Acknowledgements.
We thank an anonymous referee for his/her very helpful comments and suggestions, and for a careful reading of the manuscript of this paper. The VLBA is operated by the U.S. National Radio Astronomy Observatory which is a facility of the National Science Foundation operated under a cooperative agreement by Associated Universities, Inc. This research has made use of data from the MOJAVE database that is maintained by the MOJAVE team (Lister et al., 2009, AJ, 137, 3718). This research has made use of the NASA/IPAC Extragalactic Database (NED) which is operated by the Jet Propulsion Laboratory, California Institute of Technology, under contract with the National Aeronautics and Space Administration. FM likes to thank Prof. Anton Zensus, Director, for the kind hospitality at the Max-Planck-Institut für Radioastronomie, Bonn, for a period during which part of this work has been done.References
- Aaron et al. (1997) Aaron, S., Roberts, D.H., & Wardle J.F.C. 1997, Vistas in Astr., 41, 225
- Akujor et al. (1991) Akujor, C.E., Spencer, R.E., Zhang, F.J., et al. 1991, MNRAS, 250, 215
- Akujor & Garrington (1995) Akujor, C.E., & Garrington, S.T. 1995, A&AS, 112, 235
- Baldi & Capetti (2008) Baldi, R.D., Capetti, A., 2008, A&A, 489, 989
- Baum et al. (1992) Baum, S.A., Heckman, T.M., & van Breugel, W. 1992, ApJ, 389, 208
- Baum et al. (1995) Baum, S.A., Zirbel, E.L., & O’Dea, C.P. 1995, ApJ, 451, 88
- Cawthorne et al. (1993) Cawthorne, T.V., Wardle, J.F.C., Roberts, D.H., & Gabuzda, D.C. 1993, ApJ 416, 519
- Chiaberge et al. (1999) Chiaberge, M., Capetti, A., & Celotti, A. 1999, A&A, 349, 77
- Cotton et al. (1997) Cotton, W.D., Fanti, C., Fanti, R., Dallacasa, D., et al. 1997, A&A, 325, 479
- Cotton et al. (2003a) Cotton, W.D., Spencer, R., Saikia, D.J., & Garrington, S. 2003a, A&A, 403, 537
- Cotton et al. (2003b) Cotton, W.D., Dallacasa, D., Fanti, C., et al. 2003b, A&A, 406, 43
- Cotton et al. (2003c) Cotton, W.D., Dallacasa, D., Fanti, C., et al. 2003c, PASA, 20, 12
- Dallacasa et al. (1998) Dallacasa, D., Schilizzi, R.T., & Nan Rendong 1998, IAU Colloquium 164, ASP Conference Series, 144, 117, Zensus, A.J., Taylor, G.B. & Wrobel, J.M. (eds.)
- de Vries et al. (1997) de Vries, W.H., O’Dea, C.P., Baum, S.A., et al. 1997, ApJS, 110, 191
- Eracleous & Halpern (1994) Eracleous, M., & Halpern, J.P. 1994, ApJS, 90,1
- Fanaroff & Riley (1974) Fanaroff, B.L., & Riley, J.M. 1974, MNRAS, 167, 31P
- Fanti et al. (1985) Fanti, C., Fanti, R., Parma, P., et al. 1985, A&A, 143, 292
- Fanti et al. (1986) Fanti, C., Fanti, R., Schilizzi, R.T., et al. 1986 A&A 170, 10
- Fanti et al. (1990) Fanti, R., Fanti, C., Schilizzi, R.T., Spencer, R.E., et al. 1990, A&A, 231, 333
- Gabuzda et al. (1992) Gabuzda, D.C., Cawthorne, T.V., Roberts, D.H., & Wardle, J.F.C. 1992, ApJ, 388, 40
- Gomez et al. (2008) Gómez, J.L., Marscher, A.P., Jorstad, S.G., Agudo, I., & Roca-Sogorb, M. 2008, ApJ, 681, L69
- Hardcastle et al. (2007) Hardcastle, M.J., Evans, D.A., & Croston, J.H. 2007, MNRAS, 376, 1849
- Heckman et al. (1986) Heckman, T.M., Smith, E.P., Baum, S.A., et al. ApJ, 311, 526
- Jauncey et al. (2003) Jauncey, D.L., King, E.A., Bignall, H.E., et al. 2003, PASA, 20, 151
- Jiang et al. (1996) Jiang, D.R., Dallacasa, D., Schilizzi, R.T., Lüdke, E., et al. 1996, A&A, 312, 380
- Junor et al. (1999) Junor, W., Salter, C.J., Saikia, D.J., Mantovani, F., & Peck, A.B. 1999, MNRAS, 308, 955
- Lister & Homan (2005) Lister, M.L., & Homan, D.C. 2005, AJ 130, 1389
- Lister et al. (2009) Lister, M.L., Aller, H. D., Aller, M. F. et al. 2009, AJ, 137, 3718
- Lüdke et al. (1998) Lüdke, E., Garrington, S.T., Spencer, R.E., et al. 1998, MNRAS, 299, 467
- Mantovani et al. (2002) Mantovani, F., Junor, W., Ricci, R., Saikia, D.J., Salter, C., & Bondi, M. 2002, A&A, 389, 58
- Mantovani et al. (2003) Mantovani, F., Junor, W., Saikia, D.J., & Salter, C. 2003, PASA, 20, 123
- Mantovani et al. (2009) Mantovani, F., Mack, K.-H., Montenegro-Montes, F.M. et al. , 2009, A&A, 502, 61
- Nan et al. (1991a) Nan, R.-D., Schilizzi, R.T., van Breugel, W.J.M., et al. 1991a, A&A, 245, 449
- Nan et al. (1991b) Nan, R.D., Schilizzi, R.T., Fanti, C. & Fanti, R. 1991b, A&A, 252, 513
- Nan et al. (1999) Nan, R.D., Gabuzda, D.C., Kameno, S., et al. 1999, A&A, 344 , 402
- Osterbrock (1989) Osterbrock, D.E. 1989, Astrophysics of Gaseous Nebulae and Active Galactic Nuclei, University Science Books, Mill Valley.
- O’Sullivan & Gabuzda (2009) O’Sullivan, S.P., & Gabuzda, D.C. 2009, MNRAS, 400, 26
- Owen et al. (1990) Owen, F.N., Eilek, J.A., Keel, W.C. 1990, ApJ, 362, 449
- Perley (1982) Perley, R.A. 1982, AJ, 87, 859
- Peterson (1997) Peterson, B.M. 1997, An introduction to Active Galactic Nuclei, Cambridge University Press, Cambridge
- Pollack, Taylor & Zavala (2003) Pollack, L.K., Taylor, G.B., & Zavala, R.T. 2003, ApJ 589, 733
- Rossetti et al. (2008) Rossetti, A., Dallacasa, D., Fanti, C., et al. 2008, A&A, 487, 865
- Rossetti et al. (2009) Rossetti, A., Mantovani, F., Dallacasa, D., et al. 2009, A&A, 504, 741
- Saikia (1999) Saikia, D.J. 1999, MNRAS, 302, L60
- Saikia, Swarup & Kodali (1985) Saikia, D.J., Swarup, G., & Kodali, P.D. 1985, MNRAS, 216, 385
- Saikia, Singal & Cornwell (1987) Saikia, D.J., Singal, A.K., & Cornwell, T.J. 1987, MNRAS, 224, 379
- Saikia et al. (1995) Saikia, D.J., Jeyakumar, S., Wiita, P.J., Sanghera, H.S., Spencer, R.E. 1995, MNRAS, 276, 1215
- Saikia et al. (1998) Saikia, D.J., Holmes, G.F., Kulkarni, A.R., Salter, C.J., & Garrington, S.T. 1998, MNRAS, 298, 877
- Spencer et al. (1991) Spencer, R.E., Schilizzi, R.T., Fanti, C., et al. 1991, MNRAS, 250, 225
- Tabara & Inoue (1980) Tabara, H., & Inoue, M. 1980, A&AS, 39, 373
- Taylor (2000) Taylor, G.B. 2000, ApJ, 533, 95
- Taylor et al. (1992) Taylor, G.B., Inoue, M., & Tabara, H. 1992, A&A, 264, 421
- Udomprasert et al. (1997) Udomprasert, P. S., Taylor, G. B., Pearson, T. J., & Roberts, D.H. 1997, ApJ, 483, L9
- van Breugel et al. (1992) van Breugel, W.J.M., Fanti, C., Fanti, R. et al. 1992, A&A, 256, 56
- Venturi & Taylor (1999) Venturi, T., & Taylor, G.B. 1999, AJ, 118, 1931
- Zavala & Taylor (2002) Zavala, R.T., & Taylor, G. 2002, ApJ, 566, L9
- Zavala & Taylor (2003) Zavala, R.T., & Taylor, G. 2003, ApJ, 589, 126
- Zavala & Taylor (2004) Zavala, R.T., & Taylor, G. 2004, ApJ, 612, 749