Department of Physics and Astronomy, University of Iowa, Iowa City, IA 52242, USA \PACSes\PACSit14.40.Nd, 14.40.Lb, 14.40.Pq
Heavy Flavor Spectroscopy at the Tevatron
Abstract
The Tevatron experiments have each accumulated about 6 of good data since the start of Run II. This large dataset provides excellent opportunities for heavy flavor spectroscopy studies at the Tevatron. This article will cover the latest polarization studies as well as exotic meson spectroscopy results.
1 Heavy Baryon–
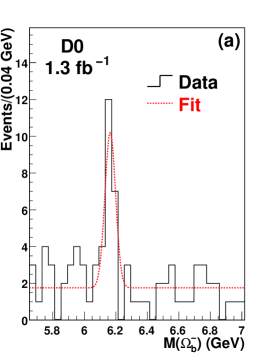
Here we discuss the most recent observation of by both the D0 (1.3 of data) and CDF (4.2 of data) experiments [1]. Both experiments observe this state through the following decay channel: . Charge conjugate modes are included implicitly in this note. D0 used a boosted decision tree to reconstruct the signal, while CDF used the traditional cut-based selection to reconstruct the signal. The reconstructed mass plots from the two experiments are shown in Fig. 1. However, the mass measured by D0 ( MeV/) and CDF ( MeV/) experiments disagree at the level of 6. The measured relative branching fraction with is also different at a level of between D0 () and CDF (). D0 is working on an update with much more data to resolve the issue.

2 polarization
Vector meson production and polarization in hadronic collisions are usually discussed within the framework of non-relativistic QCD (NRQCD). The theory predicts [2] that the vector meson polarization should become transverse in the perturbative regime; i.e., at large transverse momentum of the vector meson. However, the prediction is not supported by experimental observations [3]. We describe new results on this topic from the Tevatron. We define a parameter– to measure the polarization:
| (1) |
where is the angle with respect to the direction in the lab frame. If the meson is fully polarized in the transverse direction, = 1. If it is fully aligned longitudinally, =-1.
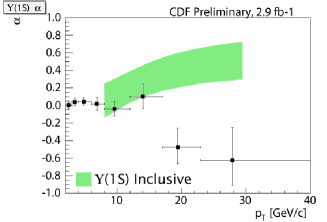
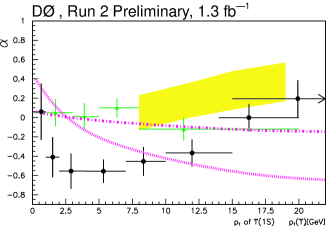
Fig. 2 shows the comparison between the theoretical prediction of (colored band) and the new CDF (left) [4] and D0 (right) [5] experimental results. In the low region, CDF shows nearly-unpolarized events, which is consistent with the CDF Run I result [6]; D0 shows partially longitudinally polarized events. At higher , the CDF results tend toward longitudinal polarization while the D0 result indicates transverse polarization. Both CDF and D0 results at high deviate from theoretical predictions. It will be interesting to investigate with more data and in some detail; e.g. study dependence since the CDF and D0 analyses have different acceptance.
3 Exotic mesons
It has been six years since the discovery of the [7]; however, the nature of this state has not yet been clearly understood. Due to the proximity of the to the threshold, the has been proposed as a molecule composed of and mesons. The has also been speculated to be two nearby states, as in models such as the model. It is critical to make precise measurements of the mass and width of to understand its nature. The large sample accumulated at CDF enables a test of the hypothesis that the is composed of two states and to make a precise mass measurement of if it is consistent with a one-state hypothesis.
There are many more states, similar to , that have charmonium-like decay modes but are difficult to place in the overall charmonium system [8, 9, 10]. These unexpected new states have introduced challenges to the conventional meson model and revitalized interest in exotic mesons in the charm sector [11], although the existence of exotic mesons has been discussed for many years [12]. Until recently all of these new states involved only quark and light quark (, ) decay products. The final state enables us to extend the exotic meson searches to quark and heavy quark decay products. An investigation of the system produced in exclusive decays with and is reported here.
3.1 Measurement of the mass of
A CDF analysis tested the hypothesis of whether the observed X(3872) signal is composed of two different states as predicted in some four-quark models using the CDF inclusive sample. The mass signal is fit with a Breit-Wigner function convoluted with a resolution function [13]. Both functions contain a width scale factor that is a free parameter in the fit and therefore sensitive to the shape of the mass signal. The measured width scale factor is compared to the values seen in simulations which assume two states with the given mass difference and ratio of events. The resolution in the simulated events is corrected for the difference between data and simulation as measured from the . The result of this hypotheses test shows that the data is consistent with a single state. Under the assumption of two states with equal amount of observed events, a limit of is set at 90% (95%) C.L.
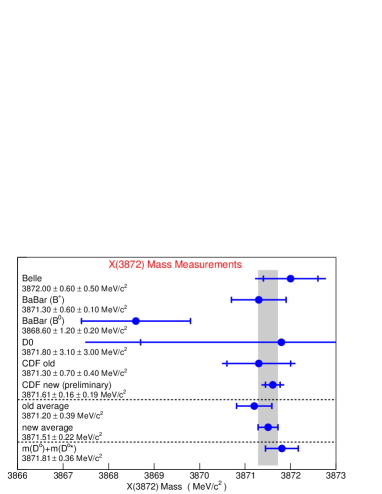
Since the is consistent with one peak in our test, its mass is measured in an unbinned maximum likelihood fit. The systematic uncertainties are determined from the difference between the measured mass and its world average value, the potential variation of the mass as a function of kinematic variables, and the difference in Q value between and . Systematics due to the fit model are negligible. The measured mass is: , which is the most precise measurement to date, as shown in Fig. 3 [13, 14].
3.2 Evidence for Y(4140)
The procedure for this analysis is to reconstruct the signal and then search for structures in the mass spectrum [15]. The events are recorded using a dedicated dimuon trigger. The candidates are reconstructed by combining a candidate, a candidate, and an additional charged track. Each track is required to have at least 4 axial silicon hits and have a transverse momentum greater than 400 . The reconstructed mass of each vector meson candidate must lie within a suitable range from the nominal values (50 for the and 7 for the ). In the final reconstruction the is mass constrained, and the candidates must have . The of the mass- and vertex-constrained fit to the candidate is required to be greater than 1%.
To suppress combinatorial background, and Time-of-Flight () information is used to identify all three kaons in the final state. The information is summarized in a log-likelihood ratio (), which reflects how well a candidate track can be positively identified as a kaon relative to other hadrons. In addition, a minimum is required for the candidate, where is the projection onto of the vector connecting the primary vertex to the decay vertex. The and requirements for are then chosen to maximize , where is the number of signal events and is the number of background events implied from the sideband. The requirements obtained by maximizing are and .
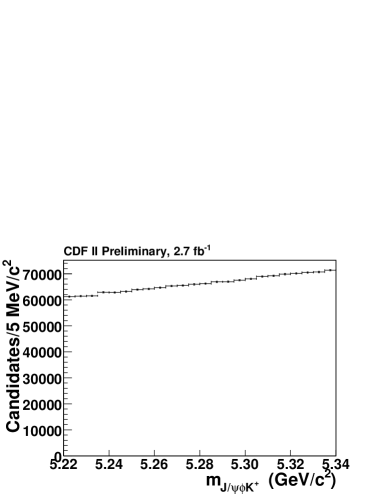
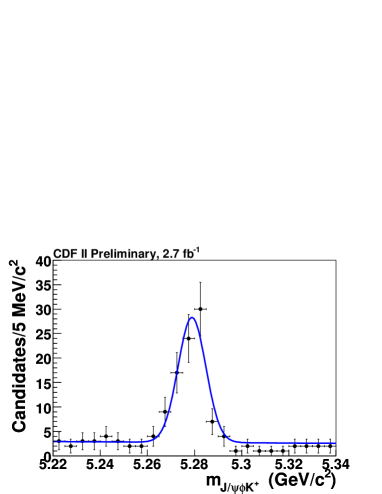
The invariant mass of , after and mass window requirements, before and after the minimum and kaon requirements, are shown in Fig. 4 and Fig. 5, respectively. The signal is not distinguishable before the and kaon requirements are applied, but a clear signal is seen after the requirements. A fit with a Gaussian signal function and a linear background function to the mass spectrum of (Fig. 5) returns a signal of events. The and requirements reduce the background by a factor of approximately 20 000 while keeping a signal efficiency of approximately 20%. The signal candidates are selected with a mass within 3 of the nominal mass; the purity of the signal in that mass window is about 80%.
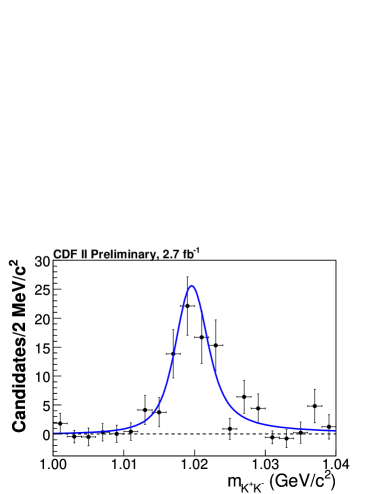
The combinatorial background under the peak includes hadron decays such as , in which the pions are misidentified as kaons. However, background events with misidentified kaons cannot yield a Gaussian peak at the mass consistent with the 5.9 mass resolution. Figure 6 shows the mass from candidates within of the nominal mass with sidebands subtracted before applying the mass window requirement. Using a smeared -wave relativistic Breit-Wigner (BW) [16] line-shape fit to the spectrum returns a probability of 28%. This shows that the final state is well described by .
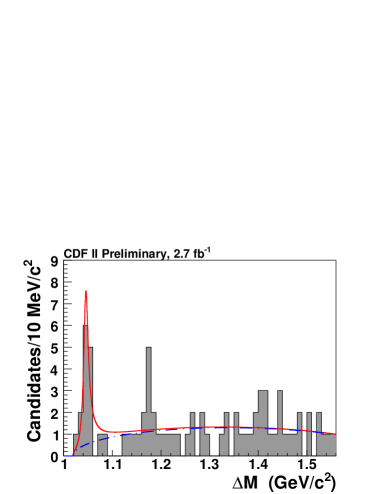
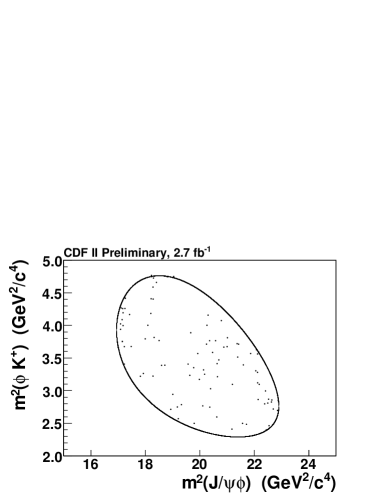
The effects of detector acceptance and selection requirements are examined using MC events simulated by a phase-space distribution. The MC events are smoothly distributed in the Dalitz plot and in the mass spectrum. No artifacts were observed from MC events. Figure 7 shows the Dalitz plot of versus , and Fig. 8 shows the mass difference, , for events in the mass window in our data sample. The enhancement in the spectrum just above threshold is examined. The high–mass part of the spectrum beyond is excluded to avoid combinatorial backgrounds that would be expected from misidentified decays. The enhancement is modeled by an -wave relativistic BW function [17] convoluted with a Gaussian resolution function with the RMS fixed to 1.7 obtained from MC, and three–body phase space [12] is used to describe the background shape. An unbinned likelihood fit to the distribution, as shown in Fig. 8, returns a yield of events, a of , and a width of . To investigate possible reflections, the Dalitz plot and projections into the and spectra are examined. No evidence for any other structure in the and spectra is found.
The log-likelihood ratio of is used to determine the significance of the enhancement, where and are the likelihood values for the null hypothesis fit and signal hypothesis fit. The value is 5.3 for a pure three–body phase space background shape assumption. Using the background distribution alone, spectra are generated, and searched for the most significant fluctuation with in each spectrum in the mass range of 1.02 to 1.56 , with widths in the range of 1.7 (detector resolution) to 120 (ten times the observed width).
The resulting -value from 3.1 million simulations is , corresponding to a significance of 4.3. This process is repeated with a flat combinatorial non-B background and three–body PS for non-resonance background, which gives a significance of 3.8.
One’s eye tends to be drawn to a second cluster of events around 1.18 in Fig. 8. This cluster is close to one pion mass above the peak at the threshold. However, this cluster is statistically insufficient to infer the presence of a second structure.
4 Summary
Both D0 and CDF observed the baryon through the same reconstruction channel. However, the measured mass disagrees at a level of 6 between the two experiments. D0 is working on an update with much more data to resolve this issue.
For polarization, CDF result shows nearly-unpolarized events at low , while D0 shows partially longitudinally polarization. At higher , CDF results tend toward longitudinal polarization while D0 results indicate transverse polarization. Both CDF and D0 results at high deviate from theoretical predictions. CDF is continuing the analysis and will double the dataset. D0 has the opportunity to study the rapidity dependence, since their measurement spans the range compared to 0.6 for CDF.
Studies using CDF’s sample, the largest in the world, indicate that the is consistent with the one-state hypothesis and this leads to the most precise mass measurement of . The value is below, but within the uncertainties of the threshold. The explanation of the X(3872) as a bound D*D system is therefore still an option.
The sample at CDF enables a search for structure in the mass spectrum, and evidence is found for a narrow structure near the threshold with a significance estimated to be at least 3.8. Assuming an -wave relativistic BW, the mass (adding mass) and width of this structure, including systematic uncertainties, are measured to be and , respectively. This structure does not fit conventional expectations for a charmonium state because as a state it is expected to have a tiny branching ratio to with its mass well beyond open charm pairs. The new structure is termed the . The branching ratio of is estimated to be .
Acknowledgements.
We thank the Fermilab staffs and the technical staffs of the participating institutions for their vital contributions.References
- [1] V. Abazov, et al., (D0 Collaboration) Phys. Rev. Lett. 101, 232002 (2008); T. Abulencia et al., (CDFCollaboration), Phys. Rev. D 80, 072003 (2009).
- [2] M. Kramer, arXiv:hep-ph/0106120.
- [3] T. Afolder et al., (CDFCollaboration), Phys. Rev. Lett. 85, 2886 (2000); T. Abulencia et al., (CDFCollaboration), Phys. Rev. Lett. 99, 132001 (2007).
- [4] http://www-cdf.fnal.gov/physics/new/bottom/090903.blessed-Upsilon1S-polarization/blessedplots.html.
- [5] V. Abazov, et al., (D0 Collaboration), Phys. Rev. Lett. 101, 012001 (2008).
- [6] D. Acosta, et al., (CDFCollaboration), Phys. Rev. Lett. 88, 161802 (2002).
- [7] S.-K. Choi et al. (Belle Collaboration), Phys. Rev. Lett. 91, 262001 (2003); D. Acosta et al. (CDF Collaboration), Phys. Rev. Lett. 93, 072001 (2004); S.-K. Choi et al. (Belle Collaboration), Phys. Rev. Lett. 94, 182002 (2005); B. Aubert et al. (BABAR Collaboration), Phys. Rev. Lett. 95, 142001 (2005); S. Godfrey and S. L. Olsen, Ann. Rev. Nucl. Part. Sci 58 (2008) 51.
- [8] S.-K. Choi et al. (Belle Collaboration), Phys. Rev. Lett. 94, 182002 (2005); B. Aubert et al. (BABAR Collaboration), Phys. Rev. Lett. 101, 082001 (2008).
- [9] B. Aubert et al. (BABAR Collaboration), Phys. Rev. Lett. 95, 142001 (2005).
- [10] B. Aubert et al. (BABAR Collaboration), Phys. Rev. Lett. 98, 212001 (2007); X. L. Wang et al. (Belle Collaboration), Phys. Rev. Lett. 99, 142002 (2007); S.-K. Choi et al. (Belle Collaboration), Phys. Rev. Lett. 100, 142001 (2008); R. Mizuk et al. (Belle Collaboration), Phys. Rev. D 78, 072004 (2008); P. Pakhlov et al. (Belle Collaboration), Phys. Rev. Lett. 100, 202001 (2008).
- [11] E. Eichten, S. Godfrey, H. Mahlke, and J. Rosner, Rev. Mod. Phys. 80, 1161 (2008); S. L. Zhu, Phys. Lett. B 625, 212 (2005); F. Close and P. Page, Phys. Lett. B 628, 215 (2005); E. S. Swanson, Phys. Lett. B 588, 189 (2004); L. Maiani, F. Piccinini, A. D. Polosa, and V. Riquer, Phys. Rev. D 72, 031502(R) (2005); N. V. Drenska, R. Faccini, and A. D. Polosa, arXiv:hep-ph/0902.2803v1. T. W. Chiu and T. H. Hsieh, Phys. Lett. B 646, 95 (2007).
- [12] C. Amsler et al. (Particle Data Group), Phys. Lett. B 667, 1 (2008).
- [13] T. Aaltonen et al. CDF Collaboration, arXiv:0906.5218 [hep-ex];
- [14] I. Adachi, et al. (Belle Collaboration), arXiv:0809.1224v1 [hep-ex].
- [15] T. Aaltonen et al. CDF Collaboration, Phys. Rev. Lett. 102, 242002 (2009).
- [16] B. Aubert et al. (BABAR Collaboration), Phys. Rev. D 78, 071103 (2008).
- [17] , where , and the 0 subscript indicates the value at the peak mass.