]Deceased.
Si-compatible candidates for \hk dielectrics with the Pbnm perovskite structure
Abstract
We analyze both experimentally (where possible) and theoretically from first-principles the dielectric tensor components and crystal structure of five classes of perovskites. All of these materials are believed to be stable on silicon and are therefore promising candidates for high-K dielectrics. We also analyze the structure of these materials with various simple models, decompose the lattice contribution to the dielectric tensor into force constant matrix eigenmode contributions, explore a peculiar correlation between structural and dielectric anisotropies in these compounds and give phonon frequencies and infrared activities of those modes that are infrared-active. We find that CaZrO3, SrZrO3, LaHoO3, and LaYO3 are among the most promising candidates for high-K dielectrics among the compounds we considered.
pacs:
77.22.-d,77.55.df,85.50.-nI Introduction
As a result of the ongoing down-scaling of complementary metal-oxide-semiconductor (CMOS) integrated circuits, the SiO2 gate oxide of field effect transistors is getting thinner and thinner in every new generation of devices. Moore (2003) Therefore the leakage current due to quantum-mechanical tunneling through the dielectric interface is increasing. One way to reduce this current is to replace SiO2 with a material that has a higher dielectric constant. Such a high-K dielectric layer with the same effective dielectric thickness (i.e., providing the same capacitance) could be physically thicker and thus reduce the gate leakage.
In order for this replacement material to be useful in practical applications on silicon, it also needs to be stable in contact with silicon up to 1000 ∘C, and among other things it must also have an appropriate band alignment with silicon. Schlom et al. (2005, 2008); Robertson (2008) Currently, a hafnia-based dielectric is used as a replacement to SiO2 in advanced CMOS transistors in production. Mistry et al. (2007); Hicks et al. (2008); Scansen (21 Jan. 2008) There are, however, drawbacks to this material too, e.g., the limited K that it provides and undesirable threshold voltage shifts arising from highly mobile oxygen vacancies. Guha and Narayanan (2007) This brings up the natural question: which other materials exist that would satisfy these requirements and would enable the scaling of MOSFETs to continue beyond today’s hafnia-based dielectrics?
The stability of single component oxides on silicon has been demonstrated both experimentally and from thermodynamic analysis,Schlom et al. (2008) and a candidate list of multicomponent oxide materials has been compiled. Schlom et al. (2005) A promising group of these materials consists of perovskite oxides having a (or closely related ) space group.

These compounds are at the focus of the present work. Some of them have been studied in thin-film form, Christen et al. (2006); Afanas’ev et al. (2004); Zhao et al. (2005); Heeg et al. (2006); Edge et al. (2006a); Cicerrella et al. (2005); Afanas’ev et al. (2006); Edge et al. (2006b); Sivasubramani et al. (2006); Lopes et al. (2007); Wang et al. (2007); Edge et al. (2008); Özben et al. (2008); Roeckerath et al. (2009); Wagner et al. (2006); Myllymaki et al. (Sept. 2007); Kim et al. (2006); Thomas et al. (2007); Heeg et al. (2007) but the full dielectric tensor of these materials has not yet been established, making the selection of materials best suited for high-K applications difficult. Some of these materials could also be of interest for microwave dielectric applications.Wersing (1996); Vanderah (2002) Thus we decided to study, both theoretically and experimentally, the structural and dielectric properties of these compounds. The calculations are carried out using density-functional theory, and we compare the results with experimental data where we could obtain suitable samples for measurements. To our knowledge, previous theoretical calculations have been carried out in only a few cases.Delugas et al. (2007); Vali (2008, 2009)
The paper is organized as follows. Explanations of both the experimental and theoretical methods used in this work are given in Sec. II. The main results on the structural and dielectric properties are given and discussed in Sec. III. There we also discuss the correlations between the structural and dielectric properties of these perovskites, decompose the ionic contribution of the dielectric tensor into components arising from various force constant matrix eigenvectors, and discuss the effect of BA antisite defects on the dielectric properties. We finish with a brief summary in Sec. IV.
Supplementary material EPA contains the results of our calculations of the zone-center phonon frequencies, as well as the infrared activities for those modes that are infrared-active.
I.1 Compounds under consideration
In this work, we consider the following five groups of perovskites having the space group.
The first group are rare-earth scandates having formula AScO3 where A is a rare-earth atom. In Sec. III.3.1 we report experimental measurements of the full dielectric tensors for PrScO3, NdScO3, SmScO3, GdScO3 and DyScO3. Calculations were done on these and also on LaScO3 and TbScO3. Note that HoScO3, ErScO3, TmScO3, YbScO3, LuScO3, and YScO3 do not form single crystals with the perovskite structure from the melt at atmospheric pressure. Rather, they form solid solutions of A2O3 and Sc2O3, i.e., (A,Sc)2O3, with the bixbyite structure.Badie (1978); Badie and Foex (1978); Coutures et al. (1980) Nevertheless, LuScO3 Heeg et al. (2007) and YbScO3 sch have been formed in perovskite form as thin films via epitaxial stabilization, and others might be made in the same way. To analyze trends within this group of compounds, we also did the calculations of dielectric tensors on LuScO3 and YScO3 in the perovskite structure; see Sec. III.3.1 for the details.
The second group consists of rare-earth yttrates with formula AYO3. Only one such compound, LaYO3, is known to form a perovskite,Berndt et al. (1975) but to analyze trends the dielectric tensor of DyYO3 in the perovskite structure was also calculated.
In the third group we consider CaZrO3, SrZrO3 and SrHfO3 perovskites. Experimentally, we find that SrZrO3 and SrHfO3 do not form single crystals, but instead are rather heavily twinned.
The fourth group of compounds have the formula La2BB′O6 where the B atom is either Mg or Ca and B′ is either Zr or Hf. Little is known experimentally about these compounds, and single crystals of these compounds have not been made.Rabenau (1956)
The last group of compounds we considered have the formula AA’O3, where both A and A’ are rare-earth atoms. These include the 11 of such compounds that are known to form the perovskite structure with space group at atmospheric pressure: LaHoO3, LaErO3, LaTmO3, LaYbO3, LaLuO3, CeTmO3, CeYbO3, CeLuO3, PrYbO3, PrLuO3, and NdLuO3.Berndt et al. (1975); Ito et al. (2001); Bharathy et al. (2009) We calculated the dielectric and structural properties of all of these compounds. The experimental determination, however, of the dielectric tensor in this group of compounds was done only for LaLuO3; the results will be published elsewhere. hee
II Preliminaries
II.1 Structure of perovskites
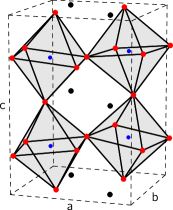
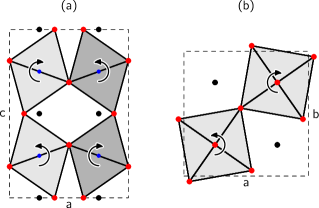
The ideal cubic perovskite ABO3 consists of a network of corner-shared octahedra, each with an oxygen on its vertices and a B atom at its center, and A ions that are 12-fold coordinated in the spaces between octahedra. It is well known that perovskites having sufficiently small A-site ions (i.e., a small Goldschmidt tolerance factorGoldschmidt (1926); Woodward (1997)) often allow for a distorted perovskite structure that has a rotated framework of oxygen octahedra and displaced A-site ions. This lowers the space group symmetry from cubic () to orthorhombic (), and the number of ABO3 formula units per primitive cell increases from to , as shown in Fig. 2. The rotations of the octahedra in the space group can be decomposed into two steps. The first step is the rotation around the direction of the original cubic frame (the cubic frame is rotated by 45∘ around the axis with respect to the frame) by an angle as in Fig. 3(a), and the second step is a rotation around by as in Fig. 3(b). The rotations must be done in that order to prevent distortions of the octahedra. The pattern of neighboring octahedral rotations is denoted by () in Glazer notation Glazer (1972) (or see the directions of the arrows in Fig. 3). These rotations also allow for the displacement of A-site ions in the - plane without further lowering of the space-group symmetry.
II.2 Computational methods
The main computational method we are using is the density-functional theory as implemented in the Quantum-Espresso package.Giannozzi et al. (2009) The exchange-correlation functional was approximated using a generalized gradient approximation (GGA) of the Perdew-Burke-Ernzerhof type Perdew et al. (1996) and ultrasoft pseudopotentials were employed.Vanderbilt (1985) The electronic wavefunctions were expanded in a basis of plane waves with kinetic energy up to 40 Ry, while the charge density was expanded up to 300 Ry. The Brillouin zone was sampled using a Monkhorst-Pack grid.Monkhorst and Pack (1976)
A new set of ultrasoft pseudopotentialsVanderbilt (1985) for the lanthanoide series of rare earths, from La to Lu, were generated for the present project. In all cases the -shell filling was chosen as appropriate for the 3+ valence state: one electron for Ce, two for Pr, etc. The electrons were then considered to be in the core (and un-spin-polarized) for the proposes of generating the pseudopotentials. Thus, the electrons are not explicitly included in the solid-state calculations. Such an approximation can be justified whenever the strong on-site Coulomb interactions of electrons in the shell drive the occupied states well below, and the unoccupied states well above, the energy range of interest for bonding in the crystal. Of course, this will not be a good approximation for some heavy-fermion or mixed-valent systems, and in any case our approach is obviously unable to describe phenomena involving magnetic ordering of electrons at low temperature. Nevertheless, we believe that this approach is quite reasonable for the present purposes.
The artificial nature of the scattering in the channel did, however, pose some problems in the pseudopotential construction. In particular, we found that the lattice constant of a perovskite containing the rare-earth atom in question could differ for two pseudopotentials having different scattering properties in the channel; this causes problems since the usual approach of matching to the all-electron scattering is not appropriate in the present case. To ameliorate this problem, the -channel parameters of these pseudopotentials were optimized so that resulting pseudopotentials would give the “correct” cell volumes for simple rare-earth compounds. Since the GGA typically overestimates crystal volumes by about 1-2%,Staroverov et al. (2004) the optimization was actually done in order to produce a corresponding overestimate in a consistent fashion.
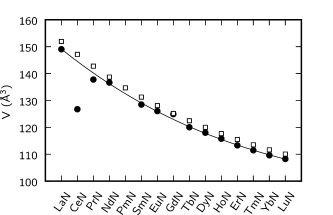
For this procedure, our compounds of choice were the rare-earth nitrides with the simple rock-salt structure. The experimentalPies and Weiss (2006) and calculated volumes of these nitrides are indicated in Fig. 4. Note that the volumes of CeN, PrN, and GdN show an anomalous behavior that is presumably due to strong correlation effects associated with the proximity to a mixed-valent regime, gdn and therefore they will not be correctly treated by our GGA calculation. To avoid this problem we first carried out a smoothened fit of the experimental volumes versus atomic number over the lanthanoide nitride series, but with CeN, PrN, and GdN omitted from the fit, as shown by the solid line in Fig. 4. We then used these fitted values to set the target volumes for the optimization of the pseudopotentials.
We used density-functional perturbation theoryBaroni et al. (2001) to calculate the dielectric response. Both purely electronic and ionic contributions were calculated.Cockayne and Burton (2000) The electronic part is defined as
| (1) |
where is the polarization induced by the electric field while all ions are held fixed (). The remaining component of the dielectric response is by definition the ionic contribution .
This ionic part can be calculated from the force-constant matrix and the Born effective charge matrix . The force-constant matrix is defined as
| (2) |
where is the total energy of the system and is the displacement of the -th atom along the direction . We will denote the -th normalized eigenvector of this matrix as and its eigenvalue as . The Born effective charge matrix is defined as
| (3) |
where is the polarization induced in a crystal by the displacement of the -th atom in the direction . is the volume of the unit cell and is the electron charge. Finally, the ionic part of the dielectric tensor can be written as
| (4) |
where the charge of the -th eigenmode is defined through the effective charge matrix as .
II.3 Experimental methods
II.3.1 Crystal growth
PrScO3, NdScO3, SmScO3, GdScO3, TbScO3, and DyScO3 single crystals were grown using an automated Czochralski technique with RF-induction heating. Uecker et al. (2006, 2008) Pre-dried powders of Sc2O3, Pr6O11, Nd2O3, Sm2O3, Gd2O3, Tb4O7, and Dy2O3, were mixed in the stoichiometric ratio, pressed, and sintered at about 1400 ∘C for 15 h. Due to the high melting temperature of PrScO3, NdScO3, SmScO3, GdScO3, TbScO3, and DyScO3 (2100 ∘C), a crucible (cylindrical with 40 mm or 60 mm diameter and 40 mm or 60 mm height, depending on the crystal diameter) and an active afterheater made of iridium were used. Flowing nitrogen or argon was used as the growth atmosphere. Those of these rare-earth scandates for which the radiative heat transport via the crystal is hindered by absorption suffer from a serious problem of bulk crystal growth, namely that they tend to exhibit a spiral growth which distinctly decreases the yield. Uecker et al. (2006) Due to the lack of seed crystals, the initial growth experiments were performed with an iridium seed rod. Because these materials tend to grow as large single-crystalline grains, suitable seeds could be selected at a very early stage.
All rare-earth scandate crystals were grown along the orientation. The pulling rate was - mmh-1 and the rotation rate was - min-1 (depending on the crystal diameter). The crystals were 35-50 mm in length and 18 or 32 mm in diameter. The PrScO3 crystals have a green color, the NdScO3 crystals are dark purple, the SmScO3 and DyScO3 crystals are light yellow, the GdScO3 crystals are colorless, and the TbScO3 crystals are nearly colorless (see Fig. 1).
In addition to the Czochralski growth of PrScO3, NdScO3, SmScO3, GdScO3, TbScO3, and DyScO3, the single-crystal growth of HoScO3, YScO3, and solid solutions of rare-earth scandates that would be expected to have smaller lattice constants than DyScO3 (e.g., Dy0.5Lu0.5ScO3), was also attempted using the floating-zone technique. In all cases, pre-dried powders of the rare-earth oxides (R2O3) and Sc2O3 were ground, pressed into a rod, and sintered at 1400 ∘C for 6 hours. The floating-zone machine was a Gero (model SPO), and heating was performed with two bulbs at the focal point of ellipsoidal mirrors. Unfortunately, the 1 kW rated output power of the quartz-halogen lamps used in this floating-zone system was close to the melting temperature of the compounds, limiting the size of the crystals that could be grown to mm diameter. SrZrO3, SrHfO3, and LaScO3 single crystals grown by the floating zone technique were also studied. srz
The available R2O3-Sc2O3 binary phase diagrams show a distinct transition between the Dy2O3-Sc2O3 and the Ho2O3-Sc2O3 systems (Dy and Ho are neighboring elements in the periodic table). According to published phase diagrams, the rare-earth elements of La, Nd, Sm, Gd, and Dy all form RScO3 compounds that melt congruently. In contrast the oxides of Ho, Er, Tm, Yb, and Lu form complete solid solutions with Sc2O3 at their melting points. Badie (1978); Badie and Foex (1978); Coutures et al. (1980) (The same happens with Y as well. Badie (1978); Badie and Foex (1978); Coutures et al. (1980)) Although HoScO3 has been synthesized with solid-state techniques at temperatures (well below the melting point) at which the perovskite polymorph of HoScO3 is stable, our results confirm that the perovskite polymorph of HoScO3 is not stable at its melting point in agreement with existing phase diagrams. Analysis of our Y-Sc-O and Ho-Sc-O single crystals revealed that they were solid solution mixtures of Ho2O3 and Sc2O3, and Y2O3 and Sc2O3, not the desired perovskite polymorphs of HoScO3 and YScO3. The only compound that did not behave according to its phase diagram was LaScO3. Attempts to grow LaScO3 resulted in crystals that were a mixture of three different phases including LaScO3, Sc2O3, and a third, unidentified phase. srz X-ray analysis of the post-annealed polycrystalline feed rod showed single-phase LaScO3, consistent with the existing phase diagram. The reason for the introduction of second phases during melting is not clear and requires more study.
II.3.2 Electrical characterization
Because PrScO3, NdScO3, SmScO3, GdScO3, and DyScO3 are orthorhombic at room temperature, their dielectric tensor contains three independent coefficients that can be measured along the three principle crystal axes. Newnham (2005) From the grown PrScO3, NdScO3, SmScO3, GdScO3, and DyScO3 single crystals, slices were cut in different orientations for electrical characterization. For GdScO3, samples were cut from the as-grown single crystals along the , , and directions, and the dielectric tensor coefficients were measured using a parallel-plate capacitor configuration. For PrScO3, NdScO3, SmScO3, and DyScO3, several additional orientations were prepared, so that a least-squares fit technique could be applied using standard methods Newnham (2005) to calculate the dielectric tensor, using their known lattice parameters.Uecker et al. (2008); Gesing et al. (2009)
Unfortunately, the SrZrO3 and SrHfO3 crystals were heavily twinned. The formation of twins in the three pseudocubic orientations is facilitated in these two orthorhombic systems because the deviation from the cubic symmetry is very small. As a result, only an average dielectric constant could be measured.
To obtain capacitors, gold or platinum electrodes were evaporated onto both sides of the approximately 0.5 mm thick slabs with areas ranging from 15 to 100 mm2, and capacitance measurements were made at room temperature with an HP4284A using a 16034E test fixture at 10 kHz, 100 kHz, and 1 MHz. No edge capacitance corrections were used because of the large ratio of the electrode area to the thickness of the samples. The room temperature dielectric loss of the samples was generally very small ( for most samples) and the frequency dispersion was negligible in the measured range. The temperature dependent dielectric measurements on GdScO3 and DyScO3 were made using a HP 4284a LCR meter with a dipstick cryostat.
III Results and discussion
III.1 Structural properties
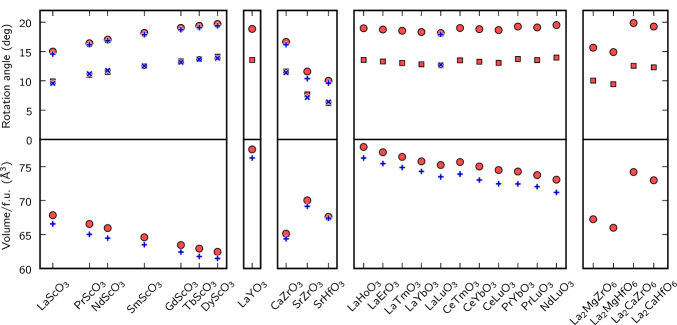
We focus first on the structural properties of these systems. The structure of the perovkites is described by three orthorhombic lattice constants plus two A-site and five oxygen Wyckoff parameters. Figure 5 shows graphically the most important structural parameters of these systems, while Table 1 gives detailed information on all the structural parameters. Rotational angles in Table 1 and in Fig. 5 were calculated by fitting the structural parameters to a model in which the octahedra are perfectly rigid (see Sec. III.2 for the details of this model).
Overall we find good agreement with experimental values for the structural parameters. The Wyckoff coordinates in particular are in excellent agreement with experiments, with the average error being on the order of . The volume of the unit cell, on the other hand, is consistently overestimated by 1-2%, as is usually expected from the GGA exchange-correlation functional, and as we would expect from our construction of the rare-earth pseudopotentials.
All structures show an angle that is about times larger than . Therefore, consecutive rotations by and can be considered approximately as a single rotation around a axis in the cubic frame. That is, the actual () pattern of rotations is very nearly () in the Glazer notation.Glazer (1972) See Sec. III.6 for a more detailed discussion.
III.1.1 Rare-earth scandates
The rare-earth scandates AScO3 show a decrease in volume by 9% while going along the series from A=La to A=Dy (the calculated primitive unit cell volume is 271.40 Å3 for LaScO3 and 249.81 Å3 for DyScO3). On the other hand, the Sc-O distance remains nearly constant along the series (2.12 Å for LaScO3 and 2.11 Å for DyScO3), which means that the change in volume is almost entirely due to the larger octahedral rotation angles for DyScO3 as compared to LaScO3. Our calculations also show that the same trend continues all the way to LuScO3.
III.1.2 Rare-earth yttrates
The rare-earth yttrates have a very similar behavior as the rare-earth scandates. The main quantitative structural difference between the two comes from the fact that yttrium is a larger ion than scandium. This leads to a larger volume for the yttrates, and also a larger rotation angle due to a smaller tolerance factor.
III.1.3 CaZrO3, SrZrO3, and SrHfO3
SrZrO3 and SrHfO3 have quite similar structural properties. The main difference can be traced to the fact that Hf is a smaller ion than Zr. Therefore, the calculated average Hf-O distance is 2.07 Å, while the average Zr-O distance is 2.11 Å. Furthermore, their octahedral rotation angles are about 1.7 times smaller than in the rare-earth scandates.
In CaZrO3 the average Zr-O distance is 2.10 Å, which is very close to the corresponding distance in SrZrO3 and SrHfO3. Thus, the main reason why CaZrO3 has a smaller volume than SrZrO3 is because of the larger rotation angles in CaZrO3.
III.1.4 La2BB′O6 compounds
We consider La2BB′O6 compounds with B=Mg or Ca and B′=Zr or Hf. These compounds are expected to exhibit rock-salt ordering of the B-site ions as a result of the difference in charge and ionic radius between the B and B′ ions.Anderson et al. (1993) This ordering reduces the symmetry from the orthorhombic to the monoclinic () space group.
The structural properties for these systems are reported in Fig. 5 and in Table 2. The rotational angles are obtained by a fit to the rigid-octahedra model in which we have allowed for different sizes of B- and B′-centered octahedra. (See the end of Sec. III.2 for details.)
The unit cell volume is larger by about 5 Å3 per primitive cell for the compounds containing Zr than for those containing Hf. On the other hand, compounds with Ca are larger by about 28 Å3 than those containing Mg. Similarly, the rotation angles are larger in compounds containing Ca than in those with Mg. The discrepancy between octahedral sizes is largest for La2CaHfO6 (12% linear increase) and smallest for La2MgZrO6 (0.4% linear increase).
III.1.5 Rare-earth rare-earth perovskites
We now briefly analyze the structural properties of perovskites of type AA’O3 where both A and A’ are rare-earth atoms. All eleven compounds we considered are known experimentally to form the perovskite structure in the space group. Berndt et al. (1975); Ito et al. (2001); Bharathy et al. (2009)
Among these 11 compounds, the largest unit-cell volume of 311.58 Å3 is found in LaHoO3, and the smallest of 292.32 Å3 is in NdLuO3, Oxygen oxtahedral rotation angles are quite large in all of these compounds and show very little variation from one compound to another. The trends of the rotation angles are as expected from a tolerance-factor analysis: perovskites with smaller A-site ions but the same B-site ions have larger oxygen octahedral rotation angles, and the opposite is true for the B-site ions.
| Unit cell parameters | Wyckoff coordinates | Model | ||||||||||||||
| (Å) | (Å) | (Å) | (Å3) | (∘) | (∘) | |||||||||||
| LaScO3 | T | |||||||||||||||
| Ea | ||||||||||||||||
| PrScO3 | T | |||||||||||||||
| Ej | ||||||||||||||||
| NdScO3 | T | |||||||||||||||
| Eb | ||||||||||||||||
| SmScO3 | T | |||||||||||||||
| Eb | ||||||||||||||||
| GdScO3 | T | |||||||||||||||
| Eb | ||||||||||||||||
| TbScO3 | T | |||||||||||||||
| Ek | ||||||||||||||||
| DyScO3 | T | |||||||||||||||
| Of | ||||||||||||||||
| Eb | ||||||||||||||||
| LaYO3 | T | |||||||||||||||
| El | ||||||||||||||||
| CaZrO3 | T | |||||||||||||||
| Em | ||||||||||||||||
| SrZrO3 | T | |||||||||||||||
| Og | ||||||||||||||||
| Ec | ||||||||||||||||
| SrHfO3 | T | |||||||||||||||
| Oh | ||||||||||||||||
| Ed | ||||||||||||||||
| LaHoO3 | T | |||||||||||||||
| Ei | ||||||||||||||||
| LaErO3 | T | |||||||||||||||
| Ei | ||||||||||||||||
| LaTmO3 | T | |||||||||||||||
| Ei | ||||||||||||||||
| LaYbO3 | T | |||||||||||||||
| Ei | ||||||||||||||||
| LaLuO3 | T | |||||||||||||||
| Ee | ||||||||||||||||
| CeTmO3 | T | |||||||||||||||
| Ei | ||||||||||||||||
| CeYbO3 | T | |||||||||||||||
| Ei | ||||||||||||||||
| CeLuO3 | T | |||||||||||||||
| Ei | ||||||||||||||||
| PrYbO3 | T | |||||||||||||||
| Ei | ||||||||||||||||
| PrLuO3 | T | |||||||||||||||
| Ei | ||||||||||||||||
| NdLuO3 | T | |||||||||||||||
| Ei | ||||||||||||||||
-
a Reference [Liferovich and Mitchell, 2004]. b Reference [Velickov et al., 2007]. c Reference [Kennedy et al., 1999a]. d Reference [Kennedy et al., 1999b]. e Reference [Ito et al., 2001]. f Reference [Delugas et al., 2007]. g Reference [Vali, 2008]. h Reference [Vali, 2009]. i Reference [Berndt et al., 1975]. j Reference [Gesing et al., 2009]. k Reference [Velickov et al., 2008]. l Reference [Ruiz-Trejo et al., 1999]. m Reference [Levin et al., 2003].
| Unit cell | Model | Wyckoff coordinates | ||||||
|---|---|---|---|---|---|---|---|---|
| La2MgZrO6 | 5.6899 | 15.7 | ||||||
| 5.8169 | 10.0 | La | ||||||
| 8.1274 | 10.1 | OI | ||||||
| 90.301 | 1.004 | OII | ||||||
| V | 269.00 | OIII | ||||||
| Unit cell | Model | Wyckoff coordinates | ||||||
| La2MgHfO6 | 5.6669 | 14.9 | ||||||
| 5.7679 | 9.3 | La | ||||||
| 8.0765 | 9.5 | OI | ||||||
| 90.205 | 1.018 | OII | ||||||
| V | 263.99 | OIII | ||||||
| Unit cell | Model | Wyckoff coordinates | ||||||
| La2CaZrO6 | 5.8188 | 19.9 | ||||||
| 6.0547 | 12.0 | La | ||||||
| 8.4245 | 13.2 | OI | ||||||
| 90.182 | 1.100 | OII | ||||||
| V | 296.80 | OIII | ||||||
| Unit cell | Model | Wyckoff coordinates | ||||||
| La2CaHfO6 | 5.7946 | 19.3 | ||||||
| 6.0211 | 11.6 | La | ||||||
| 8.3680 | 13.0 | OI | ||||||
| 90.100 | 1.117 | OII | ||||||
| V | 291.96 | OIII | ||||||
III.2 Comparison with model of perfectly rigid octahedra
In perovskites, a rigid rotation of the oxygen octahedra by followed by another rigid rotation by (see Fig. 3) leads to Wyckoff parameters given by
| (5) | ||||
| (6) | ||||
| (7) | ||||
| (8) | ||||
| (9) |
Here we have denoted the Wyckoff coordinates of the oxygen atoms at the Wyckoff point with and , while those of the remaining oxygen atoms at the point are denoted with , , and . The Wyckoff coordinates of the A-site ion at the point are denoted by and , but these are left unspecified in our rigid-octahedra model. It also leads to orthorhombic lattice constants given by
| (10) | ||||
| (11) | ||||
| (12) |
where is the volume the structure would have if the octahedra were rotated rigidly back to .
The Wyckoff parameters and unit-cell ratios from our calculations can be well fitted by Eqs. 5-12 (see Table 1 and Fig. 5 for the values of the fitted angles). By far the largest discrepancy is found for Wyckoff parameter . For a typical system (e.g., LaScO3) the discrepancy between calculated and fitted values is about 0.016, or 50% with respect to the difference from the cubic case. For the remaining oxygen Wyckoff coefficients, the discrepancy averages about 0.003, or 5%.
The rotation angles for the La2BB′O6 systems were obtained by fitting their structural parameters to a slightly more complicated model of rigid octahedra than the one given in Eqs. 5-12. In this model, we first change the relative sizes of B- and B′-centered octahedra. The ratio of their linear sizes is denoted by . We then proceed with the rotation by an angle around the axis in the cubic frame. Finally, we perform a rotation of the B-centered octahedra around by an angle , and of the B′-centered octahedra by an angle around the same axis. The resulting fitted values of these parameters are given in Table 2.
III.3 Dielectric properties
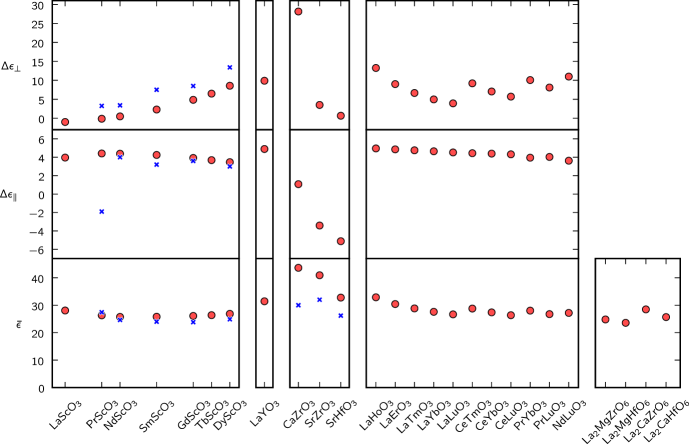
In this section we discuss the dielectric properties of the materials included in our study. perovskites are orthorhombic and thus have diagonal dielectric tensors, with in general. In addition to reporting these components, we also focus on analyzing the results in terms of the three linear combinations
| (13) | ||||
| (14) | ||||
| (15) |
representing the average dielectric tensor, a measure of the - anisotropy, and a measure of anisotropy, respectively. This choice of parameters was made to simplify the analysis of trends of dielectric properties of these compounds. The theoretical – and where available, experimental – results for the dielectric-tensor components are reported in Figure 7 and in Table 3. The theoretical values are further decomposed in Table 3 into purely electronic or frozen-ion contributions and lattice-mediated contributions . We find that the electronic contribution is roughly five times smaller than the ionic one, is nearly isotropic, and does not show a dramatic variation from one perovskite to another. Thus, it is clear that the lattice-mediated ionic contributions play by far the dominant role in the observed dielectric tensors and their anisotropies.
Our calculations of the zone-center phonon frequencies as well as the infrared activities for those modes that are infrared-active are given in the supplementary material. EPA
We now consider each of our chosen classes of perovskites in turn, orienting the presentation from the point of view of the theoretical calculations, but mentioning the comparison with experiment where appropriate.
III.3.1 Rare-earth scandates
All rare-earth scandates AScO3 have rather similar values for their isotropically-averaged dielectric constants, falling between about and . The component for all these systems is larger than the component by about . On the other hand, the component changes significantly from LaScO3 to DyScO3. In LaScO3 the average of the and components is almost as large as the component (=-1), while in DyScO3, the component is larger by about =9 than the average of and components.
These results are in good agreement with experiment, especially for and . On the other hand, is consistently larger in experiments by about 3-5, but the trend of increasing is present in both theory and experiment.
As was mentioned earlier, rare-earth atoms heavier than Dy (i.e., Ho-Lu) and Y itself do not form single-crystal scandates. Nevertheless, at least some (YbScO3 sch and LuScO3 Heeg et al. (2007)) can form perovskites in thin-film form. In order to establish the trends of the dielectric properties for these materials, we calculated the dielectric tensors of LuScO3 and YScO3. The dielectric tensor of LuScO3 shows the continuation of the trend from LaScO3 to DyScO3. Both and components are slightly smaller than for DyScO3, their numerical values being 23.5 and 21.4 respectively. On the other hand, the component (44.8) is larger than for DyScO3 (32.6) and for LaScO3 (27.4). YScO3 has dielectric tensor components of 26.9, 23.0, and 37.7 for its , , and components, respectively.
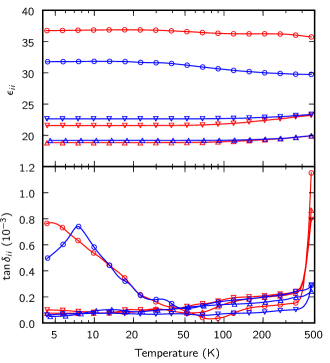
The experimentally measured dependence of the dielectric tensor (and loss) components on temperature is shown in Fig. 6 for two compounds, GdScO3 and DyScO3. In both cases we find that the dielectric tensor properties do not change significantly with temperature over the examined range (- K). The component slightly decreases with temperature while the and components show the opposite behavior. We expect that similar trends will be observed in all other rare-earth scandates.
As our calculated dielectric tensor is at 0 K and our measured dielectric tensor (Table 3 and 4) is at room temperature, the absence of a significant temperature dependence of the dielectric tensor is important to our ability to make a meaningful comparison between the calculated and measured coefficients.
Anomalies were observed in the dielectric loss along the axis () for both DyScO3 and GdScO3 below 50 K. The origin of these is unknown, but their presence suggests the possibility of a low-temperature phase transition.
III.3.2 Rare-earth yttrates
We now consider the rare-earth yttrates, i.e., AYO3 where A is one of the rare-earth atoms. These are similar to the rare-earth scandates, but with yttrium on the B site instead of scandium. Only one such compound, LaYO3, is known to form a perovskite,Berndt et al. (1975) but others might form in thin films via epitaxial stabilization. We find that LaYO3 has a larger component than does LaScO3. In LaYO3 the component of the dielectric tensor is 38.0, while in LaScO3 it is 27.4. On the other hand, the and components are almost unchanged with respect to LaScO3. In LaYO3 the component is 30.6 and the component is 25.7. We also find that heavier rare-earth atoms on the A-site tend to destabilize this structure even further. For example, we find that DyYO3 in the structure has an unstable mode at cm-1 that is IR-active along the direction.
III.3.3 CaZrO3, SrZrO3, and SrHfO3
According to our calculations, SrZrO3 and SrHfO3 show large and rather isotropic dielectric tensors. The average dielectric tensor is 40.9 and 32.8 in SrZrO3 and SrHfO3, respectively. Their - anisotropies have an opposite sign as compared to all of the other compounds we analyzed. Unfortunately, because of twinning (see section II.3.2), we could only measure an average dielectric constant for these systems, and therefore we could not directly compare our full calculated dielectric tensors with experiment. Still, if we make a comparison between theory and experiment for the average dielectric tensor , the agreement is reasonable.
Our calculations suggest that the CaZrO3 compound, on the other hand, has a very high value of the -anisotropy of 28.1. Its - anisotropy of 1.1, on the other hand, is quite small. The average dielectric tensor is the highest among the all compounds we considered, mostly because of the very large component of the dielectric tensor. Very similar results were also obtained in other theoretical studies. ben ; Bennett et al. (2008)
III.3.4 La2BB′O6 compounds
The La2BB′O6 systems show a small, non-zero off-diagonal component, 0.4 for La2MgZrO3 and 4 for La2CaZrO3. is allowed because the space group is reduced from orthorhombic () to monoclinic () for these compounds. Their isotropically-averaged dielectric tensors are larger for systems containing Ca than for those with Mg, and a bit larger for those with Zr than for those with Hf. Therefore, the dielectric response in this class of materials is largest for La2CaZrO6, with , and smallest for La2MgHfO6, with . All computed dielectric tensor components for these systems are given in Table 4.
III.3.5 Rare-earth rare-earth perovskites
The 11 rare-earth–rare-earth perovskites we considered show a bigger variation in the isotropically-averaged dielectric constant than do the rare-earth scandates (LaScO3 - DyScO3). The largest average dielectric constant among them is 32.9 in LaHoO3. The largest component of a dielectric tensor is also found in LaHoO3, whose is 41.7.
The measure of - anisotropy shows little variation among the components in this series. The anisotropy is of the same sign as in the rare-earth scandates.
Finally, the anisotropy once more shows a larger variation than in the rare-earth scandates. This anisotropy is largest for LaHoO3 and smallest for LaLuO3.
| Dielectric tensor | Reduced variables | Electronic part | Ionic part | ||||||||||
|---|---|---|---|---|---|---|---|---|---|---|---|---|---|
| LaScO3 | T | ||||||||||||
| PrScO3 | T | ||||||||||||
| E222This work. | |||||||||||||
| NdScO3 | T | ||||||||||||
| E222This work. | |||||||||||||
| SmScO3 | T | ||||||||||||
| E222This work. | |||||||||||||
| GdScO3 | T | ||||||||||||
| E222This work. | |||||||||||||
| TbScO3 | T | ||||||||||||
| DyScO3 | T | ||||||||||||
| O111Reference [Delugas et al., 2007]. | |||||||||||||
| E222This work. | |||||||||||||
| LaYO3 | T | ||||||||||||
| CaZrO3 | T | ||||||||||||
| E666Reference [Levin et al., 2003]. | |||||||||||||
| SrZrO3 | T | ||||||||||||
| O333Reference [Vali, 2008]. | |||||||||||||
| E222This work. | |||||||||||||
| SrHfO3 | T | ||||||||||||
| O444Reference [Vali, 2009]. | |||||||||||||
| E222This work. | |||||||||||||
| LaHoO3 | T | ||||||||||||
| LaErO3 | T | ||||||||||||
| LaTmO3 | T | ||||||||||||
| LaYbO3 | T | ||||||||||||
| LaLuO3555Experimental data in reference [hee, ]. | T | ||||||||||||
| CeTmO3 | T | ||||||||||||
| CeYbO3 | T | ||||||||||||
| CeLuO3 | T | ||||||||||||
| PrYbO3 | T | ||||||||||||
| PrLuO3 | T | ||||||||||||
| NdLuO3 | T | ||||||||||||
| Dielectric tensor | Electronic part | Ionic part | |||||||||||
|---|---|---|---|---|---|---|---|---|---|---|---|---|---|
| La2MgZrO6 | |||||||||||||
| La2MgHfO6 | |||||||||||||
| La2CaZrO6 | |||||||||||||
| La2CaHfO6 | |||||||||||||
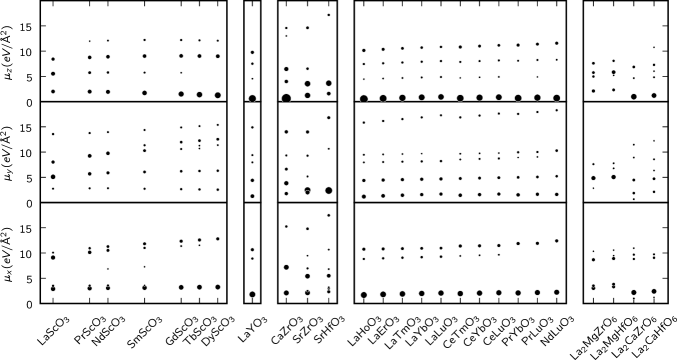
III.4 Decomposition of the ionic contribution to the dielectric tensor
As already mentioned, the ionic contribution to the dielectric tensor dominates in all of the systems we considered. The expression for the ionic contribution given in Eq. (4) provides a decomposition into contributions coming from eigenmodes of the force-constant matrix. The symmetry in perovskites, which is also approximately satisfied in La2BB′O6 compounds, allows a given eigenmode to contribute only to a single component (, , or ) of the dielectric tensor. This decomposition is given in Fig. 8 for all three components.
In rare-earth scandates, all three directions are evidently very different. The component is dominated by a low-lying mode whose contribution is almost constant along the series (it contributes to by 9.6 for LaScO3 and 11.1 for DyScO3). The component, on the other hand, has sizable contributions coming from several modes. Finally, the component comes mostly from a single low-lying mode. Unlike for the component, the contribution from the mode responsible for the component changes dramatically across the series, varying from 6.9 for LaScO3 to 16.3 for DyScO3. This explains the large value of the anisotropy in DyScO3 as compared to LaScO3 that is visible in Fig. 7.
A behavior similar to that of the rare-earth scandates is also observed in LaYO3 and in the rare-earth rare-earth perovskites. The SrZrO3 and SrHfO3 compounds show a quite similar behavior to each other. The component has contributions coming from many modes, the component is dominated by a single low-lying mode, and is dominated by two low-lying modes. On the other hand, component in CaZrO3 shows very large contribution coming from a single low-lying mode. Finally, we note that the La2BB′O6 compounds containing Ca have stronger contributions to and from low-lying modes than do those containing Mg.
III.5 Compounds with symmetry
At room temperature the ground state of BiFeO3 is ferroelectric with polar space group , the pattern of octahedral rotations being () in the Glazer notation. At higher temperature, however, BiFeO3 undergoes a phase transition in which the ferroelectricity and the () pattern of octahedral rotations disappear simultaneously.Arnold et al. (2009); Haumont et al. (2008) This observations led us to hypothesize that rotations of octahedra around the pseudocubic axis, as in the () pattern, tend to be energetically compatible with the presence of a ferroelectric distortion along the same axis. This would tend to suggest that perovskites that adopt the centrosymmetric group, which also exhibits the () pattern of oxygen octahedra, might be close to a ferroelectric instability leading to the lower-symmetry space group, and thus that such compounds might have an especially large component of the dielectric tensor along the pseudocubic axis.
To test this hypothesis, we have carried out a series of calculations on SrZrO3 and GdScO3 in which structural relaxation was allowed while maintaining the symmetry. In both compounds we find some IR-active phonon modes that either have very low or imaginary frequency, indicating a near or actual instability. In the case of SrZrO3 we find a mode that is active along the pseudocubic direction and has an extremely small frequency of only 6 cm-1, while for GdScO3 we find that the corresponding mode is unstable with an imaginary frequency of i142 cm-1. These calculations show that imposing the structure on SrZrO3 and GdScO3 make them nearly or actually ferroelectric, thus confirming our hypothesis.
Incidentally, the observation that SrZrO3 is more likely than GdScO3 to be stabilized in the structure is consistent with the fact that perovskite structures that prefer smaller rotation angles are more likely to form than structures, as discussed by Woodward Woodward (1997). We find that the rotational angles for SrZrO3 in the space group are and , while in GdScO3 they are substantially larger, and . More directly, we also find that the ground-state energy of SrZrO3 having the structure is only higher by 33.6 meV per formula unit than in the structure. On the other hand, in GdScO3 the is higher in energy by a much larger increment of 386 meV.
Finally, we note that LaAlO3, NdAlO3, and BaTbO3 may also be of interest, as these all have the space-group symmetry and should also be chemically stable on silicon.
III.6 Correlation between structural and dielectric properties
The heuristic observation about BiFeO3 mentioned in the previous section (Sec. III.5) led us to make a more detailed analysis of the correlation between structural and dielectric anisotropies in all five groups of perovskites. As can be seen from Fig. 3, the presence of the octahedral rotations breaks the symmetry among the three Cartesian directions in the perovskites. One would therefore naively expect that the anisotropy in the dielectric tensor component should also be correlated with the size of these rotation angles, but this is not what we observe. For example, LaScO3 and DyScO3 both have rather substantial octahedral rotation angles ( is 14.9∘ in LaScO3 and 19.7∘ in DyScO3), but they have very different values of the dielectric anisotropy ( is 1.0 in LaScO3 and 8.6 in DyScO3). An even more extreme behavior can be seen in the case of rare-earth perovskites between, e.g., LaHoO3 and LaLuO3.
Thus, we find no simple correlation between the dielectric tensor anisotropies and the values of the octahedral rotation angles. Instead, we find a correlation between the dielectric tensor anisotropies and the mismatch of the two rotation angles and , as we explain next.
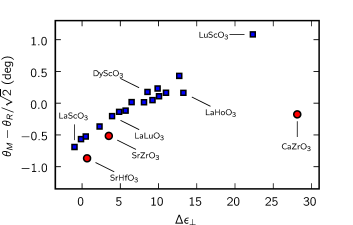
While the symmetry does not impose any relationship between the two octahedral rotation angles and , we find in practice that all the compounds we studied obey the heuristic relationship . This means that the oxygen octahedra are rotated about the three Cartesian axes by almost the same rotation angle, or equivalently, that the rotation axis is nearly . In the Glazer language, these perovskites having () rotations can be said to be very close to an () pattern. We can measure the mismatch between the actual () and the hypothetical () rotation pattern by the quantity , and it is this quantity that we find to be strongly correlated with the dielectric anisotropy .
This is shown in Fig. 9, where is plotted versus for all of the compounds considered in this work. It is apparent that the III-III–valent perovskites have a different behavior than the II-IV–valent ones. Nevertheless, we conclude that in both cases there is a strong correlation between the mismatch angle and the dielectric tensor anisotropy. The sign of the correlation is such that a deviation from the () pattern having an increased rotation angle around the axis gives a larger dielectric tensor component along the axis, and thus a larger anisotropy .
III.7 Antisite substitutions
Experimentally the compositions of the perovskites that we have been describing up to now by their nominal compositions, e.g., LaLuO3, are in fact slightly different from the compositions of the single crystals on which the dielectric tensors were measured. This is because our crystals are grown at the congruently melting compositions, e.g., La0.94Lu1.06O3, which differ from the nominal compositions described up to now. The congruently melting compositions of all relevant perovskites studied have been found to be poor in the A-site cation and rich in the B-site cation composition. Berkstresser et al. (1993); Ovanesyan et al. (1999); Gesing et al. (2009)
For this reason, we decided to carry out a theoretical analysis of the effects of B atoms substituting at the A site on the structural and dielectric properties of the material. Detailed calculations were done only for the case of LaLuO3, but we expect that similar trends will be observed in the remaining rare-earth rare-earth perovskites as well as in the rare-earth scandates and yttrates. Of course, other kinds of compositional disorder might also be present, but such possibilities are not analyzed here.
III.7.1 Analysis of antisite defects in LaLuO3
We studied LuLa antisite defects in LaLuO3 using a supercell approach. Specifically, in order to model a situation in which one of every 16 La atoms is substituted by Lu, which is about a 6% substitution, we constructed an 80-atom supercell containing a single antisite defect. The supercell is enlarged with respect to the primitive 20-atom primitive cell by doubling along both the orthorhombic and lattice vectors. The resulting stoichiometry is
The presence of the LuLa antisite in this particular 80-atom supercell reduces the crystal symmetry from orthorhombic to monoclinic . After full relaxation of the crystal structure in this space group, we find that the , , and lattice vectors are reduced by 0.3%, 0.2% ,and 0.1%, respectively, while the monoclinic angle between and lattice vectors of deviates only very slightly from .
The influence of the LuLa substitution on the dielectric properties is more complex. Evaluated in the same coordinate frame as in the unit cell, the and dielectric tensor components remain almost unchanged, and the new component allowed by the monoclinic symmetry is quite small, only . On the other hand, the component is drastically altered by the presence of Lu atom on the La site. In fact, we find that the 80-atom supercell is actually just barely unstable in the space group, as indicated by the presence of a phonon mode with a very small imaginary frequency of cm-1. spo The contribution of this phonon mode to the component (evaluated in the unstable structure) is therefore negative, specifically, . Since this phonon frequency is so close to zero, we expect that it would get renormalized to positive frequency at room temperature. For this reason, we did not follow the structural relaxation of our 80-atom supercell along the direction of the unstable mode, and a realistic estimate of the dielectric response of the system is difficult. Nevertheless, we conclude that LuLa substitutions in LaLuO3 have the potential to increase the dielectric tensor component substantially.
III.7.2 Discussion
As can be clearly seen in Fig. 7, our calculated anisotropy () is consistently larger than the measured one for all the rare-earth scandates for which we have experimental measurements. In view of the calculations reported for LaLuO3 above, we tentatively attribute this discrepancy to the generic tendency of B atoms to substitute on the A site in these compounds. This observation is consistent with the fact that smaller B ions that substitute for larger A ions will reside in a relatively larger cage, providing room to rattle and thereby contribute to an enhanced dielectric response.
IV Summary
The main focus of this work has been the application of both computational and experimental methods to study the structural and dielectric properties of various perovskites that have potentially large dielectric tensor components and are chemically stable on silicon up to 1000 ∘C. Schlom et al. (2005) Such compounds might be good candidates for future use as high-K dielectrics in microelectronics applications, e.g., as a possible replacement of hafnia-based high-K dielectrics currently used in the CMOS transistors in integrated circuits.
Of the compounds we have considered, CaZrO3, SrZrO3, LaHoO3, and LaYO3 appear to be especially promising. CaZrO3 has the largest calculated average dielectric tensor () among the compounds we considered, and SrZrO3 is a close second with . The dielectric tensor in CaZrO3 is very anisotropic, with its component almost twice as large as or , while on the other hand SrZrO3 has an almost isotropic dielectric tensor. Unfortunately, the full dielectric tensors of these compounds have not yet been measured due to lack of single crystals.
Of the rare-earth rare-earth perovskites, only LaLuO3 has had its dielectric tensor measured to date. Our results on this compound will be presented in detail elsewhere. hee The theoretical calculations, however, indicate that other compounds in this series should have even larger dielectric tensor components, with LaHoO3, having , being the most promising among these. LaYO3 is expected to behave very similar to LaHoO3 since Y and Ho have almost the same ionic radii, so it may be promising as well (). Thus, this series of compounds clearly deserves additional scrutiny.
Of course, there are good reasons for preferring amorphous over single-crystalline materials for such high-K applications. Certainly the ability of amorphous SiO2 to conform to the substrate and to eliminate electrical traps played a central role in its dominance as the gate dielectric of choice for 40 years for silicon-based metal-oxide-semiconductor field-effect transistors. The present hafnia-based high-K dielectrics are amorphous or nanocrystalline. mul For this reason, any eventual application of these materials for high-K applications would presumably require the adoption of one of two strategies. The first is the possibility of growing crystalline epitaxial oxides directly on silicon, which clearly would require a very high level of control of interface chemistry and morphology before it could become a practical solution. The second is the possibility that some of the compounds investigated here could be synthesized in amorphous or nanocrystalline form. We have not investigated these issues here, nor have we tried to calculate what (possibly very substantial) changes in the dielectric properties would occur in the amorphous counterparts, as this would take us far beyond the scope of the present study. Nevertheless, these are important questions for future investigations.
Acknowledgements.
The work of S. C. and D. V. was supported in part by NSF Grant DMR-0545198. The work of T.H. was supported by the Pennsylvania State University Materials Research Institute Nanofabrication Lab, the National Science Foundation Cooperative Agreement No. 0335765 and National Nanotechnology Infrastructure Network, with Cornell University. S. T. M. acknowledge support from NSF DMR-0602770. The research conducted by M. D. B. at the Center for Nanophase Materials Sciences, is sponsored at Oak Ridge National Laboratory by the Division of Scientific User Facilities, U.S. Department of Energy. D. G. S. would like to acknowledge support from the Semiconductor Research Corporation and Intel.References
- Moore (2003) G. Moore, in 2003 IEEE International Solid-State Circuits Conference. (Piscataway, NJ, USA, 2003), vol. 1, pp. 20–23.
- Schlom et al. (2005) D. G. Schlom, C. A. Billman, J. H. Haeni, J. Lettieri, P. H. Tan, R. R. M. Held, S. Völk, and K. J. Hubbard, in Thin Films and Heterostructures for Oxide Electronics, edited by S. B. Ogale (Springer, 2005), pp. 31–78.
- Schlom et al. (2008) D. G. Schlom, S. Guha, and S. Datta, Mater. Res. Bull. 33, 1017 (2008).
- Robertson (2008) J. Robertson, J. Appl. Phys. 104, 124111 (2008).
- Mistry et al. (2007) K. Mistry, C. Allen, C. Auth, B. Beattie, D. Bergstrom, M. Bost, M. Brazier, M. Buehler, A. Cappellani, R. Chau, et al., in Electron Devices Meeting, 2007. IEDM 2007. IEEE International (2007), pp. 247–250.
- Hicks et al. (2008) J. Hicks, D. Bergstrom, M. Hattendorf, J. Jopling, J. Maiz, S. Pae, C. Prasad, and J. Wiedemer, Intel Technol. J. 12, 131 (2008).
- Scansen (21 Jan. 2008) D. Scansen, Under the hood: 45 nm: What intel didn’t tell you (21 Jan. 2008), www.techonline.com/product/underthehood/205918004.
- Guha and Narayanan (2007) S. Guha and V. Narayanan, Phys. Rev. Lett. 98, 196101 (2007).
- Christen et al. (2006) H. M. Christen, J. G. E. Jellison, I. Ohkubo, S. Huang, M. E. Reeves, E. Cicerrella, J. L. Freeouf, Y. Jia, and D. G. Schlom, Appl. Phys. Lett. 88, 262906 (2006).
- Afanas’ev et al. (2004) V. V. Afanas’ev, A. Stesmans, C. Zhao, M. Caymax, T. Heeg, J. Schubert, Y. Jia, D. G. Schlom, and G. Lucovsky, Appl. Phys. Lett. 85, 5917 (2004).
- Zhao et al. (2005) C. Zhao, T. Witters, B. Brijs, H. Bender, O. Richard, M. Caymax, T. Heeg, J. Schubert, V. V. Afanas’ev, A. Stesmans, et al., Appl. Phys. Lett. 86, 132903 (2005).
- Heeg et al. (2006) T. Heeg, J. Schubert, C. Buchal, E. Cicerrella, J. Freeouf, W. Tian, Y. Jia, and D. Schlom, Appl. Phys. A 83, 103 (2006).
- Edge et al. (2006a) L. Edge, D. Schlom, S. Stemmer, G. Lucovsky, and J. Luning, Radiat. Phys. Chem. 75, 1608 (2006a).
- Cicerrella et al. (2005) E. Cicerrella, J. L. Freeouf, L. F. Edge, D. G. Schlom, T. Heeg, J. Schubert, and S. A. Chambers, J. Vac. Sci. Technol., A 23, 1676 (2005).
- Afanas’ev et al. (2006) V. V. Afanas’ev, A. Stesmans, L. F. Edge, D. G. Schlom, T. Heeg, and J. Schubert, Appl. Phys. Lett. 88, 032104 (2006).
- Edge et al. (2006b) L. F. Edge, D. G. Schlom, S. Rivillon, Y. J. Chabal, M. P. Agustin, S. Stemmer, T. Lee, M. J. Kim, H. S. Craft, J.-P. Maria, et al., Appl. Phys. Lett. 89, 062902 (2006b).
- Sivasubramani et al. (2006) P. Sivasubramani, T. H. Lee, M. J. Kim, J. Kim, B. E. Gnade, R. M. Wallace, L. F. Edge, D. G. Schlom, F. A. Stevie, R. Garcia, et al., Appl. Phys. Lett. 89, 242907 (2006).
- Lopes et al. (2007) J. Lopes, M. Roeckerath, T. Heeg, U. Littmark, J. Schubert, S. Mantl, Y. Jia, and D. Schlom, Microelectron. Eng. 84, 1890 (2007).
- Wang et al. (2007) M. Wang, W. He, T. P. Ma, L. F. Edge, and D. G. Schlom, Appl. Phys. Lett. 90, 053502 (2007).
- Edge et al. (2008) L. Edge, W. Tian, V. Vaithyanathan, T. Heeg, D. Schlom, D. Klenov, S. Stemmer, J. Wang, and M. Kim, in ECS Trans. (Honolulu, HI, United states, 2008), vol. 16, pp. 213 – 227.
- Özben et al. (2008) E. D. Özben, J. M. J. Lopes, M. Roeckerath, S. Lenk, B. Holländer, Y. Jia, D. G. Schlom, J. Schubert, and S. Mantl, Appl. Phys. Lett. 93, 052902 (2008).
- Roeckerath et al. (2009) M. Roeckerath, J. Lopes, E. Durgun Ozben, C. Sandow, S. Lenk, T. Heeg, J. Schubert, and S. Mantl, Appl. Phys. A 94, 521 (2009).
- Wagner et al. (2006) M. Wagner, T. Heeg, J. Schubert, C. Zhao, O. Richard, M. Caymax, V. Afanas’ev, and S. Mantl, Solid-State Electron. 50, 58 (2006).
- Myllymaki et al. (Sept. 2007) P. Myllymaki, M. Roeckerath, M. Putkonen, S. Lenk, J. Schubert, L. Niinisto, and S. Mantl, Appl. Phys. A A88, 633 (Sept. 2007).
- Kim et al. (2006) K. H. Kim, D. B. Farmer, J.-S. M. Lehn, P. V. Rao, and R. G. Gordon, Appl. Phys. Lett. 89, 133512 (2006).
- Thomas et al. (2007) R. Thomas, P. Ehrhart, M. Roeckerath, S. van Elshocht, E. Rije, M. Luysberg, M. Boese, J. Schubert, M. Caymax, and R. Waser, J. Electrochem. Soc. 154, 147 (2007).
- Heeg et al. (2007) T. Heeg, M. Roeckerath, J. Schubert, W. Zander, C. Buchal, H. Y. Chen, C. L. Jia, Y. Jia, C. Adamo, and D. G. Schlom, Appl. Phys. Lett. 90, 192901 (2007).
- Wersing (1996) W. Wersing, Curr. Opin. Solid State Mater. Sci. 1, 715 (1996).
- Vanderah (2002) T. A. Vanderah, Science 298, 1182 (2002).
- Delugas et al. (2007) P. Delugas, V. Fiorentini, A. Filippetti, and G. Pourtois, Phys. Rev. B 75, 115126 (2007).
- Vali (2008) R. Vali, Solid State Commun. 145, 497 (2008).
- Vali (2009) R. Vali, Solid State Commun. 149, 519 (2009).
- (33) See www.physics.rutgers.edu/~sinisa/highk/supp.pdf or http://link.aps.org/supplemental/10.1103/PhysRevB.82.064101 for zone-center phonon frequencies, as well as the infrared activities for those modes that are infrared-active.
- Badie (1978) J. Badie, Rev. Int. Hautes Temp. Réfact., Fr 15, 183 (1978).
- Badie and Foex (1978) J. Badie and M. Foex, J. Solid State Chem. 26, 311 (1978).
- Coutures et al. (1980) J.-P. Coutures, J. Badie, R. Berjoan, J. Coutures, R. Flamand, and A. Rouanet, High Temp. Sci. 13, 331 (1980).
- (37) J. Schubert (private communication).
- Berndt et al. (1975) U. Berndt, D. Maier, and C. Keller, J. Solid State Chem. 13, 131 (1975).
- Rabenau (1956) A. Rabenau, Z. Anorg. Allg. Chem. 288, 221 (1956).
- Ito et al. (2001) K. Ito, K. Tezuka, and Y. Hinatsu, J. Solid State Chem. 157, 173 (2001).
- Bharathy et al. (2009) M. Bharathy, A. Fox, S. Mugavero, and H.-C. zur Loye, Solid State Sci. 11, 651 (2009).
- (42) T. Heeg, K. Wiedenmann, M. Roeckerath, S. Coh, D. Vanderbilt, J. Schubert and D. G. Schlom, unpublished.
- Goldschmidt (1926) V. Goldschmidt, Naturwissenschaften 21, 477 (1926).
- Woodward (1997) P. M. Woodward, Acta Crystallogr. Sect. B 53, 32 (1997).
- Glazer (1972) A. M. Glazer, Acta Crystallogr. Sect. B 28, 3384 (1972).
- Giannozzi et al. (2009) P. Giannozzi, S. Baroni, N. Bonini, M. Calandra, R. Car, C. Cavazzoni, D. Ceresoli, G. L. Chiarotti, M. Cococcioni, I. Dabo, et al., Journal of Physics: Condensed Matter 21, 395502 (19pp) (2009), URL http://www.quantum-espresso.org.
- Perdew et al. (1996) J. P. Perdew, K. Burke, and M. Ernzerhof, Phys. Rev. Lett. 77, 3865 (1996).
- Vanderbilt (1985) D. Vanderbilt, Phys. Rev. B 32, 8412 (1985).
- Monkhorst and Pack (1976) H. J. Monkhorst and J. D. Pack, Phys. Rev. B 13, 5188 (1976).
- Staroverov et al. (2004) V. N. Staroverov, G. E. Scuseria, J. Tao, and J. P. Perdew, Phys. Rev. B 69, 075102 (2004).
- Pies and Weiss (2006) W. Pies and A. Weiss, Landolt-Börnstein - Group III Condensed Matter (Springer-Verlag, 2006), vol. 7c1, chap. VI.1.5.1, pp. 14–34.
- (52) In the case of GdN the anomaly is more likely the result of the large spin splitting and strong ferromagnetism associated with the huge magnetic moment of the configuration.
- Baroni et al. (2001) S. Baroni, S. de Gironcoli, A. Dal Corso, and P. Giannozzi, Rev. Mod. Phys. 73, 515 (2001).
- Cockayne and Burton (2000) E. Cockayne and B. P. Burton, Phys. Rev. B 62, 3735 (2000).
- Uecker et al. (2006) R. Uecker, H. Wilke, D. Schlom, B. Velickov, P. Reiche, A. Polity, M. Bernhagen, and M. Rossberg, J. Cryst. Growth 295, 84 (2006).
- Uecker et al. (2008) R. Uecker, B. Velickov, D. Klimm, R. Bertram, M. Bernhagen, M. Rabe, M. Albrecht, R. Fornari, and D. Schlom, J. Cryst. Growth 310, 2649 (2008).
- (57) The SrZrO3, SrHfO3, and LaScO3 single crystals were grown by float-zone by Dima Souptel and Anatoly Balbashov of the Moscow Power Engineering Institute, Moscow, Russia. For details on the growth parameters see D. Souptel, G. Behr, and A.M. Balbashov, J. Cryst. Growth 236, 583 (2002).
- Newnham (2005) R. Newnham, Properties of Materials: Anisotropy, Symmetry, Structure (Oxford University Press, Oxford, 2005).
- Gesing et al. (2009) T. M. Gesing, R. Uecker, and J.-C. Buhl, Z. Kristallogr. NCS 224, 365 (2009).
- Anderson et al. (1993) M. T. Anderson, K. B. Greenwood, G. A. Taylor, and K. R. Poeppelmeier, Prog. Sol. St. Chem. 22, 197 (1993).
- Liferovich and Mitchell (2004) R. P. Liferovich and R. H. Mitchell, J. Phys. Chem. Solids 177, 2188 (2004).
- Velickov et al. (2007) B. Velickov, V. Kahlenberg, R. Bertram, and M. Bernhagen, Z. Kristallogr. 9, 466 (2007).
- Kennedy et al. (1999a) B. J. Kennedy, C. J. Howard, and B. C. Chakoumakos, Phys. Rev. B 59, 4023 (1999a).
- Kennedy et al. (1999b) B. J. Kennedy, C. J. Howard, and B. C. Chakoumakos, Phys. Rev. B 60, 2972 (1999b).
- Velickov et al. (2008) B. Velickov, V. Kahlenberg, R. Bertram, and R. Uecker, Acta Crystallogr. Sect. E 64, i79 (2008).
- Ruiz-Trejo et al. (1999) E. Ruiz-Trejo, M. S. Islam, and J. A. Kilner, Solid State Ionics 123, 121 (1999).
- Levin et al. (2003) I. Levin, T. G. Amos, S. M. Bell, L. Farber, T. A. Vanderah, R. S. Roth, and B. H. Toby, J. Solid State Chem. 175, 170 (2003), ISSN 0022-4596.
- (68) J. W. Bennett, private communication.
- Bennett et al. (2008) J. W. Bennett, I. Grinberg, and A. M. Rappe, Chem. Mater 20, 5134 (2008).
- Arnold et al. (2009) D. C. Arnold, K. S. Knight, F. D. Morrison, and P. Lightfoot, Phys. Rev. Lett. 102, 027602 (2009).
- Haumont et al. (2008) R. Haumont, I. A. Kornev, S. Lisenkov, L. Bellaiche, J. Kreisel, and B. Dkhil, Phys. Rev. B 78, 134108 (2008).
- Berkstresser et al. (1993) G. W. Berkstresser, A. J. Valentino, and C. D. Brandle, J. Cryst. Growth 128, 684 (1993).
- Ovanesyan et al. (1999) K. L. Ovanesyan, A. Petrosyan, G. O. Shirinyan, C. Pedrini, and L. Zhang, J. Cryst. Growth 198, 497 (1999).
- (74) The eigendisplacement of this unstable mode is very close to that of the -point phonon of the 20-atom structure having a frequency of 39 cm-1. However, this phonon remains inactive in the structure because it does not appear at the point.
- (75) D. A. Muller, private communication.