The youngest massive protostars in the Large Magellanic Cloud††thanks: Herschel is an ESA space observatory with science instruments provided by European-led Principal Investigator consortia and with important participation from NASA.
We demonstrate the unique capabilities of Herschel to study very young luminous extragalactic young stellar objects (YSOs) by analyzing a central strip of the Large Magellanic Cloud obtained through the HERITAGE Science Demonstration Program. We combine PACS 100 and 160, and SPIRE 250, 350, and 500 m photometry with 2MASS (1.25-2.17 m) and Spitzer IRAC and MIPS (3.6-70 m) to construct complete spectral energy distributions (SEDs) of compact sources. From these, we identify 207 candidate embedded YSOs in the observed region, 40% never-before identified. We discuss their position in far-infrared color-magnitude space, comparing with previously studied, spectroscopically confirmed YSOs and maser emission. All have red colors indicating massive cool envelopes and great youth. We analyze four example YSOs, determining their physical properties by fitting their SEDs with radiative transfer models. Fitting full SEDs including the Herschel data requires us to increase the size and mass of envelopes included in the models. This implies higher accretion rates (10-4M⊙yr-1), in agreement with previous outflow studies of high-mass protostars. Our results show that Herschel provides reliable longwave SEDs of large samples of high-mass YSOs; discovers the youngest YSOs whose SEDs peak in Herschel bands; and constrains the physical properties and evolutionary stages of YSOs more precisely than was previously possible.
Key Words.:
Stars: formation – Stars: protostars – Galaxies: Magellanic Clouds1 Introduction
The proximity of the Magellanic Clouds offers a unique opportunity to analyze the complete inventory of luminous YSOs over an entire galaxy. With known YSO distances, luminosities, masses, and mass accretion rates can all be well-defined. Comparison of the properties of YSOs in the Magellanic Clouds and in the Milky Way can reveal differences in star formation physics due to metallicity and environment.
Using the Spitzer SAGE (“Surveying the Agents of Galaxy Evolution”) Survey of the Large Magellanic Cloud (LMC; Meixner et al. 2006), Whitney et al. (2008; W08) and Gruendl & Chu (2009; GC09) discovered 1800 massive YSO candidates in the LMC (a 90-fold increase over previous work). Spitzer studies selected sources using colors and SEDs at wavelengths 24m (where Spitzer can resolve individual YSOs), requiring a detection at 4.5m or shorter in most cases. These surveys thus missed the youngest, most embedded YSOs that can only be detected at longer wavelengths.
The Herschel Space Observatory (Pilbratt et al. 2010) has the spatial resolution required to study individual sources at 50 m (from 1.3 pc at 70 m to 8.7 pc at 500 m for a distance of 50 kpc, Schaefer 2008). The least-evolved massive protostars are characterized by cold dust temperatures probed at far-infrared (far-IR) wavelengths, and are expected to be 103 times brighter at 100 m than at 5 m (Whitney et al. 2004; Molinari et al. 2008), making Herschel extremely effective at detecting those youngest YSOs.
With Herschel, we not only discover new objects but also better characterize Spitzer-identified YSO candidates. The Herschel data constrain the models of these sources and improve estimates of such physical parameters as total luminosity, stellar mass, and total dust mass. We demonstrate these capabilities by studying a strip across the LMC observed as part of the Science Demonstration Program (SDP) – the first part of the Herschel Key Program “HERschel Inventory of the Agents of Galaxy Evolution” (HERITAGE; Meixner et al. 2010) in the Magellanic Clouds. The strip was mapped in the PACS 100 and 160m bands (Poglitsch et al. 2010) and SPIRE 250, 350, and 500m bands (Griffin et al. 2010).
2 Source selection and photometry
An initial list of 640 sources was compiled by hand, choosing apparent point sources in Herschel images. Astrometry was refined using the SAGE-LMC MIPS 24m image. We performed aperture photometry on 2MASS, Spitzer, and Herschel images using apertures scaled to the instrumental resolution: 4′′ radius for 2MASS, 3′′ for IRAC, 6′′ and 12′′ for MIPS 24 and 70 m, 8′′ and 12′′ for PACS 100 and 160, and 13′′, 17′′, and 23′′ for SPIRE 250, 350, and 500, respectively. The aperture size relative to PSF was chosen after examination of the multi-wavelength images, to most consistently measure a single YSO as distinct from its environment. Aperture corrections are 1.4, 1.5, 1.7, and 1.7 for IRAC, 1.8 for MIPS, 1.4 for PACS, and 1.3, 1.25, and 1.2 for SPIRE, which not only account for the portion of the PSF extending outside the aperture, but also flux contamination from the low-level PSF wing in the background annulus. Background emission was calculated as the sigma-clipped mean of an annulus spanning 1.75 to 2 times the source radius. Flux uncertainties were increased where large gradients existed across the background annulus and in regions of crowding and confusion. Photometry was verified quantitatively through comparison to SAGE PSF-fit photometry and by manually measuring 20 sources (including those whose SEDs are highlighted below). No significant systematic offsets were found, and random offsets are consistent with the quoted uncertainties. We find that in these early data we can reliably extract point sources as faint as (200,300,150,70,40) mJy at (100,160,250,350,500) m. Greater integration time and improved artifact mitigation will result in fainter values for the complete HERITAGE survey. The uncertainty in the absolute flux calibration is 20% for PACS (Poglitsch et al. 2010) and 15% for SPIRE (Swinyard et al. 2010).
We selected a subset of reliable Herschel sources, most likely YSO candidates, from the more complete source list using the following criteria. We carefully examined the environment of all candidates at all wavelengths, simultaneously with their SEDs, aperture photometry, and existing W08 and GC09 catalog photometry. Sources were removed that could not be unambiguously identified in images over a wide wavelength range due to multiplicity or complex diffuse emission. We also required reliable photometry spanning at least 5.8–100 m. This examination is subjective but consistent with the goals of assessing how Herschel changes our understanding of star formation. Analysis with quantitative completeness limits will be performed when the higher quality HERITAGE survey data are available.
We removed known non-YSOs from our list. At Herschel wavelengths, background galaxies are the main contaminant as their far-IR emission arises from star-forming regions. We excluded 2 AGN candidates from Kozłowski & Kochanek (2009), as well as 7 probable galaxies based on spatial morphology in high resolution IRAC images. Evolved stellar envelopes lack cold dust, peak in the mid-IR, and are few among Herschel sources. We removed one from Boyer et al. (2010), leaving 207 sources in our very conservative list.
3 Far-IR photometric properties of LMC YSOs
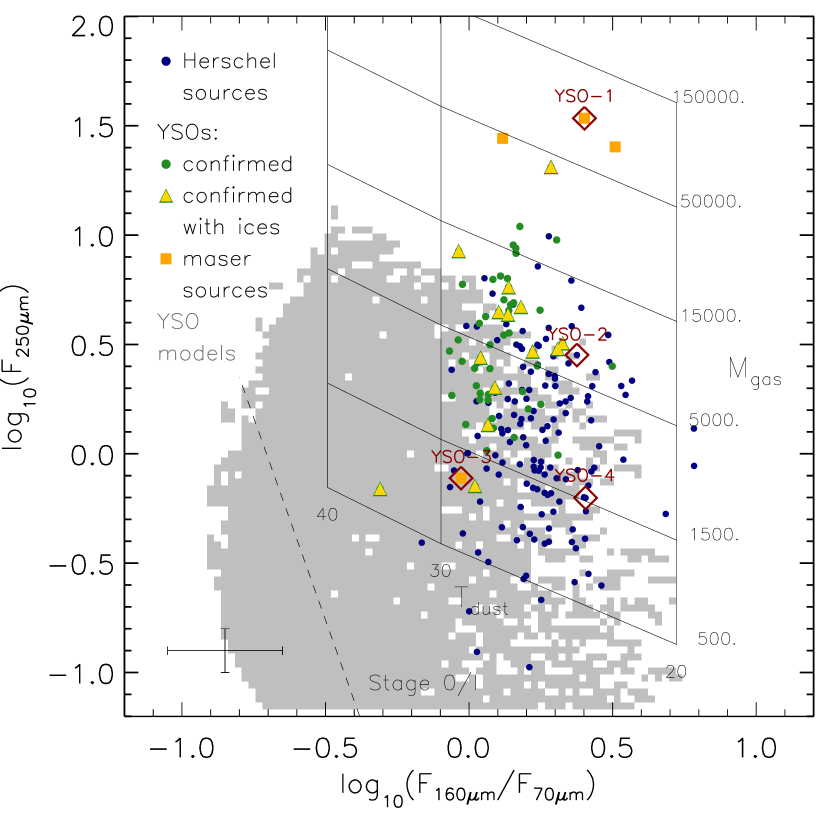
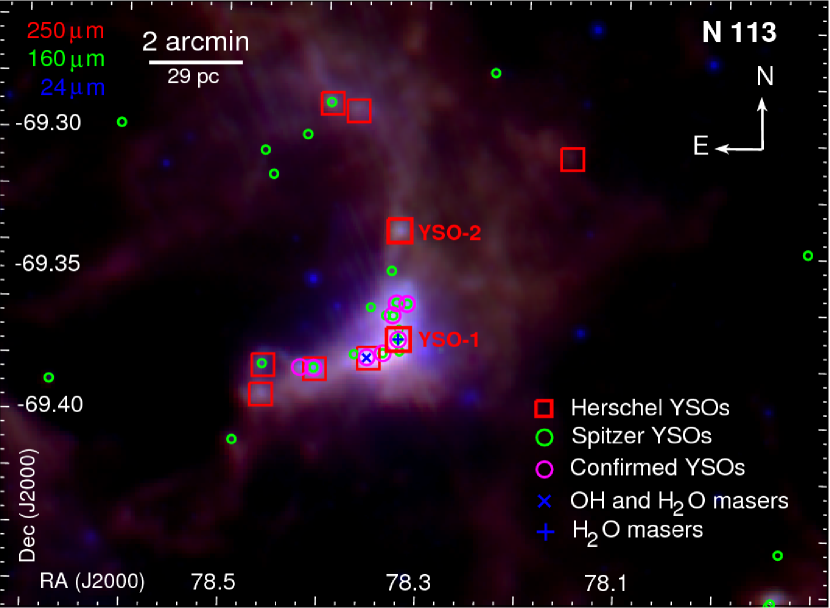
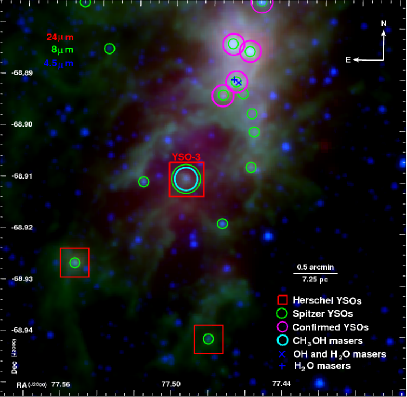
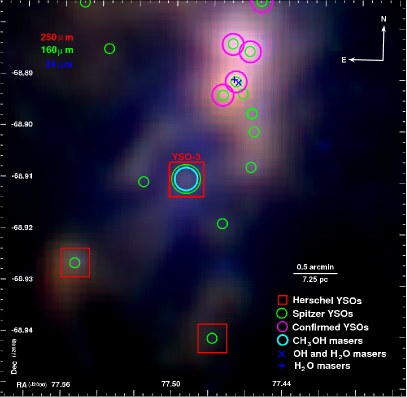
Figure 1 shows a color-magnitude diagram of our 207 YSO candidates, combining Spitzer (70 m) with Herschel (160 and 250 m) bands. Other color combinations show similar source distributions and lead to similar conclusions. YSO candidates selected based on photometric data alone require spectroscopic confirmation. The presence of ice absorption is quite definitive; silicate absorption and aromatic emission are at least strongly suggestive (in the parsec-sized beam). To date, 300 sources in the LMC have been spectroscopically confirmed or supported (Shimonishi et al. 2008; Oliveira et al. 2009; Seale et al. 2009; van Loon et al. 2010). Of these, 126 lie in the HERITAGE SDP area; our list includes 58 (the remainder are too faint or or too confused). We label these as “confirmed YSOs.” Photometric YSO candidates may also be “confirmed” through maser identification. In the HERITAGE SDP area, maser emission has been detected in the N 113 (H2O and OH; Whiteoak & Gardner 1986; Lazendic et al. 2002; Oliveira et al. 2006; Brooks & Whiteoak 1997, see Fig. 2) and N 105 (H2O, OH and methanol; Sinclair et al. 1992; Lazendic et al. 2002; Oliveira et al. 2006) star formation regions. Each of these regions has two clumps of masers, and all four sites are associated with mid-IR sources identified as YSO candidates. Three of these sources have been spectroscopically observed (Seale et al. 2009).
We fit the SED of each source with a large grid of dust radiative transfer models of individual massive YSOs (Robitaille et al. 2006, 2007, hereafter R06, R07), constraining the circumstellar dust distribution and other physical parameters (Sect. 5). Comparison between observed far-IR fluxes and those predicted by the R06 YSO model grid confirms the youthful nature of these sources. All Herschel sources, and all models to the right (redward) of the dashed line in Fig. 1 are consistent with Stage 0/I , i.e. the circumstellar mass exceeds that of the central source. In fact, many measured fluxes are redder and brighter than the R06 grid. We model example sources in detail below, and in general this color difference is resolved by adding a larger outer envelope of cool dust.
We also estimate the mass of cool circumstellar dust using simple greybody emission from optically thin dust at a single temperature. A temperature – mass grid is overplotted on Fig. 1. We use the same opacity curve as the YSO radiative transfer models, i.e. the opacity power-law index is interstellar ( with 2) for wavelengths 20m (Whitney et al. 2003b).
4 Herschel view of YSOs and their environments
3
4
5

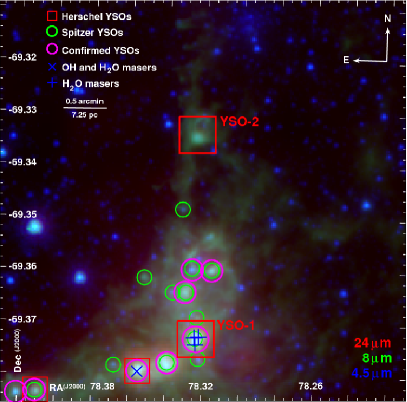
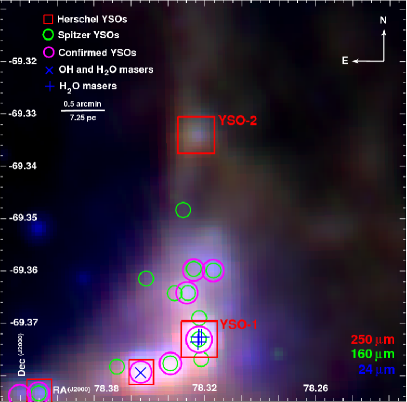
We highlight four YSOs, showing the different ways that Herschel can impact star formation studies (SEDs are modeled in Sect. 5). Two sources are in the N 113 H ii region, one of the brightest regions in the HERITAGE SDP strip. Figure 2 is a three-color composite image of N 113 combining SPIRE 250 m, PACS 160 m, and MIPS 24 m images. We detect 9 reliable Herschel sources in N 113, including 4 not previously identified as YSO candidates. N 113 presents a clear example of star formation triggered by the winds from massive stars (Oliveira et al. 2006). Current star formation activity is concentrated in the central lane of remnant molecular gas and dust, compressed by a complex structure of ionized gas bubbles, created by massive stars in several young clusters ( Myr). Ongoing star formation in the lane is pinpointed in its earliest stages by maser emission and by continuum emission as massive YSOs evolve (Brooks & Whiteoak 1997; Wong et al. 2006). Two bright Herschel sources associated with masers and a third, fainter source between them are all confirmed YSOs. We model the full SED (1.25–500 m) of the westernmost of these (YSO-1), to show Herschel’s impact on parameters of a known YSO. We also model a newly identified Herschel source YSO-2 that lies in a filament 4′ to the north (Fig. 3, online only).
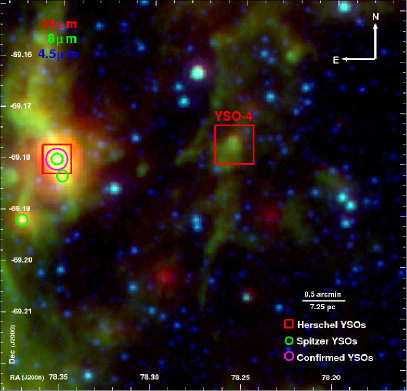
We present detailed analysis of two other sources, YSO-3 and YSO-4. YSO-3, which appears to lie in a dense knot at the rim of a cavity in the molecular cloud of N 105, is associated with 6.67 GHz and 12.2 GHz methanol maser emission (Fig. 4, online only; Sinclair et al. 1992; Ellingsen et al. 2010). Methanol masers are closely associated with the earliest stages of massive star formation and are powerful probes of young massive stars and protostars. We expect the SED shape of YSO-3 to be representative of SEDs of the youngest sources. YSO-4 is a new Herschel YSO candidate. It lies approximately 2 from the nearest Spitzer YSO candidates on the edge of an evacuated supershell in the LMC bar. The source is very faint shortward of IRAC 5.8 m and then brightens in a “pillar of creation” morphology, indicative of a highly embedded YSO (Fig. 5, online only).
5 Modeled physical properties
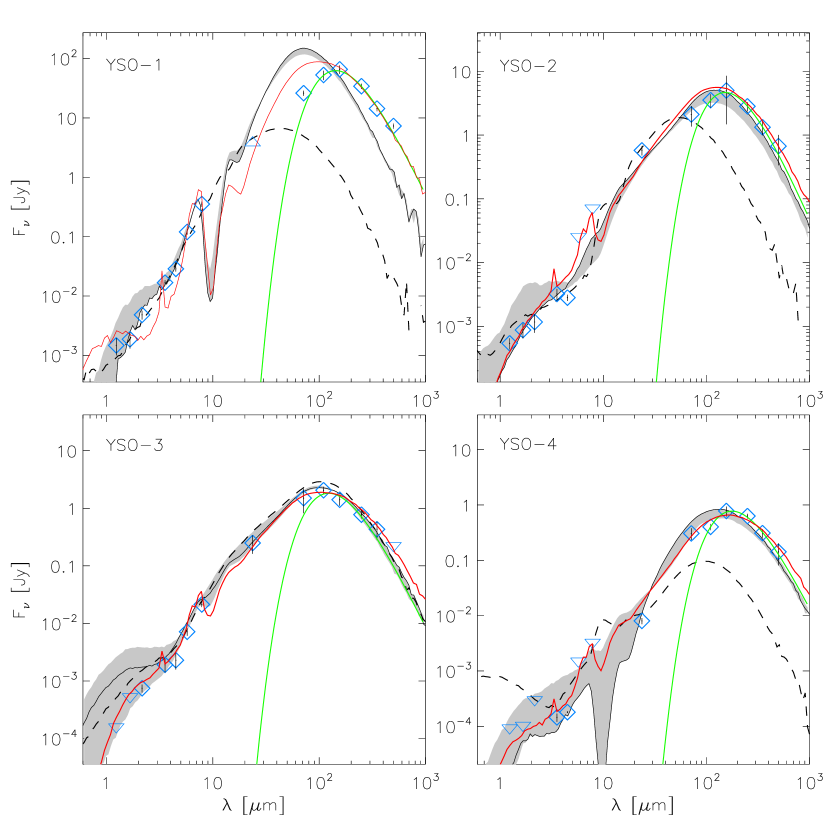
Far-IR measurements are critical for deriving the total mass of circum(proto)stellar dust associated with a YSO, and inferring its evolutionary state. Figure 6 shows typical sources that illustrate our key findings (photometric data are listed in Table 1, online only). We fit each source with the R06 YSO model grid, first using only pre-Herschel photometry ( 50 m), and again using all data ( 500 m). Physical parameters derived from these fits are listed in Table 2. The addition of Herschel data provides a much tighter constraint on SED fits, and the range of well-fit models and uncertainties of derived parameters (as listed in the table) are thus significantly reduced.
1
| Source | RAa𝑎aa𝑎aPositions are determined from the highest-resolution images available (IRAC); few-arcsecond offsets present in this early Herschel data especially at PACS100 are accounted for in the photometry. | Dec | Fluxes in mJy | Spitzer ID (Ref.) | |||||||||||||
|---|---|---|---|---|---|---|---|---|---|---|---|---|---|---|---|---|---|
| (h m s) | (∘ ′ ′′) | Names | |||||||||||||||
| YSO-1 | 05:13:17.69 | -69:22:25.0 | 1.5(0.5) | 1.9(0.6) | 4.8(0.8) | 17(2) | 29(3) | 120(12) | 354(35) | 3400 | 26000(2600) | 53000(9600) | 66000(11000) | 34000(3400) | 14000(1400) | 7300(730) | 051317.69-692225.0 (1,2) |
| YSO-2 | 05:13:17.99 | -69:20:04.9 | 0.5(0.1) | 0.9(0.2) | 1.2(0.4) | 3.2(0.7) | 2.8(0.3) | 24 | 68 | 580(96) | 2100(750) | 3500(850) | 5000(3500) | 2800(460) | 1300(330) | 670(340) | … |
| YSO-3 | 05:09:58.52 | -68:54:35.5 | 0.2 | 0.5 | 0.8(0.1) | 1.9(0.5) | 2.3(0.7) | 7(1) | 21(2) | 250(88) | 1500(680) | 2100(300) | 1400(300) | 770(110) | 430(150) | 210 | 050958.52-685435.5 (1) |
| YSO-4 | 05:13:01.55 | -69:10:34.8 | 0.1 | 0.1 | 0.3 | 0.14(0.03) | 0.18(0.01) | 1 | 3 | 8(1) | 310(73) | 400(51) | 780(160) | 630(63) | 310(55) | 140(61) | … |
Nearly all sources detected by Herschel are Stage 0/I, i.e., very young. A protostar’s evolutionary state is often quantified by the ratio of circumstellar to stellar mass. In our single-source YSO models, the accreting flattened envelope has an analytic mass distribution (derived by Terebey et al. 1984), and infall rates are proportional to envelope mass within an enclosed radius. One caveat is that we do not know if all mass enclosed by the Herschel beam will fall on to the central source, so the derived infall rates may be upper limits. We find that the accretion rate relative to the central mass, is a good measure of evolutionary state (e.g.,Whitney et al. 2003a; Indebetouw et al. 2007; R06; R07). Without Herschel data, of our sources is (2,5,1,4)10yr-1 for (YSO-1,YSO-2,YSO-3,YSO-4). When Herschel photometry is included, increases to (2,3,2,4)10yr-1. The higher infall rates are in agreement with previous outflow studies of massive protostars (Churchwell 1999). The implied ages of 104 yr further strengthen the assertion that Herschel probes the very youngest sources.
| log(Lbol) | log() | log(Mdisk) | M⋆ | |||
| Source | Model | (m) | (L⊙) | (Myr-1) | (M⊙) | (M⊙) |
| YSO-1 | R06 | 50 | 5.10.2 | -3.30.8 | -1.01.1 | 275 |
| R06 | 500 | 5.50.1 | -2.10.0 | -0.10.4 | 455 | |
| YSO-2 | R06 | 50 | 4.50.5 | -3.20.9 | -0.90.7 | 132 |
| R06 | 500 | 4.50.3 | -2.40.2 | -0.70.7 | 132 | |
| YSO-3 | R06 | 50 | 4.20.2 | -3.81.8 | -1.21.1 | 121 |
| R06 | 500 | 3.90.2 | -2.50.2 | -0.80.8 | 131 | |
| YSO-4 | R06 | 50 | 3.30.5 | -3.61.1 | -1.40.9 | 71 |
| R06 | 500 | 3.30.2 | -2.50.1 | -0.80.7 | 91 | |
| log(Lfar-IR) | Tdust | log(Mgas) | ||||
| Source | Model | (m) | (L⊙) | (K) | (M⊙) | |
| YSO-1 | greybody | 100 | 5.0 | 20 | 4.7 | |
| YSO-2 | greybody | 100 | 3.9 | 19 | 3.8 | |
| YSO-3 | greybody | 100 | 3.6 | 24 | 2.9 | |
| YSO-4 | greybody | 100 | 3.0 | 16 | 3.3 |
Observationally, the ratio of far-IR/submm luminosity to bolometric luminosity is often used as a proxy for the circumstellar to total mass ratio. Andre et al. (1993) define Class 0 as having Lλ>350μm/L510-3. We calculate a similarly simple evolutionary measure, fitting an optically thin greybody to the data 100 m, and find that it agrees reasonably with the YSO model fit results (Model “greybody” in Table 2 and green line in Fig. 6). Resultant dust mass and far-IR/submm luminosity depend on the dust opacity power-law index. We use = 2; a different choice does not change the conclusion that these sources are highly embedded. We find LL for our four examples, very high and consistent with the Andre et al. (1993) Class 0 definition. We also find T K, consistent with the far-IR colors (Fig. 1) and expectations for the least evolved YSOs.
Even the best-fitting R06 models (dashed line in Fig. 6) often fall well below the data at longer wavelengths (also apparent in Fig. 1). The R06 models were designed for analysis of Spitzer data at shorter wavelengths; models have outer envelope radius R pc, T K for luminous sources. The envelope of cooler dust and gas farther from the source emits little at 100 m but can contribute significantly in the Herschel bands.
We created new dust radiative transfer models (red line on Fig. 6) and find that implied accretion rate and other critical evolutionary parameters do not change significantly from the R06 best fits. The new models have larger envelope radii, heating by external radiation, and PAH emission. We used the R06 best-fit models as starting points. was varied between the R06 maximum of 0.5 pc and 5 pc, with best-fitting values of (3.4,1,1,1) pc. The importance of external heating was assessed by comparing models with none to models with a Mathis et al. (1983) diffuse interstellar radiation field extincted by AV=1. In all cases the latter improved the fits. Any increase in the outer envelope radius also increases dust absorption at short wavelengths, the effect of which was balanced by varying the density in the outflow cavity between 0.1 and 1 times the R06 best-fit value. Reduced values of (1,0.1,2,2)10-20g cm-3 provided the best fits to the data. The envelope infall rates and source luminosities remained the same, showing that the R06 grid can still be used to interpret the Herschel data points. Adding PAH emission to our models results in better fits to bands effected by aromatic emission (predominantly IRAC 5.8 and 8.0 m). Additional work must also be done to account for blending of multiple sources at Magellanic distances, as YSOs are frequently part of multiple systems and small unresolved clusters.
Optimal analysis of Magellanic YSOs observed by Herschel and Spitzer will benefit from improvements to the R06 model grid. However, it is the inclusion of Herschel data, even with the older models, that is most significant: If these 4 embedded YSOs are typical, as we expect, the statistics of YSO physical parameters in the Magellanic System will be significantly clarified.
6 Conclusions
We show that Herschel far-IR photometry is very effective in identifying YSOs in the LMC. Adding Herschel data to existing Spitzer and near-IR observations results in significantly improved analysis of YSOs, as summarized in these key findings:
-
Nearly all sources detected by Herschel are Stage 0/I, very young, with a high ratio of circumstellar to stellar mass.
-
Previously studied warm sources such as YSO-1 require more circumstellar dust to fit the Herschel data, implying a less evolved state than would be inferred from Spitzer data alone.
-
Herschel photometry significantly constrains our SED fits, decreasing the range of circumstellar dust masses and evolutionary states consistent with the measurements.
-
Many sources require even more cold circumstellar dust than is present in our original model grid, motivating improvements to our models.
Our observations prove that Herschel can offer us, for the first time, an inventory of the earliest
stages of protostellar formation throughout an entire galaxy.
Acknowledgements.
We acknowledge financial support from the NASA Herschel Science Center, JPL contracts # 1381522 & 1381650. We thank the contributions and support from the European Space Agency (ESA), the PACS and SPIRE teams, the Herschel Science Center and the NASA Herschel Science Center (esp. A. Barbar and K. Xu) and the PACS and SPIRE instrument control center at CEA-Saclay, without which none of this work would be possible.References
- Andre et al. (1993) Andre, P., Ward-Thompson, D., & Barsony, M. 1993, ApJ, 406, 122
- Boyer et al. (2010) Boyer et al. 2010, this volume
- Brooks & Whiteoak (1997) Brooks, K. J. & Whiteoak, J. B. 1997, MNRAS, 291, 395
- Churchwell (1999) Churchwell, E. 1999, in NATO ASIC Proc. 540: The Origin of Stars and Planetary Systems, ed. C. J. Lada & N. D. Kylafis, 515
- Ellingsen et al. (2010) Ellingsen, S. P., Breen, S. L., Caswell, J. L., Quinn, L. J., & Fuller, G. A. 2010, MNRAS, 429
- Green et al. (2008) Green, J. A., Caswell, J. L., Fuller, G. A., et al. 2008, MNRAS, 385, 948
- Griffin et al. (2010) Griffin et al. 2010, this volume
- Gruendl & Chu (2009) Gruendl, R. A. & Chu, Y. 2009, ApJS, 184, 172
- Indebetouw et al. (2007) Indebetouw, R., Robitaille, T. P., Whitney, B. A., et al. 2007, ApJ, 666, 321
- Kozłowski & Kochanek (2009) Kozłowski, S. & Kochanek, C. S. 2009, ApJ, 701, 508
- Lazendic et al. (2002) Lazendic, J. S., Whiteoak, J. B., Klamer, I., Harbison, P. D., & Kuiper, T. B. H. 2002, MNRAS, 331, 969
- Mathis et al. (1983) Mathis, J. S., Mezger, P. G., & Panagia, N. 1983, A&A, 128, 212
- Meixner et al. (2010) Meixner, M., Galliano, F., Hony, S., et al. 2010, this volume
- Meixner et al. (2006) Meixner, M., Gordon, K. D., Indebetouw, R., et al. 2006, AJ, 132, 2268
- Molinari et al. (2008) Molinari, S., Pezzuto, S., Cesaroni, R., et al. 2008, A&A, 481, 345
- Oliveira et al. (2009) Oliveira, J. M., van Loon, J. T., Chen, C., et al. 2009, ApJ, 707, 1269
- Oliveira et al. (2006) Oliveira, J. M., van Loon, J. T., Stanimirović, S., & Zijlstra, A. A. 2006, MNRAS, 372, 1509
- Pilbratt et al. (2010) Pilbratt et al. 2010, this volume
- Poglitsch et al. (2010) Poglitsch et al. 2010, this volume
- Robitaille et al. (2007) Robitaille, T., Whitney, B., Indebetouw, R., & Wood, K. 2007, ApJS, 169, 328
- Robitaille et al. (2006) Robitaille, T. P., Whitney, B. A., Indebetouw, R., Wood, K., & Denzmore, P. 2006, ApJS, 167, 256
- Schaefer (2008) Schaefer, B. E. 2008, AJ, 135, 112
- Seale et al. (2009) Seale, J. P., Looney, L. W., Chu, Y., et al. 2009, ApJ, 699, 150
- Shimonishi et al. (2008) Shimonishi, T., Onaka, T., Kato, D., et al. 2008, ApJ, 686, L99
- Sinclair et al. (1992) Sinclair, M. W., Carrad, G. J., Caswell, J. L., Norris, R. P., & Whiteoak, J. B. 1992, MNRAS, 256, 33P
- Swinyard et al. (2010) Swinyard, B. M., Ade, P., Baluteau, J.-P., et al. 2010, this volume
- Terebey et al. (1984) Terebey, S., Shu, F. H., & Cassen, P. 1984, ApJ, 286, 529
- van Loon et al. (2010) van Loon, J. T., Oliveira, J. M., Gordon, K. D., et al. 2010, AJ, 139, 68
- Whiteoak & Gardner (1986) Whiteoak, J. B. & Gardner, F. F. 1986, MNRAS, 222, 513
- Whitney et al. (2004) Whitney, B., Indebetouw, R., Bjorkman, J., & Wood, K. 2004, ApJ, 617, 1177
- Whitney et al. (2003a) Whitney, B., Wood, K., Bjorkman, J., & Wolff, M. 2003a, ApJ, 591, 1049
- Whitney et al. (2003b) Whitney, B. A., Wood, K., Bjorkman, J. E., & Cohen, M. 2003b, ApJ, 598, 1079
- Wong et al. (2006) Wong, T., Whiteoak, J. B., Ott, J., Chin, Y., & Cunningham, M. R. 2006, ApJ, 649, 224