FIRST RESULT FROM THE MEG EXPERIMENT
We present the first results from the MEG experiment for the search of the Lepton Flavour Violating decay . LFV decays are forbidden in the SM and highly suppressed in any minimal SM extension with tiny neutrino masses. On the other hand, several SUSY, GUT and ED models beyond the SM predict the rate at a level experimentally accessible. Hence, the MEG experiment will be able either to provide an incontrovertible evidence of physics beyond the SM or to significantly constrain the parameter space of SM extensions.
1 Introduction
We report here the first result from the MEG experiment for the search of the Lepton Flavour Violating (LFV) process at the 590 MeV proton ring at the Paul Scherrer Institute (PSI) in Switzerland.
Lepton Flavour Conservation is an accidental symmetry of the Standard Model (SM), that is not required by the gauge structure of the theory, and is thus naturally violated in many SM extensions. LFV is actually already been observed in the neutral sector, through neutrinos oscillations . In minimal extension of the SM, LFV in the charged sector is mediated by massive neutrinos, giving prediction for the branching ratio () beyond any experimental reach (( ) ). On the other hand, heavy particles beyond the SM entering into virtual loops, can lead to huge enhancement of the rate, allowing the measurement of the to be experimentally accessible (( ) ) . At present, the most stringent upper limit (UL) on LFV in the charged sector comes from the muon system and has been set by the MEGA experiment as ( ) .
The experimental signature of a decay it is characterized by a very simple two-body final state, where the photon and the positron are emitted coincident in time and back to back in the muon rest frame, each with an energy equal to half the muon mass.
There are two major backgrounds to this process: the radiative muon decay (RDM) and the accidental coincidence between an high energy positron from the Michel muon decay and an high energy photon from RMD events, positrons annihilating in flight or bremsstrahlung. While the signal and RDM background are proportional to the muon rate, the accidental background goes as the rate squared and thus dominates. It can be shown that the rate of accidental events is also linearly proportional to the positron energy resolution and the positron-photon time difference resolution and goes quadratically with the photon energy and the solid angle resolution.
Thus, in order to be able to reach an sensitivity, it is mandatory to have a continuos and intense muon beam able to provide high statistic and a precision detector with excellent spatial, time and energy resolutions.
2 The MEG Detector
The MEG detector is schematically composed of a solenoid spectrometer with low-mass drift chambers for the measurement of positron energy and position, scintillators bars and fibers for the measurement of positron time and a liquid Xenon calorimeter for the photon detection.
A very high rate continuos beam ( /s) of surface muons at 28 MeV/c from one of the world’s most intense sources (the E5 line at PSI) is stopped in a thin polyethylene target surrounded by the MEG spectrometer. A Wien filter that assures 7.5 separations of muons w.r.t. other particle that may pollute the beam and a superconducting transport solenoid (BTS) to couple the beam to the detector magnetic field are employed in order to guarantee the most pure and intense beam possible.
Positron originating from the target enter the COBRA (COstant Bending RAdius) superconducting magnet, which provides a graded magnetic field ranging from 1.27 Tesla in the center to 0.49 Tesla at each end. The field is designed such that positrons emitted with the same momentum, follow trajectories with an almost constant projected bending radius, independent of their emission angle. This allows a preferential acceptance of higher momentum particles in the drift chambers, as well as sweeping away particles more efficiently, compared to an uniform field, which is an essential feature in order to fight pile up.
The drift chamber (DC) system is composed by 16 radially aligned modules spaced at intervals, forming and half-circle around the target. Each module contains two staggered layers of anode wire planes, of nine drift cells each, and the layers are separated and enclosed by 12.5 m of Mylar cathode foils with a Vernier pattern structure, for the determination of the coordinate. The chamber are filled with a 50:50 helium/ethane gas mixture, allowing for a total mass of along the positron trajectory. The goal resolutions of the drift chambers are around 200 m for X and Y single hit position and 400 m for Z, and 200 KeV of resolution for the positron momentum.
The positron time is measured by a scintillator timing counter arrays (TC), composed by two section (upstream and downstream w.r.t. the target) placed at the end of the spectrometer. Each array consists of 15 BC404 plastic scintillator bars, with 128 orthogonally placed BCF-20 scintillating fibers. The bars are read by fine-mesh photomultiplier, while the fibers are viewed by avalanche photodiodes. The TC is crucial for the positron time measurement and provides also impact point information and direction, to be used in the trigger. The goal for the intrinsic time resolution of the TC is about 50 ps.
The photon detector (XEC) is the largest liquid Xenon (LXe) calorimeter in the world ( about 900 L) and covers a solid-angle acceptance of . It exploits the scintillation light to measure the energy of the photon and the position and time of the first interaction. The light is read by 846 photomultipliers, which are mounted on the internal surface of the XEC. The uniformity, the fast response and the hight light yield ( of NaI) of the LXe allow very good resolutions, provided that the LXe is kept very pure: in fact, vaccum ultra-violet scintillation light is very easily absorbed by water or oxygen even at sub-ppms levels. The xenon is therefore circulated in liquid phase through a series of purification cartridges and in gas phase through a heated getter in order to prevent contaminations.
The optical properties of the xenon, as well as of PMTs gains and quantum efficiency are constantly monitored by means of LEDs and point-like 241Am -sources deposited on wires inside the LXe active volume. At the same time, energy and relative time calibrations are provided by studying charge exchange (CEX) processes () where, selecting a definite opening angle, it is possible to obtain two mono-energetic lines for calibration, that allow to measure the energy scale and the uniformity. The Dalitz decays () in this process provide also a calibration for the detector time synchronization. Additional calibrations using a Cockcroft-Walton (CW) accelerator of protons against a target provide low energy photons from for monitoring the LXe energy scale, while the two coincident ’s from are detected simultaneously by the XEC and the TC and allow for the determination of the XEC-TC time offset. The goal resolution of the XEC are about 800 KeV for the photon energy, 65 ps for photon timing and 2-4 mm for the photon conversion point.
3 The 2008 Physics Run
The data sample presented here has been collected between September and December 2008 and correspond to muons stopping on the target. During the data-taking the light yield of the XEC was continuously increasing due to the purification of the LXe, which was performed in parallel. This was carefully monitored thanks to the several calibrations available and properly taken into account in the determination of the energy scale in the final analysis. At the same time, the trigger thresholds were accordingly adjusted in order to guarantee an uniform efficiency through the whole run. Moreover, an increasing number of drift chambers suffered frequent high-voltage trips resulting in a substantial reduction of the overall positron efficiency by a factor of three over the whole period. This was due to and hardware problem which implied a long exposure of the chamber to an helium atmosphere. The chambers were all rebuilt in 2009 and did not show anymore signs of this effect.
3.1 Events Selection and Resolutions
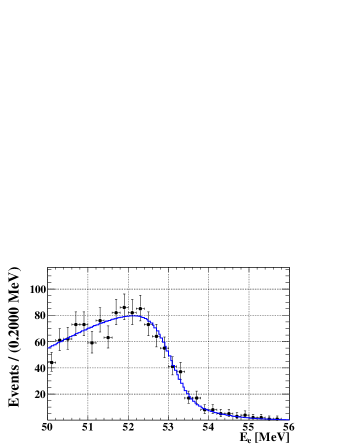
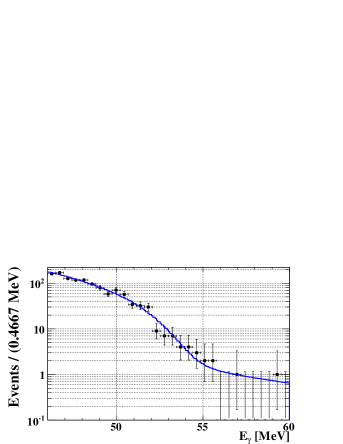
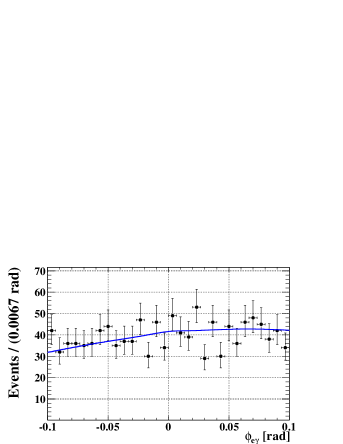
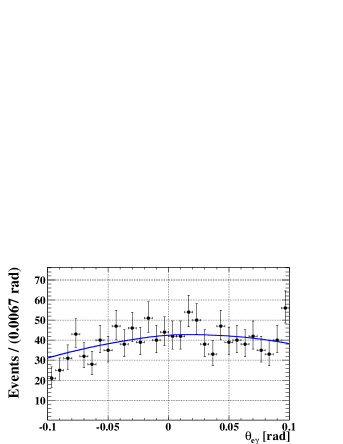
A candidate event is characterized by five kinematic distributions: positron and photon energies ( and respectively), relative time between the photon and the positron () and opening angle between the two ( and ).
The positron energy scale and resolution are evaluated by fitting the kinematic edge of the measured Michel positron energy spectrum at 52.8 MeV with the convolution of the theoretical Michel spectrum with the energy dependent detector efficiency (extracted from data) and the response function for mono-energetic positron (extracted from Monte Carlo (MC) simulation of the signal decay). The latter is well described by the sum of a core and two tails components, all of the three Gaussian. The resolutions extracted from data are 374 KeV, 1.06 MeV and 2.00 MeV in sigma for the core and the two tails component, corresponding to fractions of 60, 33 and 7 respectively. The uncertainty on the fitted parameters is dominated by the systematic of the fit and is determined varying selection and fitting criteria.
The photon energy scale and resolution is extracted from the CEX data, where a small correction is applied in order to take into account the different background conditions in the LXe volume during the operation of the pion beam. The photon energy resolution is asymmetric with a low energy tail due to photons converting in front of the LXe sensitive volume. The resolution function is thus actually dependent on the position of the photon conversion, mainly on the depth inside the detector (). The average resolution on deep events ( 2 cm) is measured to be FWHM with a right tail of , where the error takes into account the variation over the acceptance. The photon energy scale is extracted from the measurement of the 17.67 MeV energy peak of the reaction obtained with the CW protons on the Li target. The scale is also confirmed by a fit to the photon energy spectrum taking into account the expected spectra of RDM, positron annihilation in flight and photons pile-up, folded with the shape determined from the CEX run. The difference between these two measurement gives the energy scale systematic uncertainty, which is .
The positron time is measured by the scintillator in the TC and corrected by the time-of-flight of the positron from the target to the TC, as determined by the track length measured by the spectrometer. The photon time is determined from the rising of the waveforms in the XEC PMTs and corrected by the line-of-flight that starts from the positron vertex at the target (as determined by the spectrometer) and ends at the reconstructed conversion point in the XEC. The peak is fitted in the region 40 45 MeV and, corrected by a small -dependence observed in the CEX runs, the timing resolution for a signal event is estimated to be ps.
The positron direction and decay vertex position are determined by projecting back to the target the positron trajectory, as determined by the spectrometer. The photon direction is defined by the line starting at the conversion point in the LXe and ending at the vertex of the candidate companion positron. The full angular resolution is evaluated by combining the angular resolution and vertex resolution in the positron detector with the position resolution in the photon detector. The positron angular resolution is determined by exploiting tracks that make two turns in the spectrometer, where each turn is treated ad an independent track. The and aaaIn the coordinate system where the beam axis is the z-axis, is defined as the polar angle and as the azimuthal angle. resolutions are extracted separately from the difference of the two track segments at the point of closest approach to the beam-axis and are = 18 mrad and = 10 mrad. With the same technique, it is possible to evaluate the vertex decay position resolution to be 3.2 mm and 4.5 mm in the vertical and horizontal directions on the target plane respectively. These values are confirmed by an alternative estimation, which makes use of holes placed in the target. The resolution on the photon conversion point is evaluated by MC simulation and validated in dedicated CEX runs by placing different lead collimator in front of the LXe volume. The average position resolution along the two orthogonal front-face sides of the LXe and the depth are estimated to be 5 mm and 6 mm respectively.
3.2 Analysis Technique
A blind analysis technique has been adopted, where the events inside the signal region for the photon energy and positron-photon time coincidence are not used for the analysis development and only sideband data are employed for background characterization.
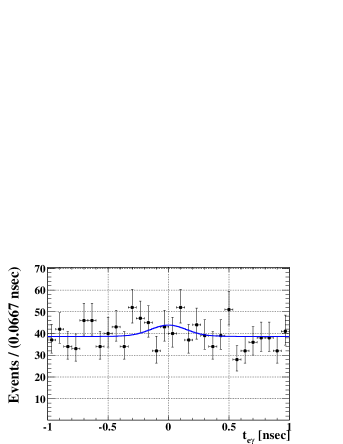
The number of RDM, accidentals and signal events is determined by an extended maximuum likelihood fit to the five variables described above in the region 46 MeV 60 MeV, 50 MeV 56 MeV, 1 ns, 100 mrad and 100 mrad. The signal PDF is the product of the distributions described in 3.1, as they are not correlated. For RDM, the signal PDF is taken for distribution and the other are evaluated by folding the theoretical RDM spectrum with the detector response functions extracted from data. The PDFs for accidental events are determined on sideband data. The event distributions of the five observables in the analysis window is shown in Fig. 1 with the fit superimposed.
The 90 confidence level intervals for the number of signal and RDM events are determined by means of a Feldman-Cousins approach . A contour of 90 C. L. in the plane is determined with Toy MC so that, on each point of the contour, 90 of the simulated experiments give a likelihood ratio larger than the one obtained on data. The limit on is extracted projecting the contour on the -axis and is 14.7 at 90 C.L., where the systematic error is already included. The number of RDM events from the best fit is and is consistent with the estimation of obtained in sideband data, properly scaled to the signal region ().
The main sources of systematic comes from the uncertainty on the selection of photon in pile-up events, the photon energy scale and the positron energy and angular resolutions.
The UL on is calculated by normalizing the UL on to the number of Michel positron counted simultaneously with the signal and using the same analysis cut, assuming that 1. This technique has the great advantage of being independent of the istantaneous beam rate and is nearly insensitive to positron acceptance and efficiencies associated with TC or DC, as signal and Michel differ slightly only due to a small momentum dependence. The branching fraction can in fact be written as:
| (1) |
where = 11414 is the number of detected Michel positron in the range 50 MeV 56 MeV; P = is the prescale factor in the trigger used to select Michel positrons; is the fraction of Michel positron spectrum above 50 MeV; is the ratio of signal to Michel trigger efficiency; is the ratio of signal to Michel DC-TC matching efficiency; is the ratio of signal to Michel DC reconstruction efficiency and acceptance; is the geometrical acceptance for a signal photon given an accepted signal positron; is the efficiency of photon reconstruction and selection criteria.
The trigger efficiency ratio is different from one due to the requirement of a stringent angle matching criteria at the trigger level. The main contributions to the photon inefficiency come from conversions before the LXe active volume and selection criteria imposed to reject pile-up events.
The limit on the branching ratio of decay is therefore
| (2) |
where the systematic uncertainty on the normalization is taken into account.
The sensitivity of the experiment with this data statistic and the same number of accidental and RDM background events, assuming null signal, calculated by means of Toy MC is , which is comparable with the best limit set by the MEGA experiment . Given this sensitivity, the probability to obtain an UL greater than is .
4 Conclusions and Prospect
A search for the LFV process has been performed with a BR sensitivity of , using the data taken during the first three months of run of the MEG experiment in 2008. With this sensitivity, which is comparable with the best UL in the world set by the MEGA experiment, a blind likelihood analysis yields an UL on the BR of .
A new run has been performed between October and December 2009, where the experiment could exploit an improved electronics with better timing and reduced noise, improved trigger efficiency and a smooth operation of all drift chambers, which resulted in an increase of a factor 3-4 in efficiency. Moreover, a better understanding of the detector performances, thanks to the experience gained from the first run, allowed to improve several other efficiencies and resolutions. The corresponding expected sensitivity for this dataset is . A new data taking is starting in May 2010 with an stable an improved detector and MEG is expected to continue running in 2010-2011 for the final goal.
References
References
- [1] T. Schwetz, M. A. Tortola and J. W. F. Valle, New J. Phys. 10 (2008) 113011 [arXiv:0808.2016 [hep-ph]].
- [2] R. Barbieri, L. J. Hall and A. Strumia, Nucl. Phys. B 445 (1995) 219 [arXiv:hep-ph/9501334].
- [3] J. Hisano, D. Nomura and T. Yanagida, Phys. Lett. B 437 (1998) 351 [arXiv:hep-ph/9711348].
- [4] W. J. Marciano, T. Mori and J. M. Roney, Ann. Rev. Nucl. Part. Sci. 58 (2008) 315.
- [5] M. L. Brooks et al. [MEGA Collaboration], Phys. Rev. Lett. 83 (1999) 1521 [arXiv:hep-ex/9905013].
- [6] Y. Kuno and Y. Okada, Rev. Mod. Phys. 73 (2001) 151 [arXiv:hep-ph/9909265].
- [7] G. J. Feldman and R. D. Cousins, Phys. Rev. D 57 (1998) 3873 [arXiv:physics/9711021].