22institutetext: The University of Texas at Austin, Department of Astronomy, 1 University Station C1400, Austin, Texas 78712-0259, USA 33institutetext: Leiden Observatory, Leiden University, PO Box 9513, 2300 RA Leiden, The Netherlands 44institutetext: Max-Planck-Institut für extraterrestriche Physik. Garching, Germany 55institutetext: Herschel Science Centre, European Space Astronomy Centre (ESA), P.O. Box 78, 28691 Villanueva de la Cañada (Madrid), Spain 66institutetext: Department of Astronomy and Space Science, Astrophysical Research Center for the Structure and Evolution of the Cosmos, Sejong University, Seoul 143-747, Republic of Korea 77institutetext: Centre for Star and Planet Formation, Natural History Museum of Denmark, University of Copenhagen, Øster Voldgade 5-7, DK-1350 Copenhagen K. 88institutetext: Max Planck Institute for Astronomy, Königstuhl 17, D-69117 Heidelberg, Germany 99institutetext: Instituut voor Sterrenkunde, K.U.Leuven, Celestijnenlaan 200D, B-3001 Leuven, Belgium 1010institutetext: Astronomy Department, University of California, Berkeley, CA 94720, USA 1111institutetext: Laboratoire d’Astrophysique de Grenoble, CNRS/Université Joseph Fourier (UMR5571) BP 53, F-38041 Grenoble cedex 9, France 1212institutetext: Department of Astronomy, The University of Michigan, 500 Church Street, Ann Arbor, MI 48109-1042, USA 1313institutetext: Caltech, Division of Geological & Planetary Sciences, Mail Code 150-21, Pasadena, CA 91125 1414institutetext: Naval Research Laboratory, Code 7211, Washington, DC 20375, USA 1515institutetext: Institute for Astronomy, University of Hawaii at Manoa, Honolulu, HI 96822, USA ; Spitzer Fellow 1616institutetext: Astronomical Institute “Anton Pannekoek”, University of Amsterdam, PO Box 94249, 1090 GE Amsterdam, The Netherlands 1717institutetext: Department of Astrophysics/IMAPP, Radboud University Nijmegen, P.O. Box 9010 6500 GL Nijmegen The Netherlands 1818institutetext: Institut für Theoretische Astrophysik, Universit t Heidelberg, Albert-Ueberle-Strasse 2, 69120 Heidelberg, Germany 1919institutetext: University of Vienna, Department of Astronomy, Türkenschanzstr. 17, 1180 Vienna, Austria 2020institutetext: Department of Astronomy, University of Maryland, College Park, MD 20742, USA 2121institutetext: Dpt. de Física Teórica, Fac. de Ciencias, Universidad Autónoma de Madrid, Cantoblanco, 28049 Madrid, Spain 2222institutetext: SRON Netherlands Institute for Space Research, PO Box 800, 9700 AV, Groningen, The Netherlands 2323institutetext: National Optical Astronomy Observatory, 950 N. Cherry Ave., Tucson, AZ 85719, USA 2424institutetext: ,††thanks: Postdoctoral Fellow of the Fund for Scientific Research, Flanders
Dust, Ice and Gas in Time (DIGIT) Herschel††thanks: Herschel is an ESA space observatory with science instruments provided by the European-led Principal Investigator consortia and with important participation from NASA. program first results:
Abstract
Aims. DK Cha is an intermediate-mass star in transition from an embedded configuration to a star plus disk stage. We aim to study the composition and energetics of the circumstellar material during this pivotal stage.
Methods. Using the Range Scan mode of PACS on the Herschel Space Observatory, we obtained a spectrum of DK Cha from 55 to 210 m as part of the DIGIT Key Program.
Results. Almost 50 molecular and atomic lines were detected, many more than the 7 lines detected in ISO-LWS. Nearly the entire ladder of CO from =14-13 to 38-37 ( K), water from levels as excited as ( K), and OH lines up to K were detected.
Conclusions. The continuum emission in our PACS SED scan matches the flux expected from a model consisting of a star, a surrounding disk of 0.03 M⊙, and an envelope of a similar mass, supporting the suggestion that the object is emerging from its main accretion stage. Molecular, atomic, and ionic emission lines in the far-infrared reveal the outflow’s influence on the envelope. The inferred hot gas can be photon-heated, but some emission could be due to C-shocks in the walls of the outflow cavity.
1 Introduction
One of the pivotal points in the formation of a star occurs when the star and disk system emerges from the collapsing envelope, signaling the end of the main accretion of stellar mass. The transition from Stage I protostar, embedded in a substantial envelope, to a Stage II configuration, with only a star and disk111See, e.g., Robitaille et al. (2007) for a definition of the Stages is poorly understood.
IRAS 12496-7650 is the brightest infrared (IR) and submillimeter (submm) source in the Chamaeleon II star-forming region, at a distance of pc (Whittet et al. 1997). Follow-up studies to the discovery of IRAS 12496-7650 by Hughes et al. (1989; 1991), along with subsequent observations (e.g., Whittet et al. 1997, Young et al. 2005, Porras et al. 2007, Spezzi et al. 2008), identified the variable Herbig Ae star DK Cha as the optical counterpart. The central star mass is estimated at 2-3 M⊙ (Spezzi et al. 2008), with a bolometric luminosity between 24 (Spezzi et al. 2008) and 35 L⊙ (van Kempen et al. 2009a). The star is surrounded by a molecular outflow and protostellar envelope (van Kempen et al. 2006; 2009a). The spectral energy distribution (SED) is roughly flat in wavelength from near-infrared to mid-infrared (Hughes et al. 1989). Using the definition and including longer wavelength data, (e.g. Henning et al. 1993, van Kempen et al. 2009a), DK Cha has K, making it a Class I source, but near the Class II boundary at 650K. Due to an approximately face-on viewing angle down the outflow cone (van Kempen et al. 2009a); one can observe the protostellar disk directly, unobstructed by the surrounding envelope. This viewing angle also allows the optical emission to escape. The observational SED Classes are often assumed to correspond to the physical Stages, but this is by no means obvious when aspherical models are examined (Robitaille et al. 2007, Crapsi et al. 2008, Dunham et al. 2010) or tracers of dense gas are considered (van Kempen et al. 2009b). The same physical object can have different SED classifications depending on viewing angle. Thus, it is interesting to study an object that is near an SED classification boundary and that also appears to be transitional in physical stage.
Strong far-IR continuum and line emission have been detected (Giannini et al. 1999, van Kempen et al. 2006). As discussed by van Dishoeck (2004), Nisini et al. (2005), and van Kempen et al. (2010) for the case of the similar source HH46, far-IR atomic, ionic, and molecular lines can constrain the properties of the disk, envelope, and outflow. CO emission lines between =14–13 and =19–18, as well as [O i] and [C ii], were observed from DK Cha with ISO-LWS, but other possible molecular species, such as OH and H2O, were undetected (Lorenzetti et al. 1999, Giannini et al. 1999).
| Species | Transition | a | Eu | FWHM | Fluxb |
|---|---|---|---|---|---|
| m | K | m | W m-2 | ||
| [O i] | 3P1-3P2 | 63.18 | 227.72 | 0.08 | 3657.7 |
| OH 3/2-3/2 | 9/2- - 7/2+ | 65.13 | 512.1 | 0.05 | 56.02 |
| OH 3/2-3/2 | 9/2+ - 7/2- | 65.28 | 510.9 | 0.07 | 52.32 |
| CO | 38-37 | 69.07 | 4079.98 | 0.06 | 42.12 |
| CO | 37-36 | 70.91 | 3871.88 | 0.09 | 59.62 |
| o-H2O3 | 707-616 | 71.95 | 843.5 | 0.06 | 37.12 |
| CO | 36-35 | 72.84 | 3668.96 | 0.06 | 40.12 |
| CO | 35-34 | 74.89 | 3471.44 | 0.1 | 57.02 |
| o-H2O | 423-312 | 78.74 | 432.2 | 0.04 | 19.82 |
| OH 1/2-3/2 | 1/2- - 3/2+ | 79.12 | 181.7 | 0.06 | 282 |
| CO | 33-32 | 79.36 | 3092.45 | 0.03 | 17.52 |
| CO | 32-31 | 81.81 | 2911.15 | 0.05 | 126.2 |
| o-H2O | 616-505 | 82.09 | 643.5 | 0.03 | 96.2 |
| CO | 31-30 | 84.41 | 2735.28 | 0.09 | 336.0 |
| OH 3/2-3/2 | 7/2+ - 5/2- | 84.421 | 291.2 | - | - |
| OH 3/2-3/2 | 7/2- - 5/2+ | 84.60 | 290.5 | 0.09 | 301.4 |
| CO | 30-29 | 87.19 | 2564.94 | 0.09 | 317.5 |
| CO | 29-28 | 90.16 | 2399.93 | 0.14 | 545.8 |
| CO | 28-27 | 93.35 | 2240.30 | 0.07 | 261.4 |
| CO | 27-26 | 96.77 | 2086.22 | 0.10 | 330.1 |
| CO | 25-24 | 104.44 | 1794.23 | 0.2 | 314.5 |
| o-H2O | 221-110 | 108.08 | 194.1 | 0.15 | 126.9 |
| CO | 24-23 | 108.76 | 1656.55 | 0.15 | 260.0 |
| CO | 23-22 | 113.46 | 1524.19 | 0.2 | 477.4 |
| o-H2O | 414-303 | 113.541 | 323.5 | - | - |
| CO | 22-21 | 118.58 | 1397.43 | 0.17 | 285.2 |
| OH 3/2-3/2 | 5/2- - 3/2+ | 119.23 | 120.7 | 0.18 | 40 |
| OH 3/2-3/2 | 5/2+ - 3/2- | 119.44 | 120.5 | 0.17 | 72.3 |
| [N ii] | 3P2-3P1 | 121.90 | 188.20 | 0.12 | 45.7 |
| CO | 21-20 | 124.19 | 1276.10 | 0.17 | 357.1 |
| p-H2O | 404-313 | 125.35 | 319.5 | 0.12 | 42.8 |
| CO | 20-19 | 130.37 | 1160.24 | 0.16 | 319.0 |
| CO | 19-18 | 137.20 | 1049.89 | 0.18 | 338.7 |
| p-H2O | 313-202 | 138.53 | 204.7 | 0.17 | 103.0 |
| CO | 18-17 | 144.78 | 945.01 | 0.15 | 350.4 |
| [O i] | 3P0-3P2 | 145.53 | 326.58 | 0.16 | 146.7 |
| CO | 17-16 | 153.27 | 845.63 | 0.15 | 386.0 |
| CO | 16-15 | 162.81 | 751.76 | 0.18 | 466.5 |
| OH 1/2-1/2 | 3/2+ - 1/2- | 163.12 | 270.2 | 0.24 | 91.0 |
| OH 1/2-1/2 | 3/2+ - 1/2- | 163.40 | 269.8 | 0.19 | 90.0 |
| CO | 15-14 | 173.63 | 663.37 | 0.16 | 413.0 |
| o-H2O | 303-212 | 174.63 | 196.8 | 0.19 | 208.0 |
| o-H2O | 212-101 | 179.53 | 114.4 | 0.11 | 31.0 |
| o-H2O | 221-212 | 180.49 | 194.1 | 0.12 | 34.9 |
| CO | 14-13 | 186.00 | 580.51 | 0.20 | 437.2 |
a Laboratory wavelength.
b Flux summed over all pixels in 10-18 W m-2. Typical line flux uncertainties are dominated by calibration uncertainties ( 30-50) and fringing (0.1 Jy at the longest wavelengths to 0.6 Jy at the shortest).
1 Lines blended with above line.
2 Line detected only in central spaxel and should not be compared to the fluxes of the summed spaxels.
3 Doublet unresolved.
The large beam of ISO-LWS (90′′) and its low spectral resolving power () were insufficient to determine the origin (e.g., envelope versus outflow) of the CO emission. The preferred picture was of a small, quiescent hot core of 300 AU around the protostar (Giannini et al. 1999), but recent observations of CO 4–3 and 7–6 indicate that this warm CO emission either originates outside the inner few thousand AU or cannot be heated simply by radiation from the central star (passive heating) (van Kempen et al. 2006); the far-IR and submm lines have different energies and critical densities, so they may originate in different regions.
The Key Programme, Dust, Ice, and Gas in Time (DIGIT) aims to study the evolution of these three constituents through the star formation process by observing objects in different stages. This paper, along with a companion paper on HD100546, a Stage II object (Sturm et al. 2010), present the first results from the DIGIT Science Demonstration observations.
2 Observations
The launch of the Herschel Space Observatory (Pilbratt 2010), with the Photodetector Array Camera and Spectrometer (PACS) instrument (Poglitsch 2010), enables far-IR spectra with high spectral resolving power and good spatial (9′′) resolution. The range scan/SED mode provides a full spectrum (55-210 m).
DK Cha was observed for a total of 4 hours on 10 December 2009 by the PACS spectrometer on the Herschel Space Observatory in pointed range-scan spectroscopy mode (obsid 1342188039 and 1342188040). An image slicer rearranges the light into a array, with each spatial pixel (spaxel) covering . A grating disperses the light onto two 16 25 pixel Ge:Ga detectors. Observations were taken using nodding, in which two off-positions separated by arcmin in elevation were taken as blank′ sky, from which the signal is subtracted. Consequently, spatially diffuse lines (e.g., [C ii]) are subtracted out.
The effective spectral resolving power was about 1000+/-500, lower than was expected. This is due to the pointing error, which is perpendicular to the slit, as well as due to fringing issues on the continuum. The point-spread function of PACS increases towards longer wavelengths and is larger than a single spaxel, but is corrected in post-processing using the PACS spectrum of the pointlike HD100546 (Sturm et al. 2010) to calculate the extraction efficiencies.
The data were reduced using the Herschel Interactive Processing Environment (HIPE v. 2.4). The observation was slightly mispointed (5-6′′) making it hard to assess whether emission is extended and causing wavelength shifts in some spectral ranges. Because of the mispointing, uncertainty in the Spectral Response Function, light leakage problems, and uncertainties in the wavelength dependence of the PSF, the spectrum was trimmed shortward of 56 m, longward of 190 m, and from 95-101 m. Two spectra were used to identify lines. One is from the central spaxel alone. For a second spectrum, used for most lines, fluxes from all spatial pixels were summed to correct for the PSF and mispointing. We will focus on gas lines
3 Results
3.1 Continuum
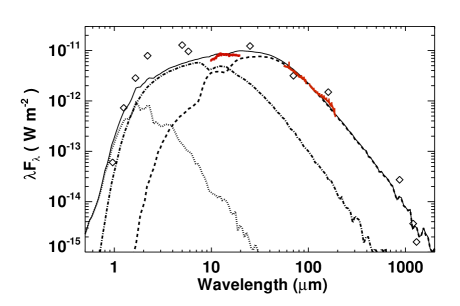
The total Spectral Energy Distribution (SED) in Fig. 1 includes photometry from the literature (Alcalá et al. 2008, Spezzi et al. 2008, Evans et al. 2009, Nefs et al., in prep), combined with Spitzer-IRS spectroscopy and the PACS results. The photometric points were fitted by the SED fitter routine from Robitaille et al. (2007), with results for parameters in Table 2. Due to the extinction and variability at short wavelengths, only points longwards of 3 m were taken as input for the fit.The best-fit model is overplotted and split into the contributions from the star, disk, and envelope. The short-wavelength IRS continuum is dominated by the flux from the disk, the longer wavelength IRS continuum covers the transition from disk to envelope, and the PACS continuum arises in the envelope. The model underestimates the observations in the near-IR and mid-IR, indicating that the disk emission is underestimated in the model.
The best-fit models of the SED grid indeed confirm the assumption of a nearly face-on configuration 18∘, with relatively low and equal envelope and disk masses of 0.03 M⊙, indicative of a source in transition from Stage I to Stage II (Robitaille et al. 2007). The PACS continuum was not used to constrain the fit; the consistency with the predicted model (differences of 10) is thus encouraging, especially considering the calibration uncertainty of 30-50.
| DK Cha characteristics | |||
|---|---|---|---|
| Envelope Mass | 0.03 M⊙ | A | 7.9 |
| Disk Mass | 0.03 M⊙ | Inclination | |
| Luminosity | 29.4 L⊙ | Disk Inner Radius | 0.3 AU |
1 Total Av of which Av=5.2 mag. is attributed to the envelope at an inclination of 18⊙ and 2.7 mag. to more extended cloud.
3.2 Line Inventory
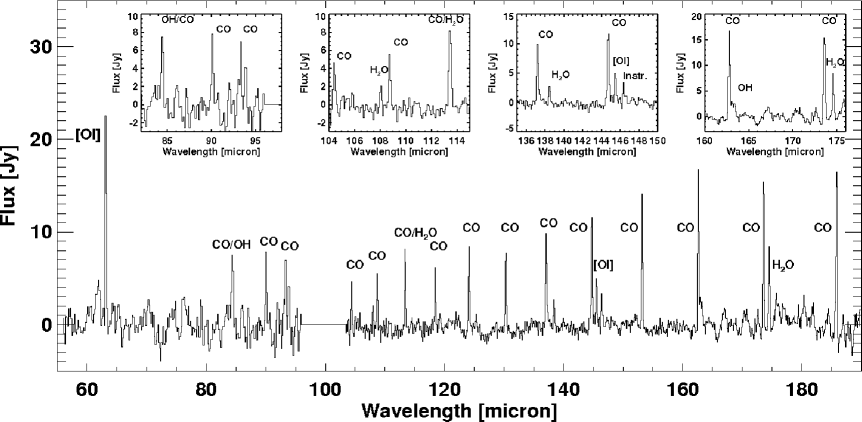
Table 1 lists all gas lines that have been identified. Fig. 2 shows the spectrum after subtraction of a polynomial fit to the continuum. We used a combination of the ISO line list222http://www.mpe-garching.mpg.de/iso/linelists/Molecular.html and the list published in Lerate et al. (2006) for the Orion bar. More lines may be detectable in this spectrum after PSF deconvolution. Some lines in Table 1 are only detected in the central spaxel. Due to the fringing in other spaxels at short wavelengths and the PSF problems discussed above, these do not show up in the summed result of Fig. 2. Using spectra both from the summation of all 25 spaxels and from only the central spaxel, a large range of CO, H2O and OH lines were detected, ranging in excitation energies from a few hundred kelvin to over 3000 K. In addition, [O i] and [N ii] were identified. Emission from [C ii] at 157.7 m is not seen. That line was detected by Lorenzetti et al. (1999), but was believed to be extended emission, associated with the galactic ISM. This component is subtracted out in our observations due to the nodding, which was not used in ISO-LWS.

3.3 Gas analysis
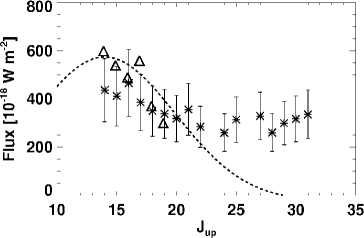
Far-infrared CO lines were previously detected by Giannini et al. (1999), but only up to CO =19-18. Assuming the lines to be optically thin, those could be fitted with temperatures ranging from K to K and densities from cm-3 to cm-3. The high T, low n model, which produces the most emission in the high- lines, is overplotted in Fig. 3. As can be seen, this model severely underproduces the CO lines from higher transitions seen by Herschel. The other proposed models produce even less high- emission.
The CO level populations up to (Fig. 3), can be fitted with two distinct rotational temperatures (), with the break at about K. Most of the mid-J CO lines can be fitted by K, while higher excitation lines are best fitted with K. In HH46 (van Kempen et al. 2010), UV photon heating (Spaans et al. 1995) is dominant for lines with energies below 1700 K, while a non-dissociative C-shock dominates the emission from higher excitation lines. A similar model is plausible for DK Cha, and the issue will be explored in a forthcoming paper (Green et al. in prep).
Water was detected in a wide variety of transitions, up to 707-616 at 71.93 m with ( K). Water was not detected in ISO-LWS (Giannini et al. 1999) because the lines are 5 times weaker than the CO lines. The discovery of the 707-616 line indicates high temperature, as confirmed by the high- CO lines. Given the possible identification of shocked CO and the geometry of DK Cha, it is likely that the water emission arises at least in part from either a non-dissociative C-shock or UV-heating of the quiescent material along the outflow cavity walls.
In addition, at least 9 lines of OH are detected. Since oxygen is rapidly transformed into H2O at temperatures higher than 100 K and frozen out below that, either a very strong UV field or a dissociative shock is needed. OH is a major coolant for dissociative shocks (Neufeld & Dalgarno 1989). This dissociative shock is accompanied by a C-shock, which may explain the CO and H2O analysis. Models from Wampfler et al. (in prep) also suggest that C-shock densities are often too low to both account for these high excitation lines and at the same time not overproduce the 119 and 163 m OH lines.
HD 100546 (Sturm et al. 2010), a Herbig Be star without an envelope, was chosen for early observations to be a source analogous to DK Cha, but further evolved. A comparison is useful because similar species are seen in its spectrum. Emission of H2O and OH from the upper layers of a flared, but quiescent disk, similar to that around HD 100546 (Sturm et al. 2010), could account from some of the lines from DK Cha. However, accounting for the difference in distance, the CO lines from DK Cha are more than 10 times stronger, and higher excitation lines from H2O are seen toward DK Cha. A possible explanation for the increased emission of DK Cha is an accretion shock onto the disk, where high densities and temperatures are present. Another possibility is a shock in the walls of the outflow. This will also be further examined in Green et al. in prep.
4 Conclusions
Continuum models that fit the data are consistent with the interpretation of DK Cha as transitional between a Stage I and Stage II object, with nearly equal masses in envelope and disk and a nearly face-on geometry. The full PACS SED mode observations reveal an extremely rich spectrum of over 50 ionic, atomic, and molecular lines. With further improvements to the spectral response function, we will be able to identify additional gas, ice and dust features in the spectrum. The full range scan/SED mode can probe many aspects of a protostellar object, from the ambient envelope to gas excited by ultraviolet radiation and by shocks.
Acknowledgements.
Support for this work, part of the Herschel Open Time Key Project Program, was provided by NASA through an award issued by the Jet Propulsion Laboratory, California Institute of Technology. The authors would like to thank Bart VandenBussche and Alessandra Contursi for help with the data reduction, and David Ardila for his help in scheduling the observations prior to the ESAC SDP workshop.References
- Alcalá et al. (2008) Alcalá, J. M., Spezzi, L., Chapman, N., et al. 2008, ApJ, 676, 427
- Crapsi et al. (2008) Crapsi, A., van Dishoeck, E. F., Hogerheijde, M. R., Pontoppidan, K. M., & Dullemond, C. P. 2008, A&A, 486, 245
- Dunham et al. (2010) Dunham, M. M., Evans, N. J., Terebey, S., Dullemond, C. P., & Young, C. H. 2010, ApJ, 710, 470
- Evans et al. (2009) Evans, N. J., Dunham, M. M., Jørgensen, J. K., et al. 2009, ApJS, 181, 321
- Giannini et al. (1999) Giannini, T., Lorenzetti, D., Tommasi, E., et al. 1999, A&A, 346, 617
- Henning et al. (1993) Henning, T., Pfau, W., Zinnecker, H., & Prusti, T. 1993, A&A, 276, 129
- Hughes et al. (1989) Hughes, J. D., Emerson, J. P., Zinnecker, H., & Whitelock, P. A. 1989, MNRAS, 236, 117
- Hughes et al. (1991) Hughes, J. D., Hartigan, P., Graham, J. A., Emerson, J. P., & Marang, F. 1991, AJ, 101, 1013
- Lerate et al. (2006) Lerate, M. R., Barlow, M. J., Swinyard, B. M., et al. 2006, MNRAS, 370, 597
- Lorenzetti et al. (1999) Lorenzetti, D., Tommasi, E., Giannini, T., et al. 1999, A&A, 346, 604
- Neufeld & Dalgarno (1989) Neufeld, D. A. & Dalgarno, A. 1989, ApJ, 340, 869
- Nisini et al. (2005) Nisini, B., Antoniucci, S., Giannini, T., & Lorenzetti, D. 2005, A&A, 429, 543
- Pilbratt (2010) Pilbratt, G., e. a. 2010, this volume
- Poglitsch (2010) Poglitsch, A., e. a. 2010, this volume
- Porras et al. (2007) Porras, A., Jørgensen, J. K., Allen, L. E., et al. 2007, ApJ, 656, 493
- Robitaille et al. (2007) Robitaille, T. P., Whitney, B. A., Indebetouw, R., & Wood, K. 2007, ApJS, 169, 328
- Spaans et al. (1995) Spaans, M., Hogerheijde, M. R., Mundy, L. G., & van Dishoeck, E. F. 1995, ApJ, 455, L167+
- Spezzi et al. (2008) Spezzi, L., Alcalá, J. M., Covino, E., et al. 2008, ApJ, 680, 1295
- Sturm et al. (2010) Sturm, B., Bouwman, J., & Henning, T. e. a. 2010, this volume
- van Dishoeck (2004) van Dishoeck, E. F. 2004, ARA&A, 42, 119
- van Kempen et al. (2006) van Kempen, T. A., Hogerheijde, M. R., van Dishoeck, E. F., et al. 2006, A&A, 454, L75
- van Kempen et al. (2010) van Kempen, T. A., Kristensen, L., Herzceg, G., et al. 2010, this volume
- van Kempen et al. (2009a) van Kempen, T. A., van Dishoeck, E. F., Hogerheijde, M. R., & Güsten, R. 2009a, A&A, 508, 259
- van Kempen et al. (2009b) van Kempen, T. A., van Dishoeck, E. F., Salter, D. M., et al. 2009b, A&A, 498, 167
- Whittet et al. (1997) Whittet, D. C. B., Prusti, T., Franco, G. A. P., et al. 1997, A&A, 327, 1194
- Young et al. (2005) Young, K. E., Harvey, P. M., Brooke, T. Y., et al. 2005, ApJ, 628, 283