11email: alard@iap.fr
On the variable color of the images of a single source in a gravitational mirage: consequences for the photometric redshift.
Abstract
Aims. In gravitational lensing the average colors of the images are not identical to the average color of the source. The highly non-linear mapping of gravitational lensing does not preserve the color balance of the source, and this mapping is different for each image.
Methods. The color distortion of the images is illustrated using HST images of the lens SL2SJ02140. It is shown that in this lens the color of the images is variable, reflecting the variable color of the source.
Results. The average color of the images in SL2SJ02140 are interpreted as a variable amplification of different sources regions with different colors.
Conclusions. The variation of the average image colors affects the measurements of the photometric redshift of the images. This is especially true for SL2SJ02140 where the color variations due to the non-linear mapping of the lens simulates pseudo redshifts variations.
Key Words.:
Gravitational lensing1 Introduction.
Gravitational lensing preserve the surface brightness of the source the color of the local source element. As a consequence it is generally assumed that the average color of the images reflects the color of the source. But this statement is true only if the color of the source is constant. In practice this is rarely the case as illustrated by SL2SJ02140 (Alard 2009) or SL2S02176 (Alard 2010). Since in a gravitational lens the images of the source are highly distorted, the surface occupied by an area of the source of a given color is different in each images. For instance, some source area of a given color are over-amplified and thus over represented. This non-linearity is different in each image, leading to color variations of the images.
2 SL2SJ02140 as an illustration of the variations in color of the images of a given source.
This section will present in more details an analysis of HST data that was already presented in Alard (2009).
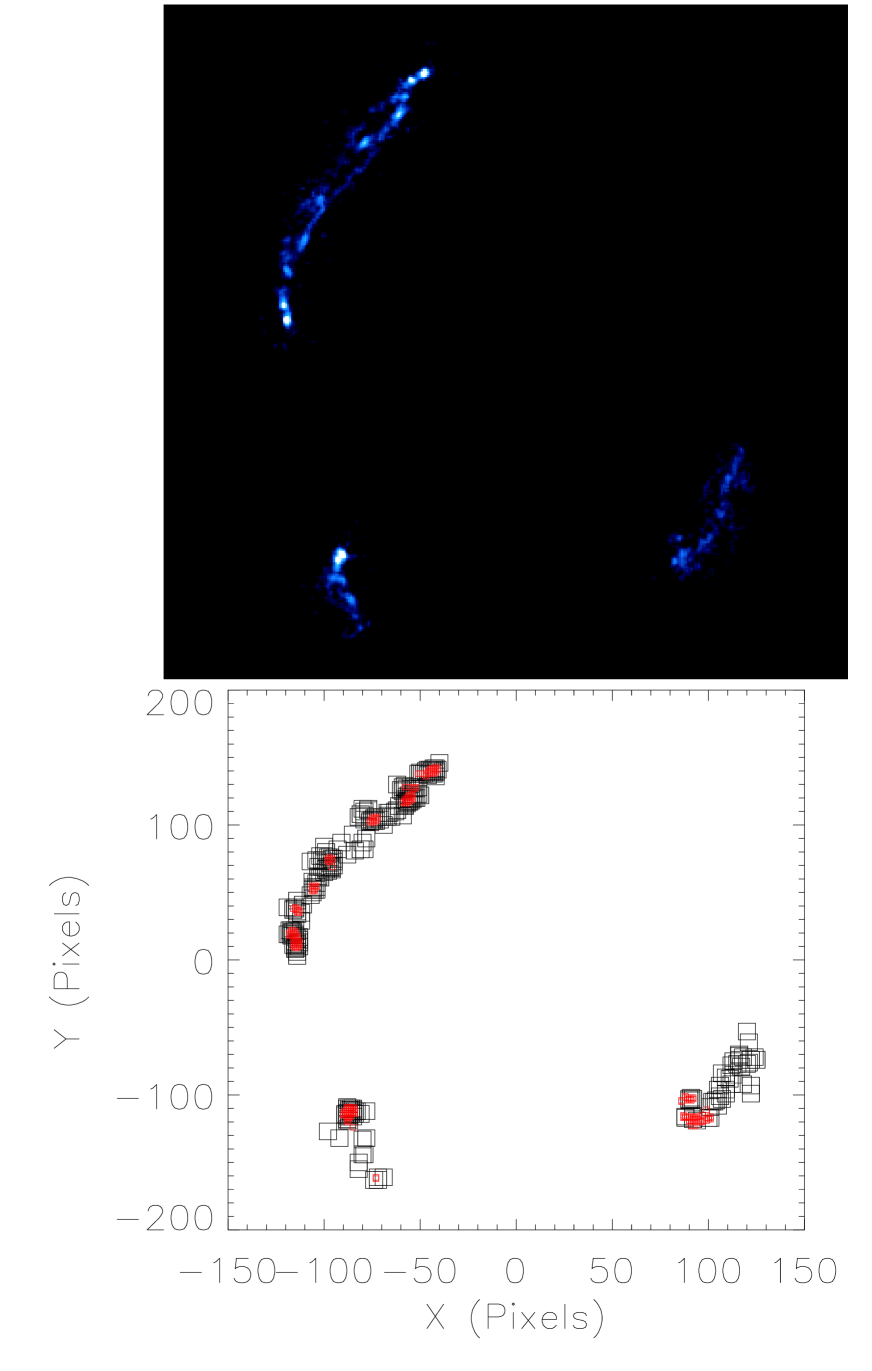
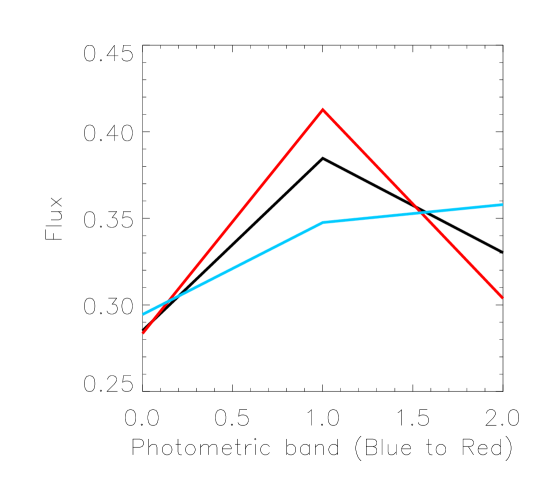
2.1 Average image colors.
The average image colors are computed using all images areas (red+black areas in Fig. 1). A 3 point Color diagram is computed for each image using the 3 HST photometric bands (see Alard, 2009 for more details). The color diagrams of the images (Fig. 2) are all different, but the color diagram of image C (see Verdugo etal. 2010 for the image name definitions) is quite apart from the color diagrams of images A,B. We will see that this difference in color is a consequence of the non-linear mapping of the source.
2.2 Detailed analysis of image colors
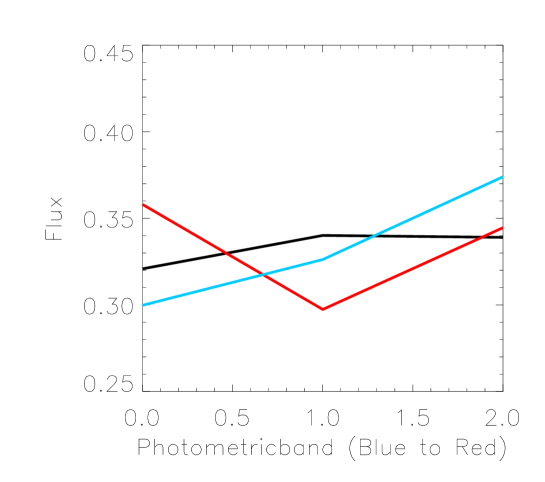
Are the color variations observed in Fig. 2 due to redshift-distance effects or are they due to a combination of source color variation and non-linear mapping ? This question can be easily answered by analyzing the colors variations within each image. If we observe the image of a single source at a given redshift, the color of the individual source elements must be similar in all the images. In SL2SJ02140 the individual image elements are of 2 kinds: bright sharp details (BSD) and smoother image areas (SIA). Provided all the images are from the same source we expect that the BSD and SIA should have all the same colors in all images. Fig. 3 and Fig. 4 demonstrates that this is just what we observe. The analysis is facilitated by the fact that the BSD and SIA have very different colors and the difference in color is very statistically significant (Alard 2009). This result rules out the possibility that image C is the image of another source. In such case one should not retrieve similarities in the colors of the BSD and SIA between image C and A,B.
2.3 Interpretation.
The similarities between the colors of the SIA and BSD demonstrates that all images comes from the same source. The variations in the image colors are due to different weightings (amplifications) of the SIA and BSD. Images A,B are quite dominated by the flux of the BSD, while the weight of the BSD is much lower in image C. The difference in the weighting of the BSD between the images is just a consequence of the non-linearity of gravitational lens, and of the complexity of the potential.

3 Conclusion
The analysis of SL2SJ02140 demonstrates that the color variations within each image should always be analyzed before making any conclusion about the average image colors. This analysis is absolutely essential before deriving any results about the intrinsic color of the source. One should not forget that the non-linearity of gravitational lensing greatly complicates the interpretation of image colors, and that a straightforward interpretation of the average image colors may be wrong. For instance Verdugo etal. 2010 found that using the average color of the images the pseudo redshift of the source was between 1.0 and 1.8, which illustrates the amplitude of the errors on the redshift that can be made when the non-linearity of the lens mapping is ignored.
References
- (1) Alard, C., 2009, A&A, 506, 609
- (2) Alard, C., 2010, A&A, 513, 39
- (3) Verdugo, T., Motta, V., Munoz, R., Limousin, M., Cabanac, R., Richard, J., 2010 arXiv1005.1566