Dust/gas correlations from Herschel observations††thanks: Herschel is an ESA space observatory with science instruments provided by European-led Principal Investigator consortia and with important participation from NASA.
Abstract
Context. Previous Spitzer and IRAS observations of the LMC suggest an excess of FIR emission with respect to the gas surface density traced by 12CO rotational emission lines and H i 21 cm emission. This so-called “FIR excess” is especially noticeable near molecular clouds in the LMC, and has usually been interpreted as indicating the presence of a self-shielded H2 component not traced by CO in the envelopes of molecular clouds.
Aims. Based on Herschel HERITAGE observations taken as part of the Science Demonstration Phase, we examine the correlation between gas and dust surface densities at higher resolution than previously achieved. We consider three additional possible causes for the FIR excess: X factor, FIR dust emissivity, and gas-to-dust ratio variations between the diffuse and dense phases of the ISM.
Methods. We examine the structure of NT80 and NT71, two molecular clouds detected in the NANTEN 12CO survey of the LMC. Dust surface density maps were derived from the HERITAGE data. The gas phase is traced by MAGMA 12CO and ATCAParkes H i 21 cm observations of the LMC. These data provide unprecedented resolution (1’) to examine the structure of molecular clouds. The dust emissivity, gas-to-dust ratio, and X factor required to match the dust and gas surface densities are derived, and their correlations with the dust surface density are examined.
Results. We show that the dust surface density is spatially correlated with the atomic and molecular gas phases. The dust temperature is consistently lower in the dense phase of the ISM than in the diffuse phase. We confirm variations in the ratio of FIR emission to gas surface density derived from H i and CO observations. There is an excess of FIR emission, spatially correlated with regions of intermediate H i and dust surface densities (AV = 1-2), and little or no CO. While there is no significant trend in the dust emissivity or gas-to-dust ratio with dust surface density, the X factor is enhanced at AV = 1-2. We conclude that H2 envelopes not traced by CO and X factor variations close to the CO boundary may be more likely to cause these deviations between FIR emission and gas surface density than gas-to-dust ratio or emissivity variations.
Key Words.:
ISM: dust, extinction – ISM: clouds – ISM: abundances – ISM: structure – Galaxies: ISM – Galaxies: Magellanic Clouds1 Introduction
Dust, neutral atomic hydrogen (H i), and molecular hydrogen (H2) are
the prime constituents of the interstellar medium in galaxies out of
which stars form, but their amounts are often poorly known. In dense clouds, dust shields both H2 and its tracer CO from
dissociation by the ambient interstellar radiation field (ISRF).
Unlike CO, H2 is also strongly self-shielding. In the solar
neighborhood, H2 forms at 0.14, while CO requires
0.8 (Wolfire et al. 2010). Molecular clouds (MCs) thus consist
of dense cores where CO and H2 coexist and less dense envelopes of
H2 with little or no CO. In lower-metallicity environments with
strong irradiation, the poorly shielded CO fills a much smaller
fraction of the H2 volume. In those galaxies use of a standard
conversion factor XCO to estimate H2 column densities from observed
CO emission causes large amounts of H2 to be missed (see e.g., Glover & Mac Low 2010).
The nearest low-metallicity galaxies are the Large Magellanic Cloud (LMC) and the Small Magellanic Cloud (SMC) with [C]
and [O] abundances 0.25/0.50 and 0.10/0.25 relative to solar abundances (Pagel 2003) and distances
of 50 kpc (Schaefer 2008) and 62 kpc (Szewczyk et al. 2009) respectively. The FIR emission from dust has been used
to establish that indeed much H2 is not traced by CO and exhibits a
so-called “FIR excess”, implying X factors 3-6 (LMC) and 20-60
(SMC) times higher than in the solar neighborhood (Israel 1997; Leroy et al. 2007, 2009; Bernard et al. 2008). Their analysis assumes that dust grain emissivity and gas-to-dust
ratios are the same in dense H2 clouds and more tenuous H i regions. Our goal in this Letter is to explore whether these
assumptions are justified. To this end, we examine the structure of
two MCs in the LMC, NT80 and NT71 (Fukui et al. 2008). Both clouds are relatively quiescent (Kawamura et al. 2009), with star formation rates implied by H and 24 m emission of 0.018 and 0.042 M⊙/kpc2/yr. NT80 is located in a direction practically devoid of H emission, while NT71 is associated with the faint filamentary H
nebula DEM 110 (Davies et al. 1976). We examine the correlation
between dust and gas based on HERschel Inventory of The Agents of Galactic Evolution (HERITAGE) data and MAGellanic
Mopra Assessment (MAGMA, PI. T. Wong) 12CO data. These data provide unprecendented resolution (15 pc) to observe the structure of MCs in the LMC.
2 Observations and dust and gas surface densities
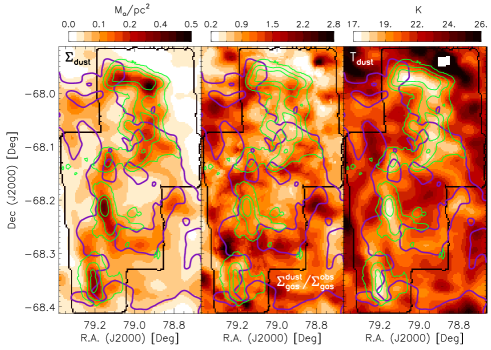
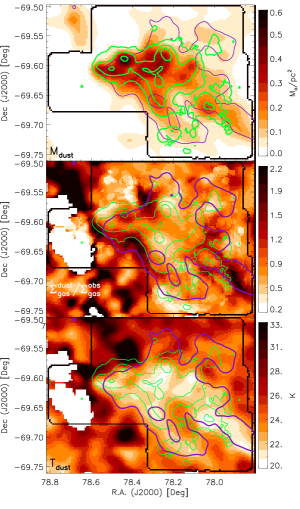
The dust surface density () and temperature Tdust in the LMC have been derived in Gordon et al. (2010), based on Spitzer MIPS 160 m observations from the Surveying the Agents of Galactic Evolution project (SAGE, Meixner et al. 2006), and more recent SPIRE (Griffin et al. 2010) observations taken by Herschel as part of the HERITAGE key project during the Science Demonstration Phase (Meixner et al. 2010). The dust temperature was obtained by fitting a modified black body of emissivity law = 1.5 to the MIPS 160 m, SPIRE 250 and 350 m bands (the 500 m band being affected by an excess of unknown origin). The dust surface density was derived from the MIPS 160 m brightness and the dust temperature, assuming that the grains are silicates of density 3 g cm-3, size = 0.1 m, and emissivity at 160 m = 1.7 m2 (absorption efficiency 5.47). Figures 1 and 2 show the dust surface density and temperature for NT80 and NT71.
The H i column density was taken from the Australian telescope compact array (ATCA)Parkes map of the LMC by Kim et al. (2003), and converted into a surface density via (H i) 1.0810-20 N(H i), where (H i) is the H i surface density in M⊙/pc2, and the conversion includes the contribution of He to the mean molecular weight (1.36). We applied the same background subtraction to the dust and H i surface density maps to set the zero level of the sky background at the end points of the HERITAGE scans, located outside of the LMC (Meixner et al. 2010). The molecular gas surface density was derived from MAGMA CO observations via (H) = 2.16XCOICO, where (H) is the molecular gas surface density in M⊙/pc2, ICO is the CO integrated intensity in K km/s, and XCO is the X factor. We assume XCO values derived from a virial analysis of NT80 and NT71 by Hughes et al. (2010): XCO (5.10.1)1020 cm-2 K-1 km-1 s for NT80 and (4.10.1)1020 cm-2 K-1 km-1 s for NT71, consistent with the range of values from Israel (1997) for MCs similar to NT80 and NT71. The implied gas surface density is (H i) (H. The sensitivities of the H i and MAGMA maps are 0.9 and 5.5 M⊙/pc2 (0.5 K km/s). Atomic and molecular gas surface densities are shown in Figs. 1 and 2.

3 Dust/gas correlation and FIR excess
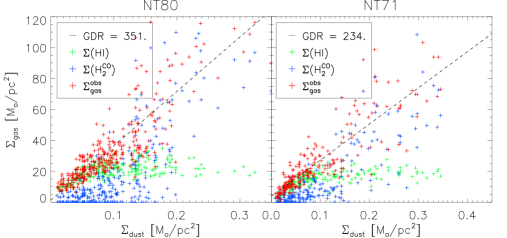
The first panels of Figs. 1 and 2 show that the molecular phase traced by CO is very well correlated with the highest dust surface density regions. The 0.08 M⊙/pc2 ( 0.8) contour is indeed almost identical to the 5.5 M⊙/pc2 contour of (H) (sensitivity limit). This spatial correlation is expected from the physics of CO formation and dissociation. The H i envelope of the clouds is more extended than the CO regions, but is also well spatially correlated with the dust surface density. Figure 3 shows the pixel-to-pixel correlation between the dust surface density, the H i surface density, (H i ), the H2 surface density derived from CO observations, (H), and the total gas surface density, . (H i ) dominates the gas surface density and increases linearly with for 0.1 M⊙/pc2 ( = 1), at which point the gas surface density becomes dominated by H2. The total gas surface density is linearly correlated with the dust surface density over the entire range of dust surface densities. The slope of the correlation gives the gas-to-dust ratio, the value of which is GDR 3515 for NT80, and GDR 2344 for NT71. The intercept of the total gas surface density with the zero dust surface density is at 1.40.56 M⊙/pc2 for NT80 and 3.80.5 M⊙/pc2 for NT71, indicating that there is an offset between the zero levels of the dust and H i surface density maps. As a result, we do not trust ratios of dust and gas surface densities at low surface densities ( 0.05 M⊙/pc2).
We examine the correlation between two different estimates of the gas surface density: from dust measurements and a constant gas-to-dust ratio, GDR, and from CO and H i observations, . The middle panels of Figs. 1 and 2 show the ratio /. On average, the ratio / is one, with some deviations that appear spatially correlated with the different phases of the ISM. In particular, / is highest (1.5) in regions with intermediate dust ( 0.1-0.2 M⊙/pc2) and H i ((H i) 20-30 M⊙/pc2) surface densities, and little or no CO ((H) 10 M⊙/pc2). It is close to one ( 0.7 and 1.3) at high dust surface densities ( 0.2 M⊙/pc2 or 2), inside the CO boundary ((H) 10 M⊙/pc2). It is low ( 0.5) in diffuse regions, outside of the H i and CO contours in Figs. 1 and 2. A low / ratio at low dust surface densities is uncertain as it is likely dominated by small offsets between the H i and the dust surface density zero levels. On the other hand, the excess of FIR emission (i.e., of dust surface density) in regions with intermediate dust surface density and little or no CO supports the presence of H2 envelopes not traced by CO, and is consistent with previous conclusions drawn from the comparison between dust and gas (Israel 1997; Leroy et al. 2007, 2009).
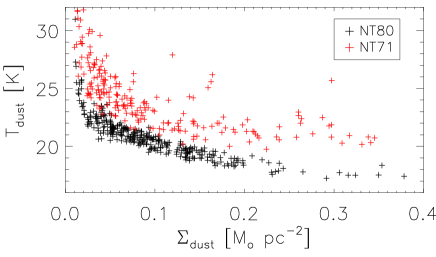
Last, the right panels of Figs. 1 and 2 show that the dust temperature appears to be spatially anti-correlated with the dust surface density, the high dust surface density regions being colder than the low dust surface density regions by a few K. This effect is further seen in Fig. 4, which shows the pixel-to-pixel correlation between and Tdust. This anti-correlation suggests that the regions of MCs that are well shielded from the ambient radiation are colder than the envelopes of the clouds, more exposed to the ISRF. This effect has not been observed at 4’ resolution in the dust properties derived from IRAC, MIPS, and IRIS observations of NT80 and NT71 (Paradis et al. 2010), but is clearly seen at 1’ resolution in our Herschel data. The dust temperature in NT71 is higher than in NT80, which may result from heating by star forming regions embedded in NT71.
4 Possible causes of the variations of /
4.1 X factor variations
The molecular gas surface density derived from CO observations was computed with a constant X factor. In reality, the CO/H2 abundance is sensitive to photo-dissociation at 2-3 (Rubio et al. 1993; Glover & Mac Low 2010). As a result, the X factor is expected to decrease (the CO/H2 abundance to increase) with dust surface density in the transition region between the H2 envelopes and the CO cores of MCs. While H2 gas not traced by CO in the envelopes of MCs might account for the excess of FIR emission with respect to the gas surface density outside the CO boundary, unaccounted for X factor variations may also cause deviations in the dust/gas correlation inside the CO boundary.
Within the CO boundary (where ICO is above the MAGMA sensitivity), we derive the X factor required to match the gas surface density inferred from dust and a constant GDR with the surface density implied by CO and H i observations:
| (1) |
The top row of Fig. 5 shows the correlation between X and . The red curve indicates the binned trend (0.02 M⊙/pc2 bins). Since i) we assume a constant X factor, XCO 5.1 for NT80 and XCO 4.1 for NT71, to derive GDR, and ii) we assume GDR to derive X at each pixel, it follows that the average of X and the assumed XCO must be and are equal within the error bars (X (5.70.5) and (3.60.5) for NT80 and NT71). Thus, Fig. 5 merely investigates whether systematic variations in X with can explain the variations in Figs. 1, 2 and the scatter in Fig. 3.
XCO is higher in the range 0.1-0.2 M⊙/pc2 ( = 1-2) by a factor of up to 8 compared to the densest regions, well inside the CO boundary ( 0.2 M⊙/pc2 or 2). This enhancement however only appears marginally significant in the binned trends. Nonetheless, X factor variations may very well contribute to the observed variations in the FIR emission/gas surface density ratio inside the CO boundary. In fact, this increase in XCO at intermediate surface densities is likely coincident with the transition regions between dissociated and shielded CO, and supports the presence of H2 envelopes not traced by CO. The decrease in XCO at low ( 0.05 M⊙/pc2) dust surface densities is likely due to small offsets between the H i and dust surface density zero levels — the H i level being slightly higher, as shown by the negative values of XCO. Besides being difficult to explain physically, we do not trust its significance.
4.2 Dust emissivity variations
The dust surface density was derived assuming that the emissivity of dust does not depend on environment. An emissivity increase in the FIR of a factor 3 to 4 between the the diffuse and dense phases has however been invoked to explain the cold temperatures and the 60 m emission deficit observed in the molecular phase (Stepnik et al. 2003), and is expected from grain coagulation in the dense phase of the ISM (Paradis et al. 2009). In the Milky Way, this argument is supported by recent FIR and sub-mm observations by Paradis et al. (2009).
The dust emissivity per unit mass, , was derived from matching the 160 m emission to the surface density implied by CO and H i observations for a constant gas-to-dust ratio:
| (2) |
where, is the brightness observed at 160 m, B160(Tdust), is the Planck function at the dust temperature Tdust and at 160 m, and GDR is a constant gas-to-dust ratio.
The second row of Fig. 5 shows the pixel-to-pixel correlation as well as the binned relation between / and , where is the constant emissivity assumed to derive the dust surface density (Gordon et al. 2010). For both NT80 and NT71, is constant with within the scatter. Again, we do not take the lowest, uncertain points into account. While it is possible that trends be hidden in the scatter, our data do not seem to support emissivity variations as a major contributor to the variations in the FIR emission/gas surface density correlation. Further investigation with the full extent of the HERITAGE survey will be necessary to draw firmer conclusions.
4.3 Gas-to-dust ratio variations
Our analysis in Sects. 4.1 and 4.2 was based on the assumption of
a constant gas-to-dust ratio. It is possible, however, that XCO and the FIR
dust emissivity are approximately uniform, and that GDR varies. In this case, the middle panel of Figs. 1 and 2 represents
the variations in gas-to-dust ratio implied by gas and dust observations. Gas-to-dust ratio variations could be caused by dust destruction (or change of size) in shocks and intense ISRFs in the LMC, or by grain growth in molecular cores.
The gas-to-dust ratio implied by dust and gas observations was obtained via GDRobs /. The plausibility of gas-to-dust ratio variations as a cause for deviations in the FIR emission/gas correlation was further tested by examining the correlation between GDRobs and , shown in the bottom row of Fig. 5. The dashed line indicates the constructed trend obtained for a constant, mean gas surface density. If the lowest, uncertain points in are omitted, the gas-to-dust ratio appears rather constant with , within the scatter. Although a more complete investigation is needed to draw strong conclusions, gas-to-dust ratio variations between the diffuse and dense phases of the ISM do not appear to contribute much to deviations in the FIR emission/gas correlation.
5 Conclusion
We have examined the correlation between dust, atomic, and molecular gas using HERITAGE, ATCA H i 21 cm, and MAGMA CO observations of two LMC molecular clouds. The dust temperature appears consistently lower in the dense phase than in diffuse regions. The dust surface density is spatially correlated with the atomic and molecular phases, making Herschel’s angular resolution and complete coverage of the IR SED a powerful tracer of
molecular gas. We have however observed an excess of FIR emission with respect to the gas surface density implied by CO and H i observations, which occurs at intermediate dust surface densities (0.1-0.2 M⊙/pc2), outside and close to the CO boundary. This likely indicates that molecular clouds are surrounded by envelopes of H2 not traced by CO. The presence of unaccounted for H2 envelopes is further supported by an increase in the X factor at intermediate dust surface densities, corresponding to the transition region between dissociated and shielded CO.
We reviewed two alternative explanations for the FIR excess:
variations in dust emissivity and the gas-to-dust ratio between the
diffuse
and dense phases of the ISM. We derived the dust emissivity and
gas-to-dust ratio required to match the observations, and examined
their correlations with the dust surface density in order to evaluate
the plausibility of each hypothesis. We found that the dust
emissivity and gas-to-dust ratio in NT71 and NT80 are constant with
within the scatter, and conclude that dust emissivity and
gas-to-dust ratio variations are therefore unlikely to be responsible
for the FIR excess observed near these clouds. Variations in emissivity
and gas-to-dust ratio between the dense and diffuse ISM phases cannot be
definitively ruled out however, due to uncertainties at low dust
surface density that are caused by offsets in the zero levels of the H i and dust maps. In the immediate future, we will
conduct a full investigation of all these effects using detailed modeling in combination with the
completed HERITAGE survey of both Magellanic Clouds.
Acknowledgements.
We acknowledge financial support from the NASA Herschel Science Center (NHSC), JPL contracts #1381522, and #1381650. Part of this research was conducted at the Jet Propulsion Laboratory, California Institute of Technology under contract with the National Aeronautics and Space Administration. We thank the support from the European Space Agency, PACS and SPIRE teams, Herschel Science Center, and NHSC (B. Ali, K. Xu). M.R. is supported by FONDECYT No1080335 and FONDAP No15010003.References
- Bernard et al. (2008) Bernard, J., Reach, W. T., Paradis, D., et al. 2008, AJ, 136, 919
- Davies et al. (1976) Davies, R. D., Elliott, K. H., & Meaburn, J. 1976, MmRAS, 81, 89
- Fukui et al. (2008) Fukui, Y., Kawamura, A., Minamidani, T., et al. 2008, ApJS, 178, 56
- Glover & Mac Low (2010) Glover, S. C. O. & Mac Low, M. 2010, MNRAS, submitted, arXiv:1003.1340
- Gordon et al. (2010) Gordon, K., Galliano, F., Hony, S., et al. 2010, A&A, this volume
- Griffin et al. (2010) Griffin et al. 2010, A&A, this volume
- Hughes et al. (2010) Hughes, A., Wong, T., Ott, J., et al. 2010, MNRAS, accepted
- Israel (1997) Israel, F. P. 1997, A&A, 328, 471
- Kawamura et al. (2009) Kawamura, A., Mizuno, Y., Minamidani, T., et al. 2009, ApJS, 184, 1
- Kim et al. (2003) Kim, S., Staveley-Smith, L., Dopita, M. A., et al. 2003, ApJS, 148, 473
- Leroy et al. (2007) Leroy, A., Bolatto, A., Stanimirovic, S., et al. 2007, ApJ, 658, 1027
- Leroy et al. (2009) Leroy, A. K., Bolatto, A., Bot, C., et al. 2009, ApJ, 702, 352
- Meixner et al. (2010) Meixner, M., Galliano, F., Hony, S., et al. 2010, A&A, this volume
- Meixner et al. (2006) Meixner, M., Gordon, K. D., Indebetouw, R., et al. 2006, AJ, 132, 2268
- Pagel (2003) Pagel, B. E. J. 2003, in Astronomical Society of the Pacific Conference Series, ed. C. Charbonnel, D. Schaerer, & G. Meynet, Vol. 304, 187–+
- Paradis et al. (2009) Paradis, D., Bernard, J., & Mény, C. 2009, A&A, 506, 745
- Paradis et al. (2010) Paradis, D., Reach, W., Bernard, J.-P., et al. 2010, AJ, submitted
- Rubio et al. (1993) Rubio, M., Lequeux, J., & Boulanger, F. 1993, A&A, 271, 9
- Schaefer (2008) Schaefer, B. E. 2008, AJ, 135, 112
- Stepnik et al. (2003) Stepnik, B., Abergel, A., Bernard, J., et al. 2003, A&A, 398, 551
- Szewczyk et al. (2009) Szewczyk, O., Pietrzyński, G., Gieren, W., et al. 2009, AJ, 138, 1661
- Wolfire et al. (2010) Wolfire, M., Hollenbach, D., & McKee, C. 2010, ApJ, submitted