2Astrophysics Group, Imperial College, Blackett Laboratory, Prince Consort Road, London SW7 2AZ, UK
3Dept. of Physics & Astronomy, University of California, Irvine, CA 92697, USA
4School of Physics and Astronomy, University of Nottingham, University Park, Nottingham NG7 2RD, UK
5Centre for Astrophysics Research, Science and Technology Research Institute, University of Hertfordshire, Herts AL10 9AB, UK
6European Southern Observatory, Karl-Schwarzschild-Str., 85748 Garching b. Muenchen, Germany
7UK Astronomy Technology Center, Royal Observatory Edinburgh, Edinburgh, EH9 3HJ, UK
8School of Physics and Astronomy, Cardiff University, The Parade, Cardiff, CF24 3AA, UK
9Sterrenkundig Observatorium, Universiteit Gent, Krijgslaan 281 S9, B-9000 Gent, Belgium
10Laboratoire d’Astrophysique de Marseille, UMR6110 CNRS, 38 rue F. Joliot-Curie, F-13388 Marseille France
11University of Padova, Department of Astronomy, Vicolo Osservatorio 3, I-35122 Padova, Italy
12Instituto de Astrofísica de Canarias, C/Vía Láctea s/n, E-38200 La Laguna, Spain
13National Radio Astronomy Observatory, PO Box 2, Green Bank, WV 24944, USA
14Scuola Internazionale Superiore di Studi Avanzati, via Beirut 2-4, 34151 Trieste, Italy
15Instituto de Física de Cantabria (CSIC-UC), Santander, 39005, Spain
16Institut d’Astrophysique Spatiale (IAS), B timent 121, F-91405 Orsay, France; and Universit Paris-Sud 11 and CNRS (UMR 8617), France
17Astrophysics Branch, NASA Ames Research Center, Mail Stop 245-6, Moffett Field, CA 94035, USA
18Herschel Science Centre, ESAC, ESA, PO Box 78, Villanueva de la Cañada, 28691 Madrid, Spain
19Oxford Astrophysics, Denys Wilkinson Building, University of Oxford, Keble Road, Oxford, OX1 3RH
20INAF - Osservatorio Astronomico di Padova, Vicolo Osservatorio 5, I-35122 Padova, Italy
21Scottish Universities Physics Alliance, Institute for Astronomy, University of Edinburgh, Royal Observatory, Edinburgh, EH9 3HJ, UK
22Space Science & Technology Dept., CCLRC Rutherford Appleton Laboratory, Oxfordshire, OX11 0QX, UK
23Institut d’Astrophysique de Paris, 98 bis boulevard Arago, 75014 Paris, France
24Caltech, MS247-19, 1200 East California Blvd., Pasadena, CA 91125, USA
25Astronomy Program, Department of Physics and Astronomy, Seoul National University, Shillim Dong, Kwan-ak Gu 151-742, Seoul, Korea
26University College London, Department of Space & Climate Physics, Mullard Space Science Laboratory, Holmbury St. Mary, Dorking, Surrey RH5 6NT, UK
27Institute for Space Imaging Science, University of Lethbridge, Lethbridge, Alberta T1K 3M4, Canada
28Instituto Nacional de Astrofísica, Óptica y Electrónica (INAOE), Luis Enrique Erro No.1, Tonantzintla, Puebla, C.P. 72840, Mexico
29Argelander Institut für Astronomie, Universität Bonn, Auf dem Hügel 71, Room 1.22, 53121 Bonn
30Leiden Observatory, Leiden University, P.O. Box 9513, NL - 2300 RA Leiden, The Netherlands
Herschel ATLAS: The cosmic star formation history of quasar host galaxies††thanks: Herschel is an ESA space observatory with science instruments provided by European-led Principal Investigator consortia with important participation from NASA.
We present a derivation of the star formation rate per comoving volume of quasar host galaxies, derived from stacking analyses of far-infrared to mm-wave photometry of quasars with redshifts and absolute -band magnitudes We use the science demonstration observations of the first deg2 from the Herschel Astrophysical Terahertz Large Area Survey (H-ATLAS) in which there are quasars from the Sloan Digital Sky Survey (SDSS) and a further from the 2dF-SDSS LRG and QSO (2SLAQ) survey. We supplement this data with a compilation of data from IRAS, ISO, Spitzer, SCUBA and MAMBO. H-ATLAS alone statistically detects the quasars in its survey area at at and m. From the compilation as a whole we find striking evidence of downsizing in quasar host galaxy formation: low-luminosity quasars with absolute magnitudes in the range have a comoving star formation rate (derived from m rest-frame luminosities) peaking between redshifts of and , while high-luminosity quasars with have a maximum contribution to the star formation density at . The volume-averaged star formation rate of quasars evolves as at , but the evolution at higher luminosities is much faster reaching at . We tentatively interpret this as a combination of a declining major merger rate with time and gas consumption reducing fuel for both black hole accretion and star formation.
Key Words.:
galaxies: evolution - galaxies: starburst - galaxies: infrared - infrared:galaxies1 Introduction
The cosmic star formation history (e.g. Madau et al. 1996 and others) was quickly realised to bear a striking apparent similarity to the evolving luminosity density of quasars (QSOs) at most redshifts (e.g. Boyle & Terlevich 1998, Franceschini et al. 1999), suggesting a link between the physical drivers of black hole growth and stellar mass assembly. Other data also indirectly suggested links. Mid-infrared spectra (e.g. Genzel et al. 1998, Spoon et al. 2007) and radiative transfer modelling (e.g. Farrah et al. 2002) imply higher luminosity starbursts have increasingly large bolometric fractions from active galactic nuclei (AGN). The tight -band Hubble diagram of far-infrared-selected hyperluminous starbursts also bears a striking similarity to the relation of radiogalaxies (e.g. Serjeant et al. 2003, though see Smail et al. 2004 for their submm-selected counterparts).
A close relationship between black hole growth and stellar mass assembly is also demanded by the observed close correlations betwen supermassive black hole masses and spheroid properties (e.g. Magorrian et al. 1998, Merritt & Ferrarese 2001), which exist despite the enormous disparities of spatial scales and masses. Such correlations are predicted by models with radiative and/or kinetic energy outputs from the AGN regulating the star formation in their host galaxies (e.g. Granato et al. 2006), but these feedback models have many adjustable parameters. Feedback is arguably the principal uncertainty in semi-analytic models of galaxy evolution. One of the few observational approaches available to constrain feedback models is to measure the star formation rates in QSO host galaxies, but so far very few QSOs have direct far-infrared, submm or mm-wave detections from which star formation rates could be inferred.
The Herschel Astrophysical Terahertz Large Area Survey (H-ATLAS, Eales et al. 2010) is the largest open time key project on the Herschel Space Observatory (Pilbratt et al. 2010). The survey aims to map deg2 at five wavelengths from m to depths in the range mJy at m. Among the key science goals is a constraint on the star formation rates of many thousands of QSOs through far-infrared and submm photometry. In preparation, Serjeant & Hatziminaoglou (2009) used a compilation of available far-infrared to mm-wave photometry of QSOs from IRAS, ISO, Spitzer, SCUBA and MAMBO, to predict the numbers of QSOs directly detectable by H-ATLAS. Several hundred QSO direct detections are expected in H-ATLAS and the first H-ATLAS detections are described in e.g. Gonzalez-Nuevo et al. (2010). Serjeant & Hatziminaoglou (2009) also assumed an M82 spectral energy distribution (SED), used observations close to m where possible, and found the stacked m luminosities of QSOs typically scaling roughly as the square root of the optical luminosities with a redshift-dependent normalisation, supporting the idea of coupled black hole mass and stellar mass assemblies. Almost identical results were obtained with an Arp 220 SED. This SED insensitivity can be readily understood: at a fixed bolometric luminosity, the SWIRE template SEDs (Polletta et al. 2007) for the starbursts M82, Arp 220, NGC 6090, IRAS 205514250 and IRAS 224911808 have m monochromatic luminosities all within a factor of two (note that we are only concerned with the starburst bolometric contribution).
In this paper we extend this analysis to the first data from H-ATLAS. We interpret the m luminosities as star formation, since AGN dust tori SEDs are expected to peak in the mid-infrared, (e.g. Efstathiou & Rowan-Robinson 1995, though see the discussion in Netzer et al. 2007). We estimate the mean star formation rate in bins of redshift and absolute magnitude, then use the QSO luminosity function to make the first constraints on the star formation rate per comoving volume of QSOs from and a factor of in optical luminosity. We assume density parameters and and a Hubble constant of km s-1 Mpc-1. -band QSO magnitudes are quoted in the AB system with -corrections assuming and no internal dust extinction correction.

2 Data acquisition and analysis
2.1 Herschel ATLAS
We use only data from the SPIRE instrument (Griffin et al. 2010) in this paper. For more details of the data analysis see Pascale et al. 2010 in prep.; we summarise the main points here. The SPIRE images were registered to a common reference frame using stacking analyses of Sloan Digital Sky Survey (SDSS) galaxies. Neptune was used for flux calibration, requiring multiplicative calibration changes of , and at , and m respectively relative to the previous Ceres flux calibration (Griffin et al. 2010, Swinyard et al. 2010). Jumps in thermometer timelines were identified and corrected using the mean levels on either side of each jump. Thermal drift modelling was achieved through low-pass filtering. Bolometer timelines were filtered using high-pass 4 mHz filtering to remove correlated noise. Maps were made using the naive map maker in HIPE and filtered optimally for point sources.
2.2 Quasar compilations
The survey areas of H-ATLAS were chosen for their supplementary multi-wavelength coverage. The H-ATLAS science demonstration field is covered by the SDSS with QSOs in its spectroscopic QSO catalogue in the field. There are also QSOs from the 2dF-SDSS LRG and QSO (2SLAQ) survey.
We supplement our H-ATLAS QSOs with the compilation from Serjeant & Hatziminaoglou (2009), including the authors’ IRAS ADDSCAN photometry of Palomar-Green QSOs and Spitzer photometry of QSOs from the Spitzer SWIRE legacy survey (Lonsdale et al. 2003, 2004), together with QSOs observed at m or m (Omont et al. 1996, Omont et al. 2001, Carilli et al. 2001, Isaak et al. 2002, Omont et al. 2003, Priddey et al. 2003a, 2003b, Robson et al. 2004, Wang et al. 2007). Figure 1 shows the distribution of our QSO compilation in the optical luminosity–redshift plane. Note that by combining several flux-limited samples we mitigate the effects of Malmquist bias (Teerikorpi 1984), i.e. that in a single flux-limited sample there is a strong degeneracy between luminosity and redshift, making it impossible to decouple evolution effects from luminosity dependence. For the time being we use the working assumption that any subtle biases in e.g. the Palomar-Green sample are not strongly correlated with far-infrared luminosity; in time the full H-ATLAS QSO sample will allow us to make use of a more uniform QSO selection.
3 Methods
We adopt the methodology of Serjeant et al. (2004, 2008, 2009) for comparing QSO fluxes with the flux distributions of the H-ATLAS maps as a whole. We use unweighted means to estimate H-ATLAS QSO fluxes and use the Kolmogorov-Smirnoff statistic to compare flux distributions. The advantage of this statistic is that it contains its own control test, i.e. there is no need for performing stacks on randomised QSO positions.
While most QSOs can only be detected in the far-infrared and submm through stacking analyses, there are a few QSOs with direct detections. How should one combine these? For example, if one has a single non-detection of mJy and single detection of mJy, what can one say about the average flux of this population? Clearly the answer is not mJy. We have adopted the methodology of Serjeant and Hatziminaoglou (2009) and treated flux measurements of individual QSOs as attempts to determine the population mean. The dispersion in the population is an error term on this measurement, which one would add in quadrature to the noise on any individual measurement. We determine the population dispersion from our data and made a simultaneous maximum-likelihood fit to the mean and dispersion . There is no covariance between these parameters because of the independence of signal and noise. Where there are fewer than objects being considered we set . More details can be found in Serjeant & Hatziminaoglou (2009).
We used this method to combine direct detections with non-detections. We also combine the Serjeant & Hatziminaoglou (2009) sample with our H-ATLAS data. We use the point-source-convolved H-ATLAS maps (Pascale et al. 2010). Measurements taken off these maps report the point source flux plus a background flux contribution from other galaxies. To set the latter to zero we convolve our maps with a further kernel with a zero total, i.e. . was set to a constant negative value at radii of to times the point spread function FWHM, with a unit function in its central pixel, and zero everywhere else. After convolution with , every galaxy makes an exactly zero net contribution to the map. If there is a non-zero angular cross-correlation function from galaxies with a physical association with the QSO, then they may still contribute to the far-infrared and submm fluxes. One approach is to use constraints on the angular correlation function of these galaxies to place a bound on this contribution (e.g. Serjeant et al. 2008). However, in this case we are studying the assembly of the stellar mass and the companion galaxies may in time be accreted by the QSO host galaxy. We have therefore chosen to associate all the star formation inferred from the flux in the far-infrared beam with the QSO host galaxy.
4 Results
4.1 Stacking analysis results
We compared the flux measurements at the positions of our H-ATLAS QSOs with the distribution of flux measurements throughout the H-ATLAS maps. The Kolmogorov-Smirnoff statistic rejects the null hypothesis that these are drawn from the same distribution at significance levels of , and at , and m respectively, equivalent to , and . This is not due simply to the presence of bright sources, since removing QSOs with fluxes mJy and comparing with regions of the map with flux measurements mJy still yields significance levels of , and . The average fluxes of the QSOs in the H-ATLAS science demonstration field are mJy ( detection), mJy ( detection) and mJy ( detection).
When calculating m rest-frame luminosities for H-ATLAS QSOs, we use the closest SPIRE filter to m. Table 1 lists our estimates of the mean m rest-frame luminosities of the whole QSO compilation in redshift and optical luminosity bins, using the methodology of Sect. 3. The results are well-fit () by the expression , where , , and at and otherwise. The slope of the luminosity-luminosity correlation is shallower at high redshift, as found by Serjeant & Hatziminaoglou 2009 (see also Mullaney et al. 2010).
QSO number densities at these absolute magnitudes and redshifts are already well-determined. We adopted the luminosity functions of Croom et al. 2004 at and the pure density evolution model of Meiksin 2005 at , with an optical spectral index of to transform to -magnitudes. Between and we interpolate in between these models at fixed optical luminosities. We assume the far-infrared is dominated by giant molecular clouds so /year as appropriate for our assumed SED and a Salpeter initial mass function from to (Kennicutt 1998). Table 1 also lists the comoving star formation densities inferred from .
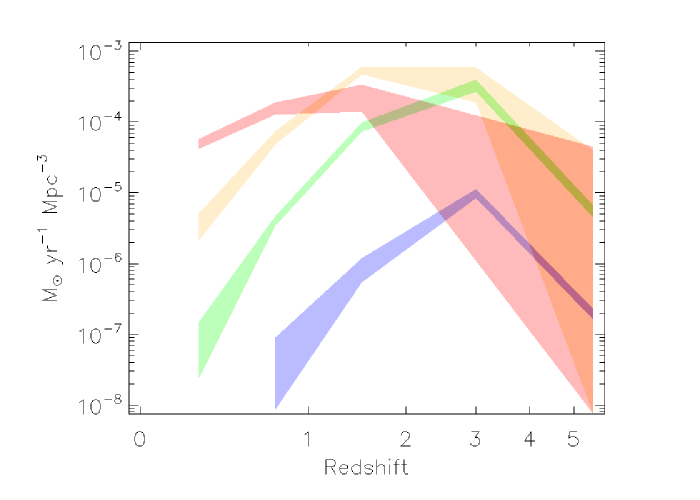
Figure 2 plots the data in table 1, interpolating between the upper and lower bounds of the comoving star formation densities at the mid-points of each redshift bin. The evolution in the comoving star formation density of QSOs from the bin to the bin scales as , but the evolution at higher luminosities is much faster: at the variation is , while at it reaches an astonishing over this redshift range (mostly but not entirely due to the luminosity function). There are no QSOs at at but between the and bins, the evolution of the volume-averaged star formation in QSOs scales as . An important caveat is that we are only addressing the optically-defined QSO population, so we are necessarily missing the type-2 QSOs and Compton-thick objects (see e.g. the discussion in Almaini, Lawrence & Boyle 1999). A similar downsizing effect is seen in the QSO soft X-ray luminosity function (e.g. Hasinger et al. 2005). The type-2 QSO fraction increases with redshift (e.g. Hasinger 2008) which would increase our inferred evolution rates.
| SFD | ||||||
|---|---|---|---|---|---|---|
| (AB) | (AB) | ( yr-1 Mpc-3) | ||||
| 6 | ||||||
| 72 | ||||||
| 29 | ||||||
| 9 | ||||||
| 9 | ||||||
| 73 | ||||||
| 38 | ||||||
| 5 | ||||||
| 2 | ||||||
| 46 | ||||||
| 223 | ||||||
| 75 | ||||||
| 32 | ||||||
| 6 | ||||||
| 52 | ||||||
| 108 | ||||||
| 66 | ||||||
| 1 | ||||||
| 1 | ||||||
| 58 | ||||||
| 64 |
5 Discussion and conclusions
Could the co-evolution of the total cosmic star formation history and total black hole accretion be explained by both being simultaneously driven by major galaxy-galaxy mergers (e.g. di Matteo et al. 2005)? Most star formation at does not seem to be triggered by major mergers (e.g. Bell et al. 2005), but QSO host galaxies often have signs of significant disturbance. This suggests a more complex picture. An alternative possibility proposed by Zheng et al. (2009) is that star formation occurs mainly in disks, while black hole growth occurs separately after major merger events. Any apparent co-evolution in this model is present because the black hole accretion depends on the potential well of the spheroid, which in turn grows through the addition of disrupted disk stars.
Our observation of an unprecedented strong evolution in the star formation rates of the brightest QSOs has no obvious analogue in evolving galaxy populations. This is difficult to accommodate in models with quasi-simultaneous starburst and AGN events sharing a common trigger. Instead, it suggests star formation in bright QSO hosts is not representative of stellar mass assembly in general. We find QSO hosts comprise of the total volume-averaged star formation density of the Universe at all redshifts (e.g. Michałowski et al. 2010).
What could drive the extremely strong downsizing evolution in bright QSOs? If major mergers drive QSO activity, the declining major merger rate at a given halo mass could account for the decreasing QSO number density. However, this is not enough to account for our observations, since we also find that the relationship between optical luminosities (our proxy for black hole accretion rate) and far-infrared luminosities (our proxy for star formation rate) changes with redshift, in the sense that bright QSOs at a fixed optical luminosity were more far-infrared-luminous at high redshifts. One possibility is that less gas is available at low redshift for star formation and black hole accretion, due to consumption in star formation or ejection through feedback mechanisms. The strong decline in the comoving star formation densities of bright QSOs could therefore be due to a double dependence on the availability of gas combined with a declining major merger rate.
Acknowledgements.
We thank the anonymous referee for useful comments. This work was funded in part by STFC (grants PP/D002400/1 and ST/G002533/1). Funding for the SDSS and SDSS-II has been provided by the Alfred P. Sloan Foundation, the Participating Institutions, the NSF, the U.S. Department of Energy, NASA, the Japanese Monbukagakusho, the Max Planck Society, and HEFCE.References
- (1) Almaini, O., Lawrence, A., Boyle, B.J., 1999, MNRAS, 305, L59
- (2) Bell, E.F., et al., 2005, ApJ, 625, 23
- (3) Boyle, B.J., & Terlevich, R.J., 1998, MNRAS, 293, L49
- (4) Carilli, C.L., et al., 2001, ApJ, 555, 625
- (5) Croom, S.M., Smith, R.J., Boyle, B.J., Shanks, T., Miller, L., Outram, P.J., Loaring, N.S., 2004, MNRAS, 349, 1397
- (6) di Matteo, T., Springel, V., Hernquist, L., 2005, Nature, 433, 604
- (7) Eales, S., et al., 2010, PASP, 122, 499
- (8) Efstathiou, A., & Rowan-Robinson M., 1995, MNRAS, 273, 649
- (9) Farrah, D., et al., 2002, MNRAS, 335, 1163
- (10) Franceschini, A., et al., 1999, MNRAS, 310, L5
- (11) Genzel, R., et al., 1998, ApJ, 498, 579
- (12) Gonzalez-Nuevo, J., et al., 2010, A&A, submitted
- (13) Granato, L., et al., 2006, MNRAS, 368, L72
- (14) Griffin, M., et al., 2010, A&A, this volume
- (15) Hasinger, G., 2008, A&A, 905, 922
- (16) Hasinger, G., Miyaji, T., Schmidt, M., 2005, A&A, 441, 417
- (17) Isaak, K.G., et al., 2002, MNRAS, 329, 149
- (18) Kennicutt, R.C., 1998, ApJ, 498, 541
- (19) Londsdale, C.J., et al., 2003, PASP, 115, 897
- (20) Londsdale, C., et al., 2004, ApJS, 154, 54
- (21) Madau, P., et al., 1996, MNRAS, 283, 1388
- (22) Magorrian, J., et al., 1998, AJ, 115, 2285
- (23) Meiksin, A., 2005, MNRAS, 356, 596
- (24) Merritt, D., & Ferrarese, L., 2001, ApJ, 547, 140
- (25) Michałowski, M.J., Hjorth, J., Watson, D., 2010, A&A, in press (arXiv:0905.4499)
- (26) Mullaney, J.R., et al., 2010, MNRAS, 401, 995
- (27) Netzer, H., et al., 2007, ApJ, 666, 806
- (28) Omont, A., et al., 1996, A&A, 315, 10
- (29) Omont, A., et al., 2001, A&A, 374, 371
- (30) Omont, A., et al., 2003, A&A, 398, 857
- (31) Pilbratt, G., et al., 2010, A&A, this volume
- (32) Polletta, M., et al., 2007, ApJ, 663, 81
- (33) Priddey, R.S., et al., 2003a, MNRAS, 339, 1183
- (34) Priddey, R.S., et al., 2003b, 344, L74
- (35) Robson, I., et al., 2004, MNRAS, 344, L74
- (36) Serjeant, S., Gruppioni, C., Oliver, S., 2002, MNRAS, 330, 621
- (37) Serjeant, S., et al., 2003, MNRAS, 346, L51
- (38) Serjeant, S., et al., 2004, ApJS, 154, 118
- (39) Serjeant, S., et al., 2008, MNRAS, 386, 1907
- (40) Serjeant, S., & Hatziminaoglou, E., 2009, MNRAS, 397, 265
- (41) Smail, I., et al., 2004, ApJ, 616, 71
- (42) Spoon, H.W.W., et al., 2007, ApJ, 654, L49
- (43) Swinyard, B., et al., 2010, A&A, this volume
- (44) Teerikorpi, P., 1984, A&A, 141, 407
- (45) Wang, R., et al., 2007, AJ, 134, 617
- (46) Zheng, X.Z., et al., 2009, ApJ, 707, 1566