11email: bschulz@ipac.caltech.edu 22institutetext: Infrared Processing and Analysis Center, MS 100-22, California Institute of Technology, JPL, Pasadena, CA 91125, USA 33institutetext: Space Science & Technology Department, Rutherford Appleton Laboratory, Chilton, Didcot, Oxfordshire OX11 0QX, UK 44institutetext: Institute for Space Imaging Science, University of Lethbridge, Lethbridge, Alberta, T1K 3M4, Canada 55institutetext: Astrophysics Group, Imperial College London, Blackett Laboratory, Prince Consort Road, London SW7 2AZ, UK 66institutetext: Herschel Science Centre, European Space Astronomy Centre, Villanueva de la Cañada, 28691 Madrid, Spain 77institutetext: Dept. of Physics & Astronomy, University of California, Irvine, CA 92697, USA 88institutetext: Institute for Astronomy, University of Edinburgh, Royal Observatory, Blackford Hill, Edinburgh EH9 3HJ, UK 99institutetext: Cardiff School of Physics and Astronomy, Cardiff University, Queens Buildings, The Parade, Cardiff CF24 3AA, UK 1010institutetext: Laboratoire AIM-Paris-Saclay, CEA/DSM/Irfu - CNRS - Université Paris Diderot, CE-Saclay, pt courrier 131, F-91191 Gif-sur-Yvette, France 1111institutetext: Jet Propulsion Laboratory, 4800 Oak Grove Drive, Pasadena, CA 91109, USA 1212institutetext: Laboratoire d’Astrophysique de Marseille, OAMP, Université Aix-marseille, CNRS, 38 rue Frédéric Joliot-Curie, 13388 Marseille cedex 13, France 1313institutetext: Instituto de Astrofísica de Canarias (IAC), E-38200 La Laguna, Tenerife, Spain 1414institutetext: Departamento de Astrofísica, Universidad de La Laguna (ULL), E-38205 La Laguna, Tenerife, Spain 1515institutetext: Dept. of Astrophysical and Planetary Sciences, CASA 389-UCB, University of Colorado, Boulder, CO 80309, USA 1616institutetext: Observational Cosmology Lab, Code 665, NASA Goddard Space Flight Center, Greenbelt, MD 20771, USA 1717institutetext: Dipartimento di Astronomia, Università di Padova, vicolo Osservatorio, 3, 35122 Padova, Italy 1818institutetext: Department of Physics & Astronomy, University of British Columbia, 6224 Agricultural Road, Vancouver, BC V6T 1Z1, Canada 1919institutetext: ESO, Karl-Schwarzschild-Str. 2, 85748 Garching bei München, Germany 2020institutetext: UK Astronomy Technology Centre, Royal Observatory, Blackford Hill, Edinburgh EH9 3HJ, UK 2121institutetext: Institut d’Astrophysique Spatiale (IAS), bâtiment 121, Université Paris-Sud 11 and CNRS (UMR 8617), 91405 Orsay, France 2222institutetext: School of Physics and Astronomy, The University of Manchester, Alan Turing Building, Oxford Road, Manchester M13 9PL, UK 2323institutetext: Astronomy Centre, Dept. of Physics & Astronomy, University of Sussex, Brighton BN1 9QH, UK 2424institutetext: Institut d’Astrophysique de Paris, UMR 7095, CNRS, UPMC Univ. Paris 06, 98bis boulevard Arago, F-75014 Paris, France 2525institutetext: Mullard Space Science Laboratory, University College London, Holmbury St. Mary, Dorking, Surrey RH5 6NT, UK 2626institutetext: Astrophysics, Oxford University, Keble Road, Oxford OX1 3RH, UK 2727institutetext: Centre for Astrophysics Research, University of Hertfordshire, College Lane, Hatfield, Hertfordshire AL10 9AB, UK
HerMES: The Submillimeter Spectral Energy Distributions of Herschel/SPIRE-Detected Galaxies††thanks: Herschel is an ESA space observatory with science instruments provided by European-led Principal Investigator consortia and with important participation from NASA.
We present colours of sources detected with the Herschel/SPIRE instrument in deep extragalactic surveys of the Lockman Hole, Spitzer-FLS, and GOODS-N fields in three photometric bands at 250, 350 and 500 m. We compare these with expectations from the literature and discuss associated uncertainties and biases in the SPIRE data. We identify a m flux limited selection of sources from the HerMES point source catalogue that appears free from neighbouring/blended sources in all three SPIRE bands. We compare the colours with redshift tracks of various contemporary models. Based on these spectral templates we show that regions corresponding to specific population types and redshifts can be identified better in colour-flux space. The redshift tracks as well as the colour-flux plots imply a majority of detected objects with redshifts at 1z3.5, somewhat depending on the group of model SEDs used. We also find that a population of S250/S at fluxes above 50 mJy as observed by SPIRE is not well represented by contemporary models and could consist of a mix of cold and lensed galaxies.
Key Words.:
Submillimeter: galaxies - Galaxies: evolution - Galaxies: high-redshift1 Introduction
Galaxy formation and evolution are major topics in cosmology and astrophysics. Recently, sophisticated computer simulations based on hierarchical formation (eg. (Springel et al. 2005)) and deep cosmological surveys across the electromagnetic spectrum have transformed the field from a collection of a few hypothetical models to a mature science that is profoundly shaping our understanding of the universe. The Spectral and Photometric Imaging Receiver (SPIRE, (Griffin et al. 2010)), on board of ESA’s Herschel observatory (Pilbratt et al. 2010), opens a new window between 250 – 500 for observations of heavily dust obscured high redshift ( – 3) galaxies. The combination of sensitivity and high resolution provided by its 3.5m telescope, the largest ever launched, allows large area confusion limited far-infrared and submillimeter (FIR/submm) surveys to reach unprecedented depths, exploring previously undetectable remote galaxy populations. Studies of the integrated cosmic background light have shown that at least half the radiation from all galaxies lies in the FIR/submm. In particular, galaxies at radiate mostly in this band Lagache et al. (2005). The peak of the spectral energy distribution (SED) from these galaxies is redshifted into the SPIRE bands. Deep SPIRE surveys will thus provide a new census of the energy budget in galaxies, especially for the most energetic dust-rich objects.
In this paper we investigate SPIRE colours in three bands, 250 , 350 , and 500 , of a sample of sources selected at 500 in four Science Demonstration Phase (SDP) fields of the Herschel Multi-tired Extragalactic Survey (HerMES111hermes.sussex.ac.uk) key project (Oliver et al. 2010). Our goal is to constrain the evolution of the IR SED of FIR/submm galaxies (i.e. the SED vs. redshift relation). In particular we want to examine whether there is a new population of submm galaxies whose SEDs do not match the predictions of current models.
2 Observations and data processing
The HerMES key project is constructed in order to obtain a complete bolometric census of star-formation in the Universe. It consists of 6 tiers of survey fields with increasing depth over smaller areas, covering most of the fields on the sky observed across the electromagnetic spectrum by state-of-the-art facilities plus individual selected clusters. A total of 4 HerMES fields were surveyed during Herschel’s SDP and we have used the deep observations in GOODS-N, Lockman-North, FLS, and Lockman-SWIRE for our analysis. The covered areas are 0.25, 0.34, 5.81 and 13.2 deg2 respectively with relative depths of 1.0, 0.23, 0.05, 0.033 that were calculated as the fraction of the number of repeats and scan speed, normalised to the deepest field GOODS-N. More details of the observations are given by Oliver et al. (2010).
Data processing based on the standard SPIRE Scan Map Pipeline (Griffin et al. 2008) yielded maps in the three SPIRE bands, and source catalogues for each individual band were generated using the SUSSEXtractor software (Savage & Oliver 2007) within HIPE 3.0 (Ott et al. 2006). The three shallower maps were smoothed with point-source optimised filters while the deepest map was filtered with a delta function to find sources and separately with a pixel point source response function (PRF) to extract the fluxes (Oliver et al. 2010). The FLS and Lockman-SWIRE fields were Wiener filtered to reduce effects by diffuse Cirrus. For the source extraction a Gaussian PRF was assumed, with FWHM of 18.2′′, 25.2′′ and 36.3′′ for the SPIRE 250, 350 & 500 m bands, respectively. Details of the procedure are given by Oliver et al. (2010) and Smith et al. (2010). They attained formal 1- point source uncertainties of 5.7, 7.4 and 7.8 mJy for GOODS-N, 7.0, 8.5 and 8.8 mJy for Lockman-North, 9.0, 10.3 and 10.6 mJy for FLS, and 11.1, 16.9 and 15.1 mJy for Lockman-SWIRE, respectively. These numbers include a contribution from source confusion of approximately 5.6, 7.4, and 7.7 mJy for GOODS-N, 6.8, 8.3 and 8.5 mJy for Lockman-North, 8.4, 9.8, 9.7 mJy for FLS, and 8.5, 13.9, 10.2 for Lockman-SWIRE. For the two deepest fields Smith et al. (2010) attribute the differences to the results of Nguyen et al. (2010), and the differences between the fields mainly to the source extraction method used.
The catalogues contain additional parameters to allow for quality checking and source selection. These are: i) A formal error in the flux measurement, propagated through from the error maps created by the map-maker, representing a fair estimate of the instrumental noise. ii) A total error that is the quadratic co-addition of instrument noise and average estimated confusion noise over the map. iii) Two separate flux estimates for the same positions using two different halves of the data (half-maps), separated in time, allowing for the detection and exclusion of spurious sources, mostly due to high energy particle hits.
3 Catalogue cross association
The starting point for the cross-association process is this set of individual SPIRE band catalogues. For the current work the emphasis is on the creation of a robust, un-confused sample of sources that has the highest probability for its colours to originate from single unblended galaxies. We only consider the central regions of the maps, that have full homogeneous coverage by all scans. To protect against spurious sources, we compare fluxes separately derived from two independent half-maps. The ratio of the two flux estimates separates well into 3 distributions. Spurious sources are removed by excluding ratios above 5 and below . For this work we have constructed a 500 m band flux limited selection. It is justified in three ways: i) The stronger negative -correction means selection in this band favours higher redshift galaxies; ii) This is a relatively new band as yet only explored by much shallower BLAST surveys (Devlin et al. 2009); iii) About % of 500 m selected sources are also detected in the other SPIRE bands. We require a signal-to-total-noise (S/N) ratio of more than 3 in the 500 m filter. The formal average flux uncertainties at 500 m derived from the source extractor results are only 1.1, 2.1, 4.4, and 11.6 mJy. We consider these to be instrumental noise, based on their ratio, consistent with the 30, 7, 2, and 1 repetitions executed on the four fields, respectively, and the confusion noise at 500 m of 6.80.4 reported by Nguyen et al. (2010). Thus the uncertainties are completely dominated by extragalactic confusion for the first two fields and increased for FLS and Lockman-SWIRE. We calculate the following effective average flux limits in our fields from 3 times the average total error of all sources with S/N: 23.4, 26.4, 32.0, and 46.4 mJy for GOODS-N, Lockman-North, FLS, and Lockman-SWIRE respectively. The selection leaves 48, 61, 608, and 824 sources at 500 m in the 4 bands respectively. This conservative threshold also minimises the impact of flux boosting on the derived colours of the sources.
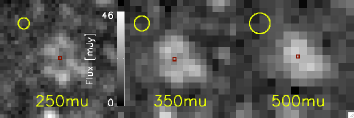
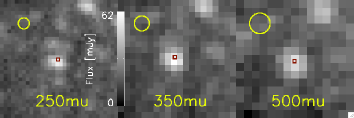
To further de-blend and cross-match, first, all 500 m sources without another 500 m source within an 18′′ radius are selected. This radius was chosen to be similar to the beam size at 500 m. Then for these remaining sources, the same 18′′ radius is checked in the other two bands. Sources with more than one source in a different band are discarded immediately. In case only one source is found in the other band, it must be within a radius of 8′′ in order to be accepted as a cross identification, otherwise the source is considered blended and discarded. This radius was chosen to include 3- of the telescope pointing error and the estimated PRF fit error of each. We end up with a list of potentially uncontaminated 500 m sources that is then cross matched with the lists of the other two bands with a match radius of 8′′. In Figure 1 the dangers of simple naive associations are emphasised, where a cluster of sources shows up as being detected as single at 500 m by the point source extractor, but revealing multiple counterparts at 250 m. This sample is largely free from contamination and should have reliable fluxes originating from just one source, accurate at a 30 level or better. The final matched source numbers for the four fields respectively are 21, 38, 242, and 244.
4 Analysis
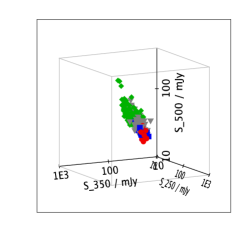
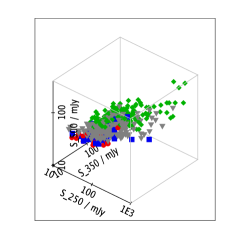
In Figure 2 we plot the 3-dimensional SPIRE flux-flux-flux parameter space for our band merged catalogue. The fluxes are grouped around a relatively flat and thin surface in the 250 m, 350 m, 500 m parameter space. The same even thinner surface is seen in similar plots of mock catalogue data that is discussed later. Thus, although we have flux data in three SPIRE bands, in principle only two parameters are needed to describe the information. This degeneracy follows from the fact that the spectral energy distributions (SEDs) in the submm, which SPIRE observes, are dominated by dust emission that have very similar shapes and result in fairly well defined flux ratios. Thus, the main parameters determining the three SPIRE fluxes, are rather wavelength of the emission peak and luminosity.
4.1 Colour - colour parameter space and model comparison
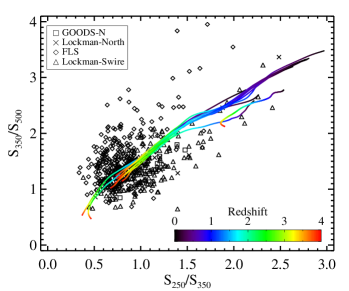
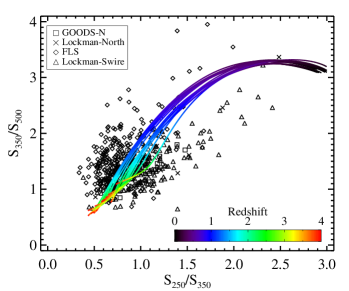
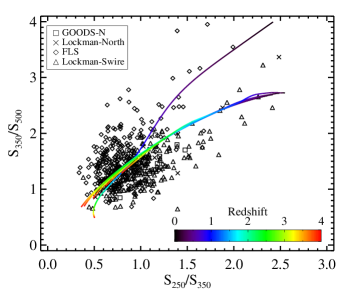
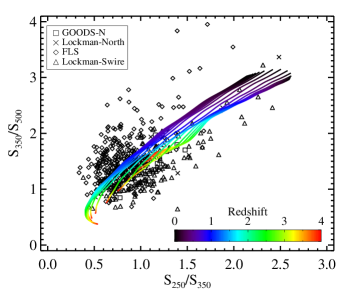
In the Figure 3 the S250/S350 - S350/S500 colour-colour diagrams for SPIRE sources in the SDP survey fields are shown with the colour tracks from the contemporary galaxy evolution models of Pearson et al. (2007), Dale & Helou (2002), Xu et al. (2001) & Lagache et al. (2003) over-plotted on individual panels. The redshift of the tracks is shown in colour and ranges from 0 to 4.
In general, all the models are consistent with the obtained SPIRE colours, except from individual subtleties of the models. However, especially the SED templates of Pearson et al. (2007) and Lagache et al. (2003) lack diversity in dust illumination conditions to cover the spread of colours sufficiently. All models agree: the colours imply that the SPIRE population is not local but rather the bulk lies at redshifts between 1 and 3.5. We note that the Xu et al. (2001) and Dale & Helou (2002) models tend to place the population at somewhat lower redshift than the other two. This implies that the Pearson et al. (2007) and Lagache et al. (2003) model SEDs contain generally warmer dust, which is confirmed by plots of the emission maxima of the SEDs.
4.2 Colour - flux parameter space
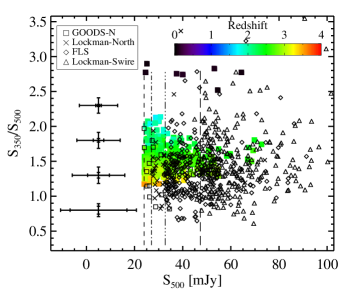
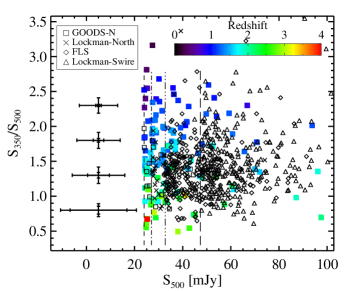
To overcome the apparent degeneracy in the SPIRE colours (Figure 2), we plot colour-flux distributions. In Figure 4 we show the S250/S350 colour versus 500 m flux density distributions for the SPIRE sources. A few sources at S500 mJy are not shown to improve visibility. The symbols indicate the different fields according to the legend in the upper left corner. The four crosses on the left are in the same vertical order as the symbols in the legend and represent the averaged uncertainties in the four fields. Different tick marks show instrumental and total components. The four vertical lines indicate from left to right, the effective flux limits of GOODS-N, Lockman-North, FLS, and Lockman-SWIRE respectively. In both panels of Figure 4 the observed data are compared to mock catalogues of 1 deg2 on the sky by Pearson et al. (2007) (left) and Xu et al. (2001) (right) that were cut below the effective flux limit of GOODS-N. Again the most notable difference is the larger spread of the Xu et al. (2001) colours due to a larger number and diversity of SED models. In both models the bulk of objects are Starburst galaxies, LIRGs and ULIRGs, that are grouped around a colour of S250/S1.1.
The high-redshift sources populate a specific area of the colour plane in both models, although the redshift distributions are different. In the Pearson et al. (2007) model the highest redshift objects, z3 occupy the parameter space corresponding to S250/S350 colours 1.0 with S40mJy, while the Xu et al. (2001) model locates the z3 region rather at S250/S0.8 and the same flux cutoff, but with fewer objects and mixed with many low redshift SEDs. Similar cuts can be made for z2 sources. Lower redshift sources may also be excluded by virtue of their higher S250/S350 colours.
The SPIRE data generally overlap fine at S50060, except for colours of S250/S. Especially the Pearson et al. (2007) model shows no objects below this limit, while the same region is sparsely populated by the Xu et al. (2001) model SEDs. Looking at the model types, it turns out that those are mainly AGN, which are missing entirely in the Pearson et al. (2007) SED catalogue. Neither model covers sufficiently the increasingly redder colours in this region that SPIRE observes towards 500 m fluxes above 50 mJy. A comparison with another mock catalogue by Valiante et al. (2009) shows the same lack of red sources.
A considerable fraction of submm bright sources are expected to be lensed by foreground galaxies (Negrello et al. 2007). Since lensing magnification is wavelength independent, such lensed sources appear in their intrinsic positions in the colour-colour diagram, but their locations in the colour-flux plane would be offset to brighter fluxes (towards the right side of Fig. 4 along the x-axis), while keeping colours the same. Using the models of Negrello et al. (2007) and Negrello priv. comm. (2010) we estimate that of all objects with fluxes S mJy and redshift 2z3, almost all are lensed. For our 19.6 deg2 total sky area, that would be 2-3 out of the 24 bright 500 m sources we have identified, although this is a lower limit, as our selection procedure may bias slightly against clustered and as such potentially lensed sources.
For now we conclude that we see a population of red bright objects that may consist mostly of colder SEDs but with a fraction of distant lensed ones. Inclusion of other wavelengths as shown by Rowan-Robinson et al. (2010) will be needed for further interpretation.
Acknowledgements.
SPIRE has been developed by a consortium of institutes led by Cardiff Univ. (UK) and including Univ. Lethbridge (Canada); NAOC (China); CEA, LAM (France); IFSI, Univ. Padua (Italy); IAC (Spain); Stockholm Observatory (Sweden); Imperial College London, RAL, UCL-MSSL, UKATC, Univ. Sussex (UK); and Caltech, JPL, NHSC, Univ. Colorado (USA). This development has been supported by national funding agencies: CSA (Canada); NAOC (China); CEA, CNES, CNRS (France); ASI (Italy); MCINN (Spain); SNSB (Sweden); STFC (UK); and NASA (USA). Support for this work was provided by NASA through an award issued by JPL, Caltech. Data presented in this paper were analyzed using The Herschel Interactive Processing Environment (HIPE) , a joint development by the Herschel Science Ground Segment Consortium, consisting of ESA, the NASA Herschel Science Center, and the HIFI, PACS and SPIRE consortia. The data presented in this paper will be released through the Herschel Database in Marseille HeDaM222hedam.oamp.fr/HerMES. This work made substantial use of TOPCAT written by Mark Taylor333www.starlink.ac.uk/topcat. We thank Mattia Negrello for predictions of lensed counts. Many thanks also to George Helou and an anonymous referee for helpful comments.References
- Dale & Helou (2002) Dale, D. A., & Helou, G. 2002, ApJ, 576, 159
- Devlin et al. (2009) Devlin, M., Ade P.A.R., Aretxaga, I. et al., 2009, Nature, 458, 737
- Griffin et al. (2008) Griffin, M., Dowell, D.C., Lim, T., et al. 2008, Proc. SPIE, 7010, 70102,
- Griffin et al. (2010) Griffin, M. et al. 2010, A&A, this issue
- Lagache et al. (2003) Lagache, G., Dole, H., Puget, J.-L., 2003, MNRAS, 338, 555
- Lagache et al. (2005) Lagache, G., Puget, J.-L., & Dole, H. 2005, ARA&A, 43, 727
- Negrello et al. (2007) Negrello, M., Perrotta, F., González-Nuevo, J. et al. 2007, MNRAS, 377, 1557
- Negrello priv. comm. (2010) Negrello, M., priv. comm.
- Nguyen et al. (2010) Nguyen, H. T., Schulz, B., Levenson, L. et al., 2010, A&A, this issue
- Oliver et al. (2010) Oliver, S. et al., 2010, A&A, this issue
- Ott et al. (2006) Ott, S., et al. 2006, Astron. Data Analysis Software and Systems XV, 351, 516
- Pilbratt et al. (2010) Pilbratt, G. et al., 2010, A&A, this issue
- Pearson et al. (2007) Pearson C., Jeong, W.S., Matsuura S. et al., 2007, Adv. Sp. Res., 40, 605
- Rowan-Robinson et al. (2010) Rowan-Robinson M., et al., 2010, MNRAS, in prep.
- Savage & Oliver (2007) Savage, R. S., & Oliver, S. 2007, ApJ, 661, 1339
- Smith et al. (2010) Smith, A. et al., 2010, MNRAS, in prep.
- Springel et al. (2005) Springel, V., et al. 2005, Nature, 435, 629
- Valiante et al. (2009) Valiante, E., Lutz, D., Sturm, E., et al. 2009, ApJ, 701, 1814
- Xu et al. (2001) Xu, C., Lonsdale, C.J., Shupe, D.J. et al. 2001, Apj 562 179